HAL Id: hal-02989817
https://hal.sorbonne-universite.fr/hal-02989817
Submitted on 5 Nov 2020
HAL is a multi-disciplinary open access
archive for the deposit and dissemination of
sci-entific research documents, whether they are
pub-lished or not. The documents may come from
teaching and research institutions in France or
abroad, or from public or private research centers.
L’archive ouverte pluridisciplinaire HAL, est
destinée au dépôt et à la diffusion de documents
scientifiques de niveau recherche, publiés ou non,
émanant des établissements d’enseignement et de
recherche français ou étrangers, des laboratoires
publics ou privés.
expression noise and protein mean abundance in bacteria
A. Deloupy, V. Sauveplane, J. Robert, S. Aymerich, M. Jules, L. Robert
To cite this version:
A. Deloupy, V. Sauveplane, J. Robert, S. Aymerich, M. Jules, et al.. Extrinsic noise prevents the
independent tuning of gene expression noise and protein mean abundance in bacteria. Biochem. (Life
Sci. Adv.), 2020, 6 (41), pp.eabc3478. �10.1126/sciadv.abc3478�. �hal-02989817�
G E N E T I C S
Extrinsic noise prevents the independent tuning
of gene expression noise and protein mean
abundance in bacteria
A. Deloupy1*, V. Sauveplane2*, J. Robert1, S. Aymerich2, M. Jules2†, L. Robert1,2†
It is generally accepted that prokaryotes can tune gene expression noise independently of protein mean abundance by varying the relative levels of transcription and translation. Here, we address this question quantitatively, using a custom-made library of 40 Bacillus subtilis strains expressing a fluorescent protein under the control of different transcription and translation control elements. We quantify noise and mean protein abundance by fluorescence microscopy and show that for most of the natural transcription range of B. subtilis, expression noise is equally sensitive to variations in the transcription or translation rate because of the prevalence of extrinsic noise. In agreement, analysis of whole-genome transcriptomic and proteomic datasets suggests that noise optimization through transcription and translation tuning during evolution may only occur in a regime of weak transcription. Therefore, independent control of mean abundance and noise can rarely be achieved, which has strong implica-tions for both genome evolution and biological engineering.
INTRODUCTION
Understanding the sources of diversity among individuals in a pop-ulation has been a long-standing problem in biology. Genetic vari-ability and environment account for most of this diversity. However, genetically identical individuals sharing the same environment still exhibit some phenotypic variability. This variability has been observed for more than half a century (1–3), and its mechanistic origins and evolutionary consequences have been intensively studied in the past decades (4–6).
Phenotypic variability stems from the stochastic nature of intra-cellular biochemical processes, in particular, gene expression. Gene expression involves many molecular events requiring the random encounter of chemical species that are present in small numbers in-side the cell, leading to stochastic births and deaths of mRNAs and proteins (“intrinsic noise”) (4, 7). In addition, gene expression relies on many molecules such as polymerases, ribosomes, nucleotides, or amino acids, whose concentration can fluctuate inside the cell, cre-ating a stochastic environment for the protein production process (“extrinsic noise”) (4, 7). The intrinsic and extrinsic components of noise can be assessed using the dual-reporter method developed by Elowitz et al. (4), who found that both extrinsic and intrinsic sources can substantially contribute to noise in prokaryotic gene expression.
Gene expression can be divided into two main steps, namely, transcription and translation. The relative contribution of these two processes to noise generation has been investigated both theo-retically and experimentally (8–11). The classical two-stage model of gene expression, which describes the temporal evolution of the number of mRNA molecules and the number of proteins as two Markovian birth and death processes (12), predicts a different impact of transcription and translation on gene expression noise (6, 8, 12, 13). In particular, in this model, the Fano factor of the protein copy number distribution, i.e., the variance divided by the mean, increases linearly with the rate of translation but is independent of the rate of
transcription (8). This differential effect of translation and tran-scription on noise reflects the importance of mRNA fluctuations in protein expression noise. mRNAs are present in small numbers in the cells and are therefore subject to strong fluctuations. mRNA fluctuations generate fluctuations in protein abundance, whose amplitude depends on the efficiency of translation, a phenomenon called translational bursting (6, 13, 14). The translational bursting mechanism was experimentally tested by Ozbudak et al. (9), who constructed four Bacillus subtilis strains expressing the green fluo-rescent protein (GFP) under an inducible promoter but four different translation control elements. Measuring GFP abundance in single cells by flow cytometry, for the four different strains under different induction conditions, Ozbudak et al. (9) concluded that the Fano factor (variance divided by the mean), also called the “noise strength,” linearly depends on the translation rate but is largely independent of the transcription rate, confirming the translational bursting mechanism predicted by the two-stage model. As a result, the mean abundance of a protein and the expression noise have been deemed to be independently controllable through combinations of transcrip-tion and translatranscrip-tion control elements.
Noise in intracellular processes can limit the performance of the cell by driving it away from the optimal concentration of its molecular components (15–18). In contrast, it can also be used to create diver-sity in a clonal population. This diverdiver-sity can be the basis for bet- hedging strategies in case of fluctuating environments (19–22), and it allows division of labor (23). Consequently, noise optimization can lead to substantial selective forces acting on genome evolution (5). It has, for instance, been shown that some regulatory motifs, such as negative feedback loops, can decrease the level of noise (24). These motifs can therefore be selected for during evolution on the basis of their noise reduction property. Likewise, the position of the gene in the genome can affect its expression noise (25, 26), and noise optimization has thus been proposed to exert a selective force on genome organization. The independent control of mean abundance and noise by translation and transcription control elements, such as that described by Ozbudak et al. (9), offers a particularly simple way to modulate the level of noise in the expression of a given gene. In other words, a given mean expression level can then be achieved
1Laboratoire Jean Perrin, Sorbonne Université, UMR 8237, 75005 Paris, France. 2Université Paris-Saclay, INRAE, AgroParisTech, Micalis Institute, 78350 Jouy-en-Josas, France.
*These authors contributed equally to this work.
†Corresponding author. Email: lydia.robert@sorbonne-universite.fr (L.R.); matthieu.jules@ inrae.fr (M.J.)
Copyright © 2020 The Authors, some rights reserved; exclusive licensee American Association for the Advancement of Science. No claim to original U.S. Government Works. Distributed under a Creative Commons Attribution NonCommercial License 4.0 (CC BY-NC). on November 5, 2020 http://advances.sciencemag.org/ Downloaded from
through different strategies leading to different noise levels: with a strong transcription and weak translation, leading to low noise levels, or with a weak transcription and strong translation, leading to high noise levels (6, 9). This would have important implications both for genome evolution and for synthetic biology and biological engineering, where the genetic elements controlling transcription and translation could be tuned to reduce noise and optimize a bioproduction process (27).
The translational bursting mechanism predicted by the two-stage model and evidenced in B. subtilis (9) is in agreement with later system-wide analysis in yeasts. A large number of naturally expressed proteins in Saccharomyces cerevisiae showed a scaling between pro-tein abundance and noise, where the squared coefficient of variation is proportional to the inverse of the mean (28, 29). This scaling was interpreted as the result of mRNA fluctuations (28, 29). Similar system- wide analysis in the model bacterium Escherichia coli revealed that a similar scaling exists for very weakly expressed genes (30). However, it does not hold for most of the proteome (30), question-ing the generality of translational burstquestion-ing. Although translational bursting is generally assumed to be the main mechanism underlying noise generation in prokaryotes, the experimental evidence is still scarce. To our knowledge, the study of Ozbudak et al. (9) is the only one where the effects of transcription and translation on noise were independently measured. Although the results of this study are co-herent with theoretical predictions, this simple picture is clouded by several issues. First, the two-stage model is based on several questionable assumptions, such as the Poissonian production of mRNAs (31, 32), and it only describes intrinsic noise. Second, the experimental data of Ozbudak et al. (9) are based on only four strains with different translation control elements, and transcription is varied using an inducible promoter, whereas noise at intermediate induction levels are known to be strongly affected by extrinsic fluctuations in the activity of the regulatory protein mediating induction (4).
Translational bursting and the associated differential effect of transcription and translation rates on noise are often evoked as the basis for noise optimization strategies. Given the discrepancy between the importance of the result and the scarcity of experimental evi-dence, we decided to revisit the relative contributions of transcription and translation in prokaryotic gene expression noise. To that end, we implemented a strategy similar to the one developed by Ozbudak et al. (9), allowing us to test independently the effect of translation and transcription. We designed a library of 40 strains of B. subtilis, where the chromosomally inserted gene of GFPmut3 is expressed under the control of a combination of different translation and transcription control elements. As a result, the fluorescence of the strains covers a wide range of expression that is representative of the entire natural range of expression in B. subtilis. For each strain, the fluorescence was quantified at the single-cell level using fluorescence microscopy and flow cytometry. We showed that in contrast to the prediction of the two-stage model and to previous experimental findings in B. subtilis (9), the noise strength (or Fano factor) increases linearly with both transcription and translation rates. Using the dual- reporter method designed by Elowitz et al. (4), we showed that this unexpected result can be explained by extrinsic noise.
RESULTS
Design of the 40-strain custom-made library
We designed a library of 40 B. subtilis strains in which the gene of the GFPmut3 protein is inserted into the chromosome and expressed
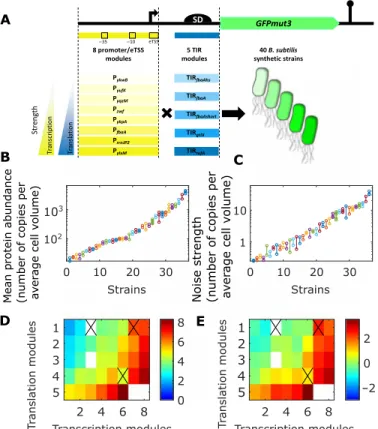
under the control of a combination of eight different transcription control elements (transcription modules) and five different transla-tion control elements (translatransla-tion modules) (Fig. 1A). The different strains and their control elements are listed in table S1. The transla-tion modules consist of natural (fbaA, gtlX, and tufA) or synthetic (fbaAhs and fbaAshort) translation initiation regions (TIRs), defined as the 5′ untranslated region deprived of the first eight nucleotides. Our transcription modules contain natural promoters, defined as the 50 base pairs (bp) preceding the first transcribed nucleotide and including the −35 and −10 boxes. The transcription start site (TSS), i.e., the first transcribed nucleotide, is known to affect the efficiency of initiation, and the site of initiation can vary by a few bases between several initiation events (33). Therefore, we decided to extend our transcription module beyond the promoter and include the extended TSS (eTSS), defined as the first eight transcribed nucleotides (34). The different promoters and TIRs were chosen to ensure a wide range of expression on the basis of data from Nicolas et al. (35) and Borkowski et al. (36). We constructed 37 of the 40 designed strains. For the three remaining strains, repeated failures in the construction suggest that for some uncharacterized reasons, the designed sequences impose a strong burden to the cells. Further details on the design and construction of the library can be found in the Supplementary Materials.
Quantification of protein concentration in single cells under controlled growth conditions
For all the strains in the library, we quantified the fluorescence at the single-cell level using both epifluorescence microscopy and flow cytometry. Flow cytometry allows fast, high-throughput data acqui-sition but is less accurate and sensitive than fluorescence micros-copy. In consequence, only 21 of the 37 strains of the library produced a quantifiable signal in cytometry. In contrast, the fluorescence of all the strains was quantified using microscopy, except the S27 strain, which had an unexpectedly low fluorescence that was indis-tinguishable from the natural autofluorescence of B. subtilis. In addition, for our analysis, the fluorescence signal has to be normalized by cell size to eliminate the variability coming from the cell cycle. Cell size can be directly measured from microscopy images, whereas it can only be coarsely estimated from cytometry measurements on the basis of the forward scatter signal (FSC). Therefore, we focused here on microscopy measurements and used flow cytometry as a control, ensuring that our conclusions are supported by data obtained using two independent measurement methods. The mean fluorescence and noise strength of the strains measured using cytometry are in agree-ment with microscopy measureagree-ments (fig. S1), and all the conclu-sions presented thereafter are supported by both cytometry and microscopy measurements.
Translation and transcription rates can vary substantially with the rate of growth, in a way that is dependent on the sequences con-trolling expression (35, 36). As a consequence, to characterize gene expression noise in our library, the growth rate has to be reproducibly controlled between experiments. We therefore performed fluorescence measurements on cells that are in a steady state of “balanced” growth (37). More precisely, we plated diluted cell precultures on agarose pads and let single cells grow into microcolonies. We monitored micro-colony growth, waited six to eight generations, allowing the growth rate to reach its steady-state value, and imaged ca. 30 microcolonies, in phase contrast and fluorescence. Analyzing microcolony growth rates, we found that their variations were limited (coefficient of variation, ~14%), were mainly due to interexperiment variability, and did
on November 5, 2020
http://advances.sciencemag.org/
not significantly affect the fluorescence measurements (text S1). Single cells within microcolonies were segmented from phase con-trast images, and their fluorescence was measured and normalized by the segmented cell area. Fluorescence values were then normal-ized to actual protein concentrations based on fluorescence mea-surements performed on strains with known protein abundances (see Materials and Methods).
For each strain, we performed at least two replicate experiments. Figure 1 (B and C) shows that fluorescence measurements were
re-producible between replicate experiments. This can be more quan-titatively addressed using a partition of variance such as that per-formed in a one-way analysis of variance (ANOVA). This analysis shows that for both mean fluorescence and noise strength, >95% of the variance observed between experiments is explained by the dif-ferent strains used, whereas the residual variance corresponding to replicate experiments is <5% (see text S1).
The mean expression is mainly determined by independent effects of the transcription and translation modules
As shown in Fig. 1B, the library covers a 200-fold range of expres-sion levels, which is representative of natural expresexpres-sion levels in
B. subtilis (see fig. S2). Figure 1D shows the mean fluorescence of all
the strains, ordered along the x axis according to the strength of their transcription module and along the y axis according to the strength of their translation module. As expected, the mean expression strongly depends on both the transcription and translation modules. Figure 1D also shows that, except for three strains that exhibit un-expected behaviors (S04, S07, and S27; crossed-out pixels in Fig. 1D), the transcription modules can be ranked according to their strength independently of the translation module and reciprocally, suggesting that transcription and translation modules generally have indepen-dent effects on mean expression. For S04, S07, and S27, the mean fluorescence is not coherent with the rankings of the modules, sug-gesting a specific interaction, such as an effect of the eTSS on mRNA folding. In the simple two-stage model of gene expression, the mean expression of a gene is proportional to the product of the transcription rate and the translation rate. Therefore, according to this model, tran-scription and translation modules are expected to have independent effects on the log-transformed mean expression. This assumption can be tested using a partition of variance, such as that performed in a two-way ANOVA. Using two-way ANOVA, the variance can be partitioned between the independent effects of the two factors, as well as an interaction term and a residual unexplained variance. The underlying model implies additive effects of the two factors, so here, we performed the ANOVA on the log-transformed mean flu-orescence, using transcription and translation modules as factors. This analysis demonstrated that >90% of the total variance is ex-plained by the independent effects of the transcription and transla-tion modules (text S2). Our microscopy dataset contains only two replicate experiments per strain, which limits the precision of the ANOVA. Therefore, to further check the independence of the ef-fects of the transcription and translation modules, we also mea-sured the fluorescence of all the strains at the population level during exponential growth in 96-well microplates, performing five independent measurements for each strain. A two-way ANOVA confirmed the results obtained with our microscopy data (text S2). Therefore, the effects of transcription and translation modules on mean expression are mostly independent, except on some rare in-stances where substantial interaction can occur, such as for the strains S04, S07, and S27, which were not used in the following analyses. These results are in agreement with previous results ob-tained in E. coli with a similar approach by Mutalik et al. (38) and with a larger library by Kosuri et al. (39).
Expression noise strength depends on both the transcription and translation modules
We then analyzed how expression variability depends on the tran-scription and translation modules. Here, we used the Fano factor or
Fig. 1. Design and characterization of the 40-strain custom-made library. (A) Synthetic sequences are made of a combination of eight transcription modules (promoters and eTSS) exhibiting different transcription strengths (yellow intensity) and five translation modules (TIRs) exhibiting different translation efficiencies (blue intensity). Combined modules are cloned upstream of the GFPmut3 coding se-quence, resulting in a library of 40 synthetic sequences, which allow a wide range of GFPmut3 expression, that is representative of the natural range of protein expression in B. subtilis (fig. S2). (B and C) Mean protein abundance (B) and protein concentration noise strength (C) of all the strains of the library. To facilitate the interpretation, the protein concentration is expressed in number of proteins in 1 fl, which is the average cell volume. Therefore, the mean concentration corresponds to the mean number of proteins per cell (mean protein abundance). The noise strength is defined as the variance of the single-cell protein concentration divided by the mean. For each strain, at least two replicate experiments were performed. Each dot represents a single experiment. Experiments using the same strains are represented with vertically aligned dots of identical color. (D and E) The strains are ordered in a two-dimensional map according to their transcription (x axis) and translation (y axis) modules. Translation modules (1, fbaAhs; 2, fbaA; 3, fbaAshort; 4, gtlX; and 5, tufA) and transcription modules (1, ykwB; 2, yufK; 3, yqzM; 4, zwf; 5, ykpA; 6, fbaA; 7, rrnJP2; and 8, ylxM) are ordered according to their strength. The color of the pixels represents the log-transformed mean protein abundance (D) and log- transformed noise strength (E). White pixels correspond to the strains that could not be constructed or measured. Crossed-out pixels correspond to strains with an unexpected mean fluorescence, suggesting specific interactions between the transcription and translation modules.
on November 5, 2020
http://advances.sciencemag.org/
noise strength, i.e., the variance divided by the mean, as a measure of expression variability. In the work of Ozbudak et al. (9), the noise strength was found to vary substantially with the translation rate, whereas the effect of the transcription rate was much weaker, as predicted by the two-stage model. In contrast, Fig. 1E shows that in our library, the noise strength depends substantially on both the transcription and translation modules.
We analyzed the dependence of the noise strength on the translation module for each transcription module, as shown in Fig. 2 and fig. S3. For each transcription module, increases linearly with the mean expression when the translation module changes, which is in agreement with previous work in B. subtilis (9). The two-stage model predicts that increases linearly with the rate of translation and therefore increases linearly with ( a·b, with a being the transcription rate and b being the translation rate) with a slope that depends on the strength of the transcription modules, i.e., the slope should be smaller for modules eliciting a higher transcription rate. We performed linear regressions of versus when the translation module is changed for each transcription module. The estimated slopes are given in table S3. As predicted by the model, the slope decreases with the strength of the transcription module.
Likewise, we analyzed the dependence of on the transcription module for each translation module. In contrast to previous exper-imental work in B. subtilis (9) and model predictions, we found that for all the translation modules, increases linearly with when the transcription rate changes. This is shown in Fig. 3 and fig. S4. We performed linear regressions and found that the slope is quite simi-lar for all the translation modules (see table S4). The slopes are on the same order of magnitude than the slopes obtained when trans-lation is modulated and transcription is constant (see tables S3 and S4). Consequently, for many strains in the library, increasing the mean expression by changing transcription or translation modules leads to similar noise strength (Fig. 4A).
The differential effect of translation and transcription on noise is restricted to a regime of weak transcription that represents only a fraction of B. subtilis natural proteome
When the translation rate increases, increases with , with a slope that depends on the strength of the transcription module (table S3). In contrast, when the transcription rate increases, increases linearly with with a slope that is independent of the translation module, but the intercept depends on the strength of the translation module (table S4). These relations impose a mathematical relationship be-tween and the rate of transcription (a) and translation (b) of the form = C1 + C2·b + C3·ab (Eq. 1) (see text S4 for details), with C1, C2, and C3 constants. In previous works, relations between and the rate of translation (b) were derived from a modeling approach on the basis of assumptions on the underlying biological mechanisms (8, 12, 13). In contrast, here, Eq. 1 is derived directly from the data, with no modeling assumptions. Equation 1 can be rewritten to show the dependence of on : = C1 + C2·/a + C3·. This equation shows that when the mean abundance is varied through the transla-tion rate, the slope of versus (Stranslation) is the sum of a transcription- dependent term (C2/a) and a constant term (C3). This constant C3 is the slope of versus when the transcription rate varies (Stranscription). Therefore, if C2/a is small compared to C3, then modulating tran-scription or translation has a similar effect on noise (Stranslation ~
Stranscription). In contrast, if C2/a is large compared to C3, then
trans-lational bursting dominates and translation has a stronger impact than transcription on noise (Stranslation >> Stranscription). Thus, com-paring C2/a and C3 allows defining a regime of weak transcription where translational bursting dominates noise production.
Comparing the slopes of Figs. 2 and 3 (see tables S3 and S4), we see that only the three weakest transcription modules of our library (ykwB, yufK, and yqzM) belong to this translational bursting regime. For these modules, C2/a is approximately twice as large as C3, i.e.,
Stranslation ~ 3.Stranscription. We analyzed genome-wide transcriptomic
0 2000 4000 Mean abundance 0 10 20 30 htg ner ts esi o N 500 1000 Mean abundance 8 10 12 14 Noise strength 0 500 1000 1500 Mean abundance 0 5 10 Noise strength 50 100 150 Mean abundance 0 1 2 3 htg ner ts esi o N 1000 2000 3000 Mean abundance 10 15 20 Noise strength 50 150 250 Mean abundance 0 5 10 Noise strength 100 200 Mean abundance 0 2 4 htg ner ts esi o N 0 200 400 600 Mean abundance 0 2 4 6 8 Noise strength
Fig. 2. Noise strength of the protein concentration as a function of mean pro-tein abundance when the translation module varies. Each subplot corresponds to a group of strains with the same transcription module: (A) fbaA, strains S1 to S3 and S5; (B) rrnJP2, strains S7 to S9; (C) ykpA, strains S11 to S15; (D) ykwB, strains S16 to S20; (E) ylxM, strains S21 to S24; (F) yqzM, strains S26 and S30; (G) yufK, strains S31 to S35; and (H) zwf, strains S36 to S40. In each subplot, the different colors correspond to different translation modules (blue, fbaAhs; cyan, fbaA; green, fbaAshort; magenta, gtlX; and red, tufA). Black lines are linear regressions (parameters are given in table S3). To facilitate the interpretation, the protein concentration is expressed in number of proteins in 1 fl, which is the average cell volume. Therefore, the mean concentration corresponds to the mean number of proteins per cell (mean abundance).
0 500 1000 Mean abundance 0 5 10 Noise strength 0 200 400 600 800 Mean abundance 0 2 4 6 Noise strength 0 1000 2000 Mean abundance 0 5 10 15 Noise strength 0 1000 2000 3000 Mean abundance 0 10 20 Noise strength 0 2000 4000 Mean abundance 10 20 30 Noise strength
Fig. 3. Noise strength of the protein concentration as a function of mean pro-tein abundance when the transcription module varies. Each subplot corresponds to a group of strains with the same translation module: (A) fbaA, (B) fbaAhs, (C) fbaAshort, (D) gtlX, and (E) tufA. In each subplot, the different colors correspond to different transcription modules (blue, yufK; cyan, yqzM; green, ykpA; yellow, zwf; magenta, ykwB; orange, fbaA; red, rrnJP2; and brown, ylxM). Black lines are linear regressions (parameters are given in table S4). To facilitate the interpretation, the protein concentration is expressed in number of proteins in 1 fl, which is the average cell volume. Therefore, the mean concentration corresponds to the mean number of proteins per cell (mean abundance).
on November 5, 2020
http://advances.sciencemag.org/
data from the work of Nicolas et al. (35) and found that only ca. 30% of B. subtilis proteome corresponds to a transcription rate weaker than the one of yqzM (text S5 and fig. S6) and should therefore be-long to the translational bursting regime. On the basis of Eq. 1 and the genome-wide transcriptomic data, we can also compute a theo-retical value for Stranslation for the whole proteome (text S5 and fig. S7). Although this approach is unlikely to give precise predictions at the single-gene level, it allows estimating the fraction of the proteome that is in the translational bursting regime. For instance, we estimated that Stranslation is 10-fold (respectively 2-fold) higher than Stranscription for only 1% (respectively 35%) of B. subtilis native promoters.
Controlling for the effect of the eTSS
In the work of Ozbudak et al. (9), the transcription rate was modu-lated by using an inducible promoter. In contrast, we used different transcription modules, all leading to constitutive gene expression. As explained in the first section, we decided to consider the first eight transcribed nucleotides, namely, the eTSS, as part of our transcrip-tion modules because of its substantial effect on the transcriptranscrip-tion rate. However, these nucleotides are part of the mRNA sequence and therefore may also have an impact on its folding, degradation, and/ or translation (40). Therefore, our unexpected results could stem from the design of the library, the different transcription modules potentially having an artifactual impact on translation through their different eTSS (40). To rule out any bias due to the effect of the eTSS on mRNA translation and degradation, we constructed seven new strains where only the promoter varies, while the eTSS and TIRs are identical (strains A1 to A7; see table S1). Figure 4B shows that in these strains, the noise strength also increases with the mean ex-pression level. Therefore, the effect of the transcription modules on noise strength in the whole library is not due to a bias caused by eTSS modifications. We also constructed six strains that have
iden-tical TIRs and promoters but different eTSS regions (strains B1 to B7; see table S1). We found that changing the eTSS, the promoter, or both gives rise to a similar effect on noise strength. This is illus-trated in Fig. 4C.
The dependence of noise strength on transcription modules is due to extrinsic noise
Equation 1 ( = C1 + C2·b + C3·ab), which is derived directly from the linear relations observed in Figs. 2 and 3 and describes the de-pendence of the noise strength on the transcription and translation rates, is reminiscent of the formula established by Taniguchi et al. (30) to take into account extrinsic noise. In the work of Taniguchi et al. (30), the two-stage model is generalized by introducing temporal fluctuations of the translation and transcription rates. The formula obtained for the noise strength is of the form of Eq. 1, with a and b being the average rates of transcription and translation and C1, C2, and C3 depending on the level of extrinsic noise. This suggests that our unexpected results could be due to a strong extrinsic noise com-ponent. In E. coli, the noise was shown to scale with protein abun-dance for very low expression levels and to reach a plateau when the mean abundance increases above ~10 proteins per cell (30). This pla-teau was suggested to be the consequence of extrinsic noise (30). Our data also show a plateau for the noise, which is reached when the mean abundance increases above ~100 proteins per average cell volume (Fig. 5A). This global analysis is therefore also in agreement with a strong extrinsic noise.
To further assess the role of extrinsic noise, we used the dual- reporter method developed by Elowitz et al. (4). For the eight strains that have identical eTSS and translation module but variable promoters (strains S03 and A1 to A7; see table S1), we introduced the gene of the mKate2 red fluorescent protein into the genome, with the same control elements as for the GFPmut3 (table S2). The mKate2 gene was introduced directly downstream of the GFPmut3 gene, thus limiting difference in gene copy number during the cell cycle. Quantification of both red and green fluorescence in single cells showed that the expression of mKate2 and GFPmut3 are strongly correlated in all strains (Spearman’s rank correlation between 0.6 and 0.9;
P < 10−10; see fig. S5). The noise and noise strength can be de-composed into their extrinsic and intrinsic components, as explicated by Elowitz et al. (4). The decomposition of noise shown in Fig. 5B shows that it is dominated by the extrinsic component, which ac-counts for ca. 60% of the noise at the lowest expression levels and up to ca. 90% at the highest expression levels. Figure 5C shows that the increase of noise strength when transcription increases can be fully explained by the strong extrinsic component, which increases with transcription rate.
Essential and nonessential genes of B. subtilis exhibit similar
relative levels of transcription and translation, except for very weakly transcribed genes
Genome-wide analysis of transcription and translation levels in the yeast S. cerevisiae revealed that essential genes are more transcribed and less translated than nonessential genes with the same protein expression level (17). This was interpreted as the signature of a selection pressure toward noise reduction, which is likely to be stronger for essential genes. This conclusion relies on the assumption that tun-ing the relative levels of transcription and translation allows tuntun-ing the expression noise. In this work, we show that this strategy is less effective than previously thought in bacteria and only concerns very
0 1000 2000 3000 Mean abundance 0 10 20 30 40 Noise strength 0 1000 2000 3000 Mean abundance 0 10 20 30 Noise strength 0 1000 2000 3000 Mean abundance 0 10 20 30 Noise strength
Fig. 4. Noise strength of the protein concentration as a function of mean pro-tein abundance when different control elements vary. To facilitate the interpre-tation, the protein concentration is expressed in number of proteins in 1 fl, which is the average cell volume. Therefore, the mean concentration corresponds to the mean number of proteins per cell (mean abundance). (A) The mean protein abundance is modulated by changing the transcription (red) or the translation (green) module. The green dots correspond to the strains with the ylxM transcription module (and different translation modules, strains S21 to S24), and the red diamonds corresponds to the strains with the fbaAshort translation module (and different transcription modules, strains S03, S08, S13, S18, S23, S33, S38, A1 to A7, and B1 to B7). The super-imposed green dot and red diamond correspond to the S23 strain (transcription module, ylxM and translation module, fbaAshort). Straight lines are linear regressions. (B) The mean protein abundance is modulated by changing only the promoter. The red squares correspond to different strains with the same eTSS and translation module (strains S03 and A1 to A7), and the black straight line is a linear regression. (C) The mean protein abundance is modulated by changing either the promoter [red squares, strains S03 and A1 to A7 as in (B)], the eTSS (blue circles, strains S8 and B1 to B7), or both (green diamonds, strains S13, S18, S23, S33, and S38).
on November 5, 2020
http://advances.sciencemag.org/
low expression levels for which intrinsic noise is stronger. Therefore, we investigated whether the different expression strategies observed for essential and nonessential genes in yeast also exist in B. subtilis. To that end, we performed a genome-wide analysis that allows com-paring the levels of transcription and translation of essential and nonessential genes.
We used the transcriptomic and proteomic data presented by Borkowski et al. (36) and Goelzer et al. (41) and the list of essential genes from SubtiWiki (42). Protein abundance is, on average, higher for essential than nonessential genes. Therefore, to control for this effect, we grouped the genes according to their protein abundances. Then, for each group of similarly expressed genes, we divided the genes into three subgroups of identical size, according to their tran-scription rate: the third of the genes that have the highest trantran-scription rate, the third that has the lowest transcription rate, and the remain-ing third. We then computed the number of essential genes in the two extreme subgroups (lowest and highest transcription rates), as performed by Fraser et al. (17). These subgroups a priori contain essential and nonessential genes, and if essential and nonessential genes have similar expression strategies, then the number of essen-tial genes in the different subgroups should be similar. In S. cerevisiae, the number of essential genes was shown to be 2- to 10-fold higher in the high-transcription subgroups for all the protein expression levels (17). In contrast, Fig. 6 shows that in B. subtilis, the number of essential genes in the highly transcribed (red) and weakly transcribed (blue) subgroups are not markedly different. Thus, B. subtilis does not use markedly different expression strategies for essential and nonessential genes. However, note that there is a significant enrich-ment of essential genes in the high-transcription subgroups for genes with low expression levels (typically <300 proteins per cell). Note that the genome-wide data used here contain genes that are tran-scriptionally regulated, and low expression levels may correspond to transcriptional repression. However, removing genes that are likely to be transcriptionally regulated does not change the results shown in Fig. 6A (as Fig. 6A, where all genes are included, is similar to fig. S8, where regulated genes are excluded), suggesting that the different expression strategies of essential and nonessential genes at low expression levels are not due to different transcriptional regulation.
In contrast, it may reflect a selection pressure for noise reduction of poorly expressed essential genes.
As we presented above, translational bursting dominates noise pro-duction only in a regime of weak transcription, which represents only a small fraction of the natural proteome. For instance, we showed that only ca. 30% of natural promoters should lead to Stranslation > 3 × Stranscription. Restricting the analysis shown in Fig. 6A to this group of weakly transcribed genes gives identical results, as shown in Fig. 6B. In contrast, if we use the 70% most transcribed genes, then the effect at low expression levels disappears and no difference can be detected between essential and nonessential genes (Fig. 6C). DISCUSSION
It is generally assumed that translational bursting is the dominant source of noise in prokaryotic gene expression and that translation
10 100 1000 Mean abundance 10−2 V C( esi o N 2 ) 0 1000 2000 Mean abundance 0 0.02 0.04 0.06 Noise (CV 2) 0 1000 2000 Mean abundance 0 10 20 Noise strength
Fig. 5. Impact of extrinsic noise. (A) The noise (squared coefficient of variation: CV2, y) of the protein concentration as a function of the mean protein abundance (x) for all the strains. Each blue circle corresponds to a single experiment with a single strain. The red line corresponds to a fit y = C/x for all the experiments for which x < 50 (left part of the graph). (B) The total noise (blue), extrinsic noise (green), and intrinsic noise (red; y) as a function of the mean (x), for the two-colored strains (same eTSS and trans-lation module and different promoters). The red line is a fit y = k1/x + k2, as in (4). (C) The total (blue dots), extrinsic (green dots), and intrinsic (red dots) noise strength as a function of the mean, for the two-colored strains. Straight lines are linear regres-sions. To facilitate the interpretation, the protein concentration is expressed in number of proteins in 1 fl, which is the average cell volume. Therefore, the mean concentration corresponds to the mean number of proteins per cell (mean abundance).
Fig. 6. Expression strategies for essential and nonessential genes. (A to C) Genes are grouped according to the protein abundance, and each group is divided into three subgroups of identical size according to the transcription rate. The sub-groups are formed with the third of the genes that have the highest transcription rate, the third that has the lowest transcription rate, and the remaining third. Then, the number of essential genes in each subgroup is computed. Red circles, number of essential genes in the high-transcription subgroup; blue circles, number of essential genes in the low-transcription subgroup. The filled circles indicate significant differ-ences based on Fisher’s exact test (P < 0.05). (A) The analysis is performed on all genes in the genome. (B) The analysis is performed on a subset of genes that are weakly transcribed (less transcribed than yqzM). (C) The analysis is performed on the rest of the genes (i.e., those more transcribed than yqzM). In (A) to (C), the procedure to group the genes of identical protein abundance is not a simple binning and creates groups of genes whose levels of expression are not significantly based on an ANOVA (see Materials and Methods for details). The different groups therefore do not con-tain the same number of genes, and the number of groups is different in (A) to (C).
on November 5, 2020
http://advances.sciencemag.org/
therefore has a stronger impact on noise than transcription. In this work, we show that translational bursting dominates noise produc-tion only in a regime of weak transcripproduc-tion, which corresponds to a small fraction of the natural transcription range of bacteria. In contrast, for most of the natural expression range, translation and transcrip-tion modulatranscrip-tions have similar effects on noise. We show here that this phenomenon can be explained by the prevalence of extrinsic noise.
As previously demonstrated, very weak promoters associated with strong translation control elements can promote noisy expres-sion (43). Such an expresexpres-sion strategy could therefore be selected for by evolution or implemented in synthetic biology approaches to increase population diversity and/or implement bet-hedging strate-gies. However, our results show that for most of B. subtilis natural transcription range, noise cannot be tuned independently of mean abundance by varying the ratio of transcription and translation rates. This strategy is therefore less general than previously thought (6, 8, 9), which has important implications both for synthetic biology and engineering and for genome evolution. In bioengineering, the control of gene expression noise is an essential component of sys-tem design. Until now, strong promoters and weak RBS (ribosome binding site) sequences were favored when assembling robust, i.e., low-noise gene circuits (27). Our results indicate that the future of bioengineering will require the elaboration of a novel framework for engineering noise in various living systems.
Our analysis of genome-wide transcriptomic and proteomic data in B. subtilis shows that at low expression levels, essential genes are transcribed more and translated less than nonessential genes of identical protein abundance. As previously proposed for yeasts, this difference may reflect a selection pressure for noise reduction, which is assumed to be stronger for essential genes. Notably, the difference in expression strategies between essential and nonessential genes is restricted to a fraction of the genome, which corresponds to weakly transcribed genes. Therefore, our experimental results and our genome-wide analysis offer a coherent picture. In the weak tran-scription regime, noise can be tuned independently of mean abun-dance by varying the ratio of transcription and translation, leading to a selection force acting on genome evolution. However, this force is negligible in the evolution of most of the genome.
Translational bursting is expected to have a different impact on noise for different functional categories of genes. In particular, tran-scription factors are known to be present at low copy number in the cell compared to enzymes or structural proteins (44). In addition, among transcription factors, those that act specifically on a few genes, such as E. coli Lac repressor, are usually present at lower concentra-tions than global regulators that act on many genes. Low copy number transcription factors are therefore expected to be in the weak tran-scription regime, where noise can be tuned independently of mean expression. This noise tuning can lead to strong phenotypic effects and provide a basis for specific bet-hedging strategies (22, 43). In contrast, for enzymes that are present in high copy number, expres-sion noise cannot be tuned by varying the ratio of transcription and translation. The cell therefore often implements alternative strate-gies to minimize the fluctuations in biochemical pathways, such as the negative regulation of a biosynthesis pathway by its end product.
The existence of two regimes of noise production, dominated either by translational bursting or extrinsic noise depending on the strength of transcription, is likely to hold for other organisms. Different or-ganisms may be in different regimes depending on their natural tran-scription range and the source and intensity of the extrinsic noise. In
yeasts, markedly different expression strategies between essential and nonessential genes suggest that noise can generally be tuned by varying the ratio of transcription and translation, thus suggesting that at the whole-genome scale, noise production is mainly in the regime where translational bursting prevails. This pattern may be related to the level of extrinsic noise, which was reported to be lower in yeasts than in bacteria (28, 29). Note that in the case of transcriptional bursting, i.e., when promoters can stochastically switch between inactive and ac-tive states, different regimes of noise production can also be defined, by comparing the transcription rate to the activation and inactivation rates of the promoter (11). Therefore, both extrinsic noise and tran-scriptional bursting can prevail over translational bursting, restricting the regime in which noise can be tuned independently of the mean abundance by varying the ratio of transcription and translation. MATERIALS AND METHODS
Strain construction
E. coli Mach1T1 and TG1 were used for plasmid construction and
amplification, respectively, using standard techniques (45). B. subtilis strains were obtained by integration of the plasmid by single crossing- over in a tryptophan prototrophic 168 strain (BSB168) (46), using standard procedures.
When required, DNA fragments were purified using the QIAquick PCR Purification Kit or QIAquick Gel Extraction Kit (QIAGEN, Hilden, Germany). Plasmids were purified from E. coli cultures using the QIAprep Spin Miniprep Kit (QIAGEN).
The vectors used to generate the strain collection were made as follows: The vector pBaSysBioII (46) was linearized by Eco RV and recircularized by ligation of a 714-bp PCR (polymerase chain reaction) product to obtain the plasmid PL1. The PCR fragment was obtained by amplification of B. subtilis chromosomal DNA between the co-ordinates 213.017 and 213.757 according to the version AL009126 of the complete genome of B. subtilis deposited in GenBank.
The synthetic sequences used to control expression of GFPmut3 in the strains S01 to S40 (table S1) have been chemically synthesized by GeneArt. Briefly, each of the synthetic sequence is made of the association of a given promoter, an eTSS, and a TIR. These DNA sequences are preceded by a 29-bp sequence identical to the 29 bp upstream of the promoter PfbaA in the original PL1 and followed by 29 bp identical to the first 29 bp of the GFPmut3 coding sequence.
Plasmids PL1S01 to PL1S40 had been built as follows: The plas-mid PL1 was PCR-amplified using primers P-PS-AM and P-PS-AV, resulting in a linear DNA sequence of 5243 bp made of the whole PL1 plasmid devoid of any promoter and RBS upstream of the GFPmut3 coding sequence (CDS). Synthetic sequences were PCR- amplified using the universal primers PS-F and PS-R, purified, and cloned in the plasmid by Gibson assembly using a NEBuilder HiFi DNA Assembly kit according to the manufacturer’s instructions (New England Biolabs, Ipswich, MA, USA). Each Gibson assembly mix has been used to transform chemically competent Mach1T1 E. coli cells. Once sequenced (GATC Biotech, Cologne, Germany), rebinant plasmids were transformed and multiplied in chemically com-petent TG1 cells before transformation in BSB168.
Preparing cell cultures for single-cell fluorescence measurements
The following protocol is used to ensure a steady state of balanced growth. All incubation steps are performed at 37°C under agitation.
on November 5, 2020
http://advances.sciencemag.org/
Cultures are inoculated in LB supplemented with spectinomycin (100 g/ml) and incubated overnight. They are then diluted 100-fold in LB, incubated for 2 hours, and then diluted 50-fold in S Medium [0.2% (NH4)2SO4, 1.4% K2HPO4, 0.6% KH2PO4, 0.1% sodium citrate, 0.0096% MgSO4, 10−4% MnSO4, 0.5% glucose, and 0.00135% FeCl3] and incubated for 2 hours. The culture is then diluted 8-fold in S medium, incubated for 3 hours, diluted again 70,000-fold in S medium, and incubated until the optical density at 600 nm reaches 0.2. The culture is then analyzed by flow cytometry and/or fluorescence microscopy.
Flow cytometry
Single-cell fluorescence, FSC, and side scatter measurements were carried out on a Becton Dickinson FACSCalibur flow cytometer, equipped with a 488-nm excitation laser and a 530/30-nm emission filter, and controlled by the CellQuest software. For all the strains, measurements were performed with the same laser power and voltage settings. The exponentially growing cultures were diluted 40-fold, and measurements were performed on 104 to 105 cells.
Microscopy
Microcolony growth monitoring and single-cell fluorescence mea-surements were performed using an inverted DeltaVision Elite microscope equipped with the Ultimate Focus system for automatic focalization, a 100× oil immersion objective (numerical aperture 1.4), a temperature-controlled chamber (37°C), and the DV Elite sCMOS Camera. Bright-field illumination was provided by a white light- emitting diode (LED), and fluorescence illumination was provided by the DV Light Solid State Illuminator 7 Colors (475-nm LED for GFP and 575-nm LED for mKate2). Our microscope can perform two different illumination techniques: Köhler illumination and critical illumination. We used critical illumination to improve evenness of illumination.
A liquid solution of 1.5% high-resolution low-gelling tempera-ture agarose (Sigma-Aldrich) in S medium is prepared. To that end, agarose is first dissolved in water, heated, and allowed to cool down to 50°C. The components of the S medium are then added to the agarose solution. A Gene Frame (125 l, 1.7 cm by 2.8 cm; Thermo Fisher Scientific) is stuck on a clean glass slide (Knittel Glass; 76 mm by 26 mm); the resulting cavity is filled with S-agarose, covered with a microscope slide, and cooled for 1 hour at 4°C. Then, the micro-scope slide is removed, and stripes of S-agarose are removed using a surgical scalpel to leave three small stripes of agarose (~4 mm wide, with ~4 mm spacing), separated by air cavities ensuring oxygen-ation. Three different strains are then loaded on the three agarose stripes. To that end, the exponentially growing cultures are diluted 300-fold, and cca. 2 ml is deposited on each agarose stripe. Once the liquid is absorbed, the cavity is sealed with a clean coverslip (Knittel Glass Cover Slips; 24 mm by 60 mm), and the slide is placed in the temperature-controlled chamber set at 37°C for 1 hour before acquisition begins.
We first follow the growth of microcolonies from single cells us-ing phase contrast microscopy. Images are acquired usus-ing 50-ms exposure with 32% of the maximum intensity of the white LED. For each strain, we image ~30 microcolonies, every 5 or 10 min, for cca. 4 hours. After 4 hours of growth, the cells are in a steady state of growth, and the microcolonies are still in monolayers. We then im-age ca. 30 microcolonies, using both phase contrast and fluorescence. Depending on their fluorescence levels, the strains are imaged with different illumination intensities and/or exposure times.
Translating fluorescence into protein number
To convert the fluorescence levels into protein concentrations, we quantified the fluorescence of two B. subtilis strains that express GFPmut3 and for which the concentration of proteins was previously quantified by two-photon fluorescence fluctuation microscopy (47). More precisely, we used two strains where GFPmut3 is under the control of the gapB or the cggR promoter, and we measured the fluorescence during exponential growth in 96-well microplates in S medium with glucose or malate as carbon sources, leading to different induction levels of the gapB or cggR promoters [see (47)]. We simul-taneously measured the fluorescence of the S5, S9, and S13 strains in glucose-S medium, to allow determining the average concentra-tion of proteins for those strains. The single-cell fluorescence data are then normalized accordingly for the whole library.
Image analysis
The fluorescence images are first corrected for inhomogeneous illu-mination. To estimate the illumination profile [b(x,y): the illumination intensity at (x,y) coordinate], we averaged ~40 images of agarose pads supplemented with fluorescein. For an image I0(x,y), we per-form the following normalization to get the corrected image I1(x,y): I1(x,y) = I0(x,y) <b(x,y)>/b(x,y), where <b(x,y)> is the mean inten-sity averaged over every pixel. We also correct for the autofluorescence of the agarose gel by subtracting to the fluorescence image the average background intensity (pixels outside of the microcolony). We also normalize the fluorescence signal by the excitation energy to take into account the different illumination settings used for different strains. The corrected images are then analyzed using Schnitzcells software (48). Bacteria are segmented using the phase contrast im-ages, and their fluorescence intensity is measured, i.e., the total fluorescence of the cell normalized by the cell area.
Single-cell data analysis
All data analysis is performed using MATLAB. One-way and two-way ANOVAs are performed using MATLAB’s functions anova1 and anova2.
For both microscopy and flow cytometry data, autofluorescence was estimated from measurements of the wild-type BSB168 strain, which does not contain any fluorescent protein. The single-cell fluo-rescence of cells expressing GFP and/or mKate2 is the sum of the contribution from the fluorescent proteins and the autofluorescence. Therefore, to reflect only the number of fluorescent proteins, the mean fluorescence is corrected by subtracting the mean autofluorescence. The single-cell autofluorescence is assumed to be independent of the number of fluorescent proteins in cells expressing GFP and/or mKate2. Therefore, the variance of the fluorescence can be corrected by subtracting the variance of the autofluorescence.
Analysis of the microscopy data shows that the autofluorescence is Gaussian. In the flow cytometry data, the distribution of auto-fluorescence is truncated on the left of a threshold that corresponds to the sensitivity of the cytometer. We therefore reconstruct the whole distribution as follows: The sensitivity threshold is lower than the mode of the distribution (i.e., the maximum of the density). There-fore, the right half of the distribution can be estimated. The whole Gaussian distribution is then reconstructed by symmetry, and the average and variance can be estimated.
For single-cell fluorescence measurements with the flow cytometer, we eliminated all the strains for which the fluorescence distribution was truncated by the sensitivity threshold. To reduce the fluctuations
on November 5, 2020
http://advances.sciencemag.org/
originating from cell size variations in the cytometry data, we kept only the cells whose FSC signal was within ±3% of the mode of the FSC signal distribution.
Analysis of expression strategies for essential and nonessential genes
The transcriptomic and proteomic data are taken from the works of Borkowski et al. (36) and Goelzer et al. (41), respectively, and the list of essential genes is taken from SubtiWiki (42). For each gene, the dataset contains several independent proteomic measures (up to nine replicates) and several independent transcriptomic measures (up to four replicates). Genes were binned according to their pro-tein expression as follows: First, propro-tein expression was estimated for each gene as the average of the proteomic replicates, and the genes were ranked according to this averaged measure. Then, we use all the replicates to take into account the level of confidence of the proteomic measure for each gene and to group the genes whose levels of expression are not significantly different. Starting with the first gene, we add the next genes one by one, performing a one-way ANOVA at each step. If the P value of the ANOVA is larger than a fixed threshold (0.05), then the gene is added to the group. Otherwise, it is used to start a new group, where genes are added one by one similarly. In contrast to a simple binning, this procedure takes into account the level of confidence of the measurements and produces groups of genes whose levels of expression are not significantly different.
SUPPLEMENTARY MATERIALS
Supplementary material for this article is available at http://advances.sciencemag.org/cgi/ content/full/6/41/eabc3478/DC1
View/request a protocol for this paper from Bio-protocol. REFERENCES AND NOTES
1. M. Delbrück, The burst size distribution in the growth of bacterial viruses (Bacteriophages). J. Bacteriol. 50, 131–135 (1945).
2. S. Benzer, Induced synthesis of enzymes in bacteria analyzed at the cellular level.
Biochim. Biophys. Acta 11, 383–395 (1953).
3. A. Novick, M. Weiner, Enzyme induction as an all-or-none phenomenon. Proc. Natl. Acad.
Sci. U.S.A. 43, 553–566 (1957).
4. M. B. Elowitz, A. J. Levine, E. D. Siggia, P. S. Swain, Stochastic gene expression in a single cell. Science 297, 1183–1186 (2002).
5. M. Ackermann, A functional perspective on phenotypic heterogeneity in microorganisms.
Nat. Rev. Microbiol. 13, 497–508 (2015).
6. M. Kærn, T. C. Elston, W. J. Blake, J. J. Collins, Stochasticity in gene expression: From theories to phenotypes. Nat. Rev. Genet. 6, 451–464 (2005).
7. P. S. Swain, M. B. Elowitz, E. D. Siggia, Intrinsic and extrinsic contributions to stochasticity in gene expression. Proc. Natl. Acad. Sci. U.S.A. 99, 12795–12800 (2002).
8. M. Thattai, A. van Oudenaarden, Intrinsic noise in gene regulatory networks. Proc. Natl.
Acad. Sci. U.S.A. 98, 8614–8619 (2001).
9. E. M. Ozbudak, M. Thattai, I. Kurtser, A. D. Grossman, A. van Oudenaarden, Regulation of noise in the expression of a single gene. Nat. Genet. 31, 69–73 (2002).
10. W. J. Blake, M. KÆrn, C. R. Cantor, J. J. Collins, Noise in eukaryotic gene expression. Nature
422, 633–637 (2003).
11. J. M. Raser, E. K. O'Shea, Control of stochasticity in eukaryotic gene expression. Science
304, 1811–1814 (2004).
12. V. Shahrezaei, P. S. Swain, Analytical distributions for stochastic gene expression.
Proc. Natl. Acad. Sci. U.S.A. 105, 17256–17261 (2008).
13. J. Paulsson, Models of stochastic gene expression. Phys. Life Rev. 2, 157–175 (2005). 14. J. Paulsson, Summing up the noise in gene networks. Nature 427, 415–418 (2004). 15. Z. Wang, J. Zhang, Impact of gene expression noise on organismal fitness and the efficacy
of natural selection. Proc. Natl. Acad. Sci. U.S.A. 108, E67–E76 (2011).
16. O. K. Silander, N. Nikolic, A. Zaslaver, A. Bren, I. Kikoin, U. Alon, M. Ackermann, A genome-wide analysis of promoter-mediated phenotypic noise in Escherichia coli.
PLOS Genet. 8, e1002443 (2012).
17. H. B. Fraser, A. E. Hirsh, G. Giaever, J. Kumm, M. B. Eisen, Noise minimization in eukaryotic gene expression. PLOS Biol. 2, e137 (2004).
18. B. Lehner, Selection to minimise noise in living systems and its implications for the evolution of gene expression. Mol. Syst. Biol. 4, 170 (2008). 19. N. Q. Balaban, J. Merrin, R. Chait, L. Kowalik, S. Leibler, Bacterial persistence
as a phenotypic switch. Science 305, 1622–1625 (2004).
20. E. Kussell, S. Leibler, Phenotypic diversity, population growth, and information in fluctuating environments. Science 309, 2075–2078 (2005).
21. F. Schreiber, S. Littmann, G. Lavik, S. Escrig, A. Meibom, M. M. M. Kuypers, M. Ackermann, Phenotypic heterogeneity driven by nutrient limitation promotes growth in fluctuating environments. Nat. Microbiol. 1, 16055 (2016).
22. J. N. Carey, E. L. Mettert, M. Roggiani, K. S. Myers, P. J. Kiley, M. Goulian, Regulated stochasticity in a bacterial signaling network permits tolerance to a rapid environmental change. Cell 173, 196–207.e14 (2018).
23. M. Ackermann, B. Stecher, N. E. Freed, P. Songhet, W.-D. Hardt, M. Doebeli, Self-destructive cooperation mediated by phenotypic noise. Nature 454, 987–990 (2008). 24. A. Becskei, L. Serrano, Engineering stability in gene networks by autoregulation. Nature
405, 590–593 (2000).
25. A. Becskei, B. B. Kaufmann, A. van Oudenaarden, Contributions of low molecule number and chromosomal positioning to stochastic gene expression. Nat. Genet. 37, 937–944 (2005).
26. X. Chen, J. Zhang, The genomic landscape of position effects on protein expression level and noise in yeast. Cell Syst. 2, 347–354 (2016).
27. L. Bandiera, S. Furini, E. Giordano, Phenotypic variability in synthetic biology applications: Dealing with noise in microbial gene expression. Front. Microbiol. 7, 479 (2016). 28. A. Bar-Even, J. Paulsson, N. Maheshri, M. Carmi, E. O’Shea, Y. Pilpel, N. Barkai, Noise
in protein expression scales with natural protein abundance. Nat. Genet. 38, 636–643 (2006).
29. J. R. S. Newman, S. Ghaemmaghami, J. Ihmels, D. K. Breslow, M. Noble, J. L. DeRisi, J. S. Weissman, Single-cell proteomic analysis of S. cerevisiae reveals the architecture of biological noise. Nature 441, 840–846 (2006).
30. Y. Taniguchi, P. J. Choi, G.-W. Li, H. Chen, M. Babu, J. Hearn, A. Emili, X. S. Xie, Quantifying
E. coli proteome and transcriptome with single-molecule sensitivity in single cells. Science 329, 533–538 (2010).
31. I. Golding, J. Paulsson, S. M. Zawilski, E. C. Cox, Real-time kinetics of gene activity in individual bacteria. Cell 123, 1025–1036 (2005).
32. S. Chong, C. Chen, H. Ge, X. S. Xie, Mechanism of transcriptional bursting in bacteria. Cell
158, 314–326 (2014).
33. A.-G. Planson, V. Sauveplane, E. Dervyn, M. Jules, Bacterial growth physiology and RNA metabolism. Biochim. Biophys. Acta Gene Regul. Mech. 1863, 194502 (2020). 34. S. Guiziou, V. Sauveplane, H.-J. Chang, C. Clerté, N. Declerck, M. Jules, J. Bonnet, A part
toolbox to tune genetic expression in Bacillus subtilis. Nucleic Acids Res. 44, 7495–7508 (2016).
35. P. Nicolas, U. Mäder, E. Dervyn, T. Rochat, A. Leduc, N. Pigeonneau, E. Bidnenko, E. Marchadier, M. Hoebeke, S. Aymerich, D. Becher, P. Bisicchia, E. Botella, O. Delumeau, G. Doherty, E. L. Denham, M. J. Fogg, V. Fromion, A. Goelzer, A. Hansen, E. Härtig, C. R. Harwood, G. Homuth, H. Jarmer, M. Jules, E. Klipp, L. L. Chat, F. Lecointe, P. Lewis, W. Liebermeister, A. March, R. A. T. Mars, P. Nannapaneni, D. Noone, S. Pohl, B. Rinn, F. Rügheimer, P. K. Sappa, F. Samson, M. Schaffer, B. Schwikowski, L. Steil, J. Stülke, T. Wiegert, K. M. Devine, A. J. Wilkinson, J. M. van Dijl, M. Hecker, U. Völker, P. Bessières, P. Noirot, Condition-dependent transcriptome reveals high-level regulatory architecture in Bacillus subtilis. Science 335, 1103–1106 (2012).
36. O. Borkowski, A. Goelzer, M. Schaffer, M. Calabre, U. Mäder, S. Aymerich, M. Jules, V. Fromion, Translation elicits a growth rate-dependent, genome-wide, differential protein production in Bacillus subtilis. Mol. Syst. Biol. 12, 870 (2016).
37. M. Schaechter, A brief history of bacterial growth physiology. Front. Microbiol. 6, 289 (2015). 38. V. K. Mutalik, J. C. Guimaraes, G. Cambray, Q.-A. Mai, M. J. Christoffersen, L. Martin, A. Yu,
C. Lam, C. Rodriguez, G. Bennett, J. D. Keasling, D. Endy, A. P. Arkin, Quantitative estimation of activity and quality for collections of functional genetic elements.
Nat. Methods 10, 347–353 (2013).
39. S. Kosuri, D. B. Goodman, G. Cambray, V. K. Mutalik, Y. Gao, A. P. Arkin, D. Endy, G. M. Church, Composability of regulatory sequences controlling transcription and translation in Escherichia coli. Proc. Natl. Acad. Sci. U.S.A. 110, 14024–14029 (2013). 40. G. Cambray, J. C. Guimaraes, A. P. Arkin, Evaluation of 244,000 Synthetic sequences
reveals design principles to optimize translation in Escherichia coli. Nat. Biotechnol. 36, 1005–1015 (2018).
41. A. Goelzer, J. Muntel, V. Chubukov, M. Jules, E. Prestel, R. Nölker, M. Mariadassou, S. Aymerich, M. Hecker, P. Noirot, D. Becher, V. Fromion, Quantitative prediction of genome-wide resource allocation in bacteria. Metab. Eng. 32, 232–243 (2015). 42. B. Zhu, J. Stülke, SubtiWiki in 2018: From genes and proteins to functional network
annotation of the model organism Bacillus subtilis. Nucleic Acids Res. 46, D743–D748 (2018).
43. H. Maamar, A. Raj, D. Dubnau, Noise in gene expression determines cell fate in
Bacillus subtilis. Science 317, 526–529 (2007).
on November 5, 2020
http://advances.sciencemag.org/
44. G.-W. Li, D. Burkhardt, C. Gross, J. S. Weissman, Quantifying absolute protein synthesis rates reveals principles underlying allocation of cellular resources. Cell 157, 624–635 (2014).
45. J. Sambrook, E. F. Fritsch, T. Maniatis, Molecular Cloning: A Laboratory Manual: Vol. 2 (Cold Spring Harbor Laboratory, ed. 2, 1989).
46. E. Botella, M. Fogg, M. Jules, S. Piersma, G. Doherty, A. Hansen, E. L. Denham, L. Le Chat, P. Veiga, K. Bailey, P. J. Lewis, J. M. van Dijl, S. Aymerich, A. J. Wilkinson, K. M. Devine, PBaSysBioII: An integrative plasmid generating gfp transcriptional fusions for high-throughput analysis of gene expression in Bacillus subtilis. Microbiology 156, 1600–1608 (2010).
47. M. L. Ferguson, D. Le Coq, M. Jules, S. Aymerich, O. Radulescu, N. Declerck, C. A. Royer, Reconciling molecular regulatory mechanisms with noise patterns of bacterial metabolic promoters in induced and repressed states. Proc. Natl. Acad. Sci. U.S.A. 109, 155–160 (2012).
48. J. W. Young, J. C. W. Locke, A. Altinok, N. Rosenfeld, T. Bacarian, P. S. Swain, E. Mjolsness, M. B. Elowitz, Measuring single-cell gene expression dynamics in bacteria using fluorescence time-lapse microscopy. Nat. Protoc. 7, 80–88 (2011).
Acknowledgments: We thank M. Calabre (Micalis, Jouy-en-Josas, France) for technical
assistance in constructing the library. We thank A. Amir and J. Lin for useful comments on the
manuscript. Funding: This work was supported by the French National Research Agency (ANR-18-CE44-0003) and the European Commission (FP7-244093). A.D. acknowledges a 3-year Ph.D. grant from the “Interface Pour le Vivant”(IPV) doctoral program of Sorbonne Université.
Author contributions: L.R., M.J., J.R., and S.A. conceived the project and designed the
experimental plan. L.R. and J.R. designed the experimental setup. A.D. performed the experiments. V.S., M.J., and S.A. designed the strain library. V.S. constructed the library. A.D. and L.R. analyzed the data. L.R. wrote the manuscript with contributions from all authors.
Competing interests: The authors declare that they have no competing interests. Data and materials availability: All data needed to evaluate the conclusions in the paper are present in
the paper and/or the Supplementary Materials. Additional data related to this paper may be requested from the authors.
Submitted 20 April 2020 Accepted 25 August 2020 Published 7 October 2020 10.1126/sciadv.abc3478
Citation: A. Deloupy, V. Sauveplane, J. Robert, S. Aymerich, M. Jules, L. Robert, Extrinsic noise prevents the independent tuning of gene expression noise and protein mean abundance in bacteria. Sci. Adv. 6, eabc3478 (2020).
on November 5, 2020
http://advances.sciencemag.org/
DOI: 10.1126/sciadv.abc3478 (41), eabc3478.
6 Sci Adv
ARTICLE TOOLS http://advances.sciencemag.org/content/6/41/eabc3478
MATERIALS
SUPPLEMENTARY http://advances.sciencemag.org/content/suppl/2020/10/05/6.41.eabc3478.DC1
REFERENCES
http://advances.sciencemag.org/content/6/41/eabc3478#BIBL This article cites 47 articles, 17 of which you can access for free
PERMISSIONS http://www.sciencemag.org/help/reprints-and-permissions
Terms of Service Use of this article is subject to the
is a registered trademark of AAAS.
Science Advances
York Avenue NW, Washington, DC 20005. The title
(ISSN 2375-2548) is published by the American Association for the Advancement of Science, 1200 New
Science Advances
License 4.0 (CC BY-NC).
Science. No claim to original U.S. Government Works. Distributed under a Creative Commons Attribution NonCommercial Copyright © 2020 The Authors, some rights reserved; exclusive licensee American Association for the Advancement of
on November 5, 2020
http://advances.sciencemag.org/