HAL Id: hal-00295964
https://hal.archives-ouvertes.fr/hal-00295964
Submitted on 3 Jul 2006
HAL is a multi-disciplinary open access
archive for the deposit and dissemination of
sci-entific research documents, whether they are
pub-lished or not. The documents may come from
teaching and research institutions in France or
abroad, or from public or private research centers.
L’archive ouverte pluridisciplinaire HAL, est
destinée au dépôt et à la diffusion de documents
scientifiques de niveau recherche, publiés ou non,
émanant des établissements d’enseignement et de
recherche français ou étrangers, des laboratoires
publics ou privés.
Importance of mineral cations and organics in
gas-aerosol partitioning of reactive nitrogen compounds:
case study based on MINOS results
S. Metzger, N. Mihalopoulos, J. Lelieveld
To cite this version:
S. Metzger, N. Mihalopoulos, J. Lelieveld. Importance of mineral cations and organics in gas-aerosol
partitioning of reactive nitrogen compounds: case study based on MINOS results. Atmospheric
Chem-istry and Physics, European Geosciences Union, 2006, 6 (9), pp.2549-2567. �hal-00295964�
www.atmos-chem-phys.net/6/2549/2006/ © Author(s) 2006. This work is licensed under a Creative Commons License.
Chemistry
and Physics
Importance of mineral cations and organics in gas-aerosol
partitioning of reactive nitrogen compounds: case study based on
MINOS results
S. Metzger1, N. Mihalopoulos2, and J. Lelieveld1
1Max Planck Institute for Chemistry, Air Chemistry Department, Mainz, Germany
2University of Crete, Department of Chemistry, Heraklion, Greece
Received: 4 October 2005 – Published in Atmos. Chem. Phys. Discuss.: 19 December 2005 Revised: 24 April 2006 – Accepted: 24 May 2006 – Published: 3 July 2006
Abstract. The partitioning of reactive nitrogen compounds between the gas and the aerosol phase, as observed dur-ing the MINOS (Mediterranean INtensive Oxidant Study) campaign in Crete, Greece, in July and August 2001, has been studied with three thermodynamic gas-aerosol equi-librium models (EQMs) of different chemical complexity: ISORROPIA, which is limited to the ammonium-sulfate-nitrate-sodium-chloride-water-system; SCAPE2, which also includes mineral elements (calcium, magnesium and potas-sium); and EQSAM2, which additionally accounts for or-ganic acids. The different EQMs are constrained by mea-sured gas (g) and aerosol (a) concentrations: Total ammonia (NH3(g)and NH+4(a)), total nitrate (HNO3(g)and NO−3(a)),
to-tal sulfate (H2SO4(g) and SO2−4(a)), total chloride (HCl(g)and
Cl−(a)), sodium (Na+(a)), calcium (Ca2+(a)), magnesium (Mg2+(a)), potassium (K+(a)) and organic acids (a). Although the three EQMs differ considerably in particular aspects, their appli-cation at the same level of complexity yields comparable re-sults for the equilibrium composition and phase partitioning of ammonia and nitric acid, i.e. within the range of measure-ment uncertainties (∼10%). Their application at different levels of complexity, however, gives rise to substantial dif-ferences for the gas-aerosol partitioning of reactive nitrogen compounds. Our results show that only if (soluble) mineral components and (lumped) organic acids are accounted for, the observed gas-aerosol partitioning of ammonia and nitric acid can be accurately reproduced for air pollution episodes characterized by a complex chemical mixture, typical for the Mediterranean lower atmosphere.
Correspondence to: S. Metzger
(metzger@mpch-mainz.mpg.de)
1 Introduction
The MINOS (Mediterranean INtensive Oxidant Study) cam-paign (Lelieveld et al., 2002; Salisbury et al., 2003) took place in summer 2001 (28 July till 21 August) with the ob-jective to study the chemical and transport processes that cause the relatively high pollution concentrations often en-countered in the Eastern Mediterranean lower atmosphere (Fig. 1).
The measurements provided evidence of a remarkably high level of air pollution from the surface to the top of the troposphere up to 15 km altitude. Most pollution was ob-served in the lower 4 km, originating from both western and eastern Europe (Lelieveld et al., 2002; Traub et al., 2003). During MINOS the observations at Finokalia were strongly influenced by the transport of air pollution from SE-Europe. The sources include industrial activity, traffic, forest fires, agricultural and domestic burning. Since the Mediterranean region is nearly cloud-free in summer, the solar radiation lev-els are high so that noxious reaction products are formed in photochemical smog. The consequent air pollution includes ozone, various aerosol precursor gases and acidic or hygro-scopic aerosol particles with distinct chemical composition.
The most abundant aerosol precursor gases are ammonia (NH3), sulfuric acid (H2SO4)and nitric acid (HNO3). While
NH3is an end product of biogenic activity, being emitted by
farming and fertilization, H2SO4 and HNO3 are acids and
oxidation products from gas-phase photochemistry. H2SO4
derives from sulfur dioxide (SO2) and HNO3 from NOx
(NO2+NO), i.e. trace gases released from combustion
pro-cesses, e.g. in fossil energy production and traffic. Additional aerosol precursor gases include hydrochloric acid (HCl) and various condensable organic acids (R-COOH). While sulfu-ric and nitsulfu-ric acid in the Mediterranean region mainly origi-nate from anthropogenic activities, the origin of organic acids is manifold and less clear; a certain fraction originates from
2550 S. Metzger et al.: Importance of mineral cations and organic aerosols
926
G. Salisbury et al.: Ground-based PTR-MS measurements during MINOS
15
20
25
30
35
30
35
40
La
titu
de
/
N
oLongitude/ E
oFinokalia
Fig. 1. Location of Finokalia measurement station, site of the ground-based measurements during MINOS, July–August 2001.
rare at Finokalia under these conditions (Mihalopoulos et al.,
1997), so that local effects on the atmospheric chemistry are
minimal for long periods.
This paper presents measurements of acetonitrile,
ben-zene, toluene, acetone and methanol made using the
proton-transfer-reaction mass-spectrometry (PTR-MS) technique
at Finokalia during the Mediterranean INtensive Oxidants
Study (MINOS) in July–August 2001. The only reported
source of acetonitrile in the atmosphere is from biomass
burning (Lobert et al., 1990; Holzinger et al., 1999); the
MI-NOS PTR-MS acetonitrile data are therefore used to assess
the extent of biomass-burning influence on the air sampled
during the campaign. In contrast, benzene and toluene are
also emitted from fossil-fuel use; the toluene:benzene ratio
is used in the present work to assess the time elapsed since
the air sampled at Finokalia was last polluted.
Sources and sinks of acetone and methanol in the
atmo-sphere are subject to a high degree of uncertainty, since few
atmospheric measurements of these species have been made
to date, particularly in the boundary layer. The budget of
acetone is of major interest, since this compound is believed
to be an important source of HO
xradicals in the upper
tro-posphere, as well as a reservoir for NO
xthrough the
for-mation of peroxyacetyl nitrate (PAN) (Singh et al., 1995;
Wennberg et al., 1998). The role of methanol in the
atmo-sphere is unclear; a recent study suggests that a substantial
reservoir of this species may exist in the oceans (Galbally
and Kirstine, 2002). On a global scale, biogenic emissions of
both species are known to be substantial; for example,
Kirs-tine et al. (1998) found that acetone formed up to 23% and
methanol up to 15% of the total carbon emissions from grass
and clover in pastureland in Victoria, Australia. For acetone,
Jacob et al. (2002) estimated that, in percentage
contribu-tion terms, the global annual emissions from primary
anthro-pogenic sources (solvent use and motor vehicle emissions)
are of the order of 1%, from primary biogenic sources 35%,
from secondary production in the air from propane oxidation
22%, and from biomass burning 5%. The total global source
strength of acetone was estimated to be ca. 95 Tg yr
−1,
ap-preciably more than previously concluded by Singh et al.
(2000) (56 Tg yr
−1). Jacob et al. (2002) also proposed a
sig-nificant global oceanic source for acetone (27 Tg yr
−1). On
a regional scale, however, a stronger contribution to acetone
production from photochemical reactions of anthropogenic
emissions might be expected than these figures suggest.
Longitude
oE
Latitude
o
N
926
G. Salisbury et al.: Ground-based PTR-MS measurements during MINOS
15
20
25
30
35
30
35
40
La
titu
de
/
N
oLongitude/ E
oFinokalia
Fig. 1. Location of Finokalia measurement station, site of the ground-based measurements during MINOS, July–August 2001.
rare at Finokalia under these conditions (Mihalopoulos et al.,
1997), so that local effects on the atmospheric chemistry are
minimal for long periods.
This paper presents measurements of acetonitrile,
ben-zene, toluene, acetone and methanol made using the
proton-transfer-reaction mass-spectrometry (PTR-MS) technique
at Finokalia during the Mediterranean INtensive Oxidants
Study (MINOS) in July–August 2001. The only reported
source of acetonitrile in the atmosphere is from biomass
burning (Lobert et al., 1990; Holzinger et al., 1999); the
MI-NOS PTR-MS acetonitrile data are therefore used to assess
the extent of biomass-burning influence on the air sampled
during the campaign. In contrast, benzene and toluene are
also emitted from fossil-fuel use; the toluene:benzene ratio
is used in the present work to assess the time elapsed since
the air sampled at Finokalia was last polluted.
Sources and sinks of acetone and methanol in the
atmo-sphere are subject to a high degree of uncertainty, since few
atmospheric measurements of these species have been made
to date, particularly in the boundary layer. The budget of
acetone is of major interest, since this compound is believed
to be an important source of HO
xradicals in the upper
tro-posphere, as well as a reservoir for NO
xthrough the
for-mation of peroxyacetyl nitrate (PAN) (Singh et al., 1995;
Wennberg et al., 1998). The role of methanol in the
atmo-sphere is unclear; a recent study suggests that a substantial
reservoir of this species may exist in the oceans (Galbally
and Kirstine, 2002). On a global scale, biogenic emissions of
both species are known to be substantial; for example,
Kirs-tine et al. (1998) found that acetone formed up to 23% and
methanol up to 15% of the total carbon emissions from grass
and clover in pastureland in Victoria, Australia. For acetone,
Jacob et al. (2002) estimated that, in percentage
contribu-tion terms, the global annual emissions from primary
anthro-pogenic sources (solvent use and motor vehicle emissions)
are of the order of 1%, from primary biogenic sources 35%,
from secondary production in the air from propane oxidation
22%, and from biomass burning 5%. The total global source
strength of acetone was estimated to be ca. 95 Tg yr
−1,
ap-preciably more than previously concluded by Singh et al.
(2000) (56 Tg yr
−1). Jacob et al. (2002) also proposed a
sig-nificant global oceanic source for acetone (27 Tg yr
−1). On
a regional scale, however, a stronger contribution to acetone
production from photochemical reactions of anthropogenic
emissions might be expected than these figures suggest.
Longitude
oE
Latitude
oN
Period III
Subsidence
Period I
N/NW
Period II
N/NE
Measurement SiteFig. 1. Map of the eastern Mediterranean region, Crete and Finokalia station where the MINOS campaign was performed.
anthropogenic activity and, depending on the season, from natural sources such as forests and coastal ecosystems.
The corresponding ions are ammonium (NH+4), sulfate
(SO2−4 ), bisulfate (HSO−4), nitrate (NO−3), chloride (Cl−),
and organics (R-COO−). Except for NH+4 these are anions
associated with gas-aerosol partitioning and the formation and growth of secondary aerosols (i.e. formed within the at-mosphere), while the major cations are mainly of natural ori-gin (primary aerosols), present in the coarse mode particles and not undergoing gas-aerosol partitioning (but liquid-solid
partitioning). Most important are sodium (Na+)
originat-ing mainly from bubble burstoriginat-ing sea spray, calcium (Ca2+),
magnesium (Mg2+)and a minor fraction of potassium (K+)
which originate from mineral dust, e.g. Saharan dust. The major mineral cations present in the fine mode largely origi-nate from anthropogenic activity, including NH+4, the cation
of NH3, and “pyrogenic” potassium (K+) from biomass
burning.
The anions are neutralized by cations through various re-action pathways, being important for several reasons. Firstly, trace gases with a short lifetime of a day or less can parti-tion into aerosols, which subsequently have a much longer lifetime of about a week depending on size, composition
and meteorological conditions. For instance, NH3 reacts
with H2SO4 to form stable ammonium sulphate salts that
are mostly confined to the aerosol fine mode. Secondly, the salts are more-or-less hygroscopic, so that the aerosols inter-act with natural and anthropogenic gases by heterogeneous reactions on aqueous or dry aerosol surfaces.
The present study addresses the influence of mineral cations and organic acids on the gas-aerosol partitioning of reactive nitrogen compounds in the Mediterranean lower at-mosphere. We focus on nitrate and ammonium as they are the two dominant nitrogen-containing compounds in aerosol particles, mainly of anthropogenic origin.
While it has been demonstrated that nitrate is mainly present in the form of ammonium nitrate e.g. in northwestern
and central Europe (e.g. Schaap et al., 2002), previous size fractionated aerosol measurements conducted in the Mediter-ranean have indicated the near-absence of submicron
ni-trate (Bardouki et al., 2003). The high hydroxyl (OH)
levels occurring in the area during summer (up to about 2·107molecules/cm3), in conjunction with the relatively high
NOx (NO+NO2) concentrations and the lack of
precipita-tion, promote the build-up of HNO3from gas phase reactions
(Berresheim et al., 2003). Once HNO3is formed, it is most
likely captured by coarse mode (D≥1.2 µm) sea-salt and dust particles, leading to a depletion of aerosol nitrate in the fine mode (D<1.2 µm). On the other hand, when ammonia is present in excess ammonium nitrate can be formed during night; however, since this salt is thermodynamically not sta-ble, it can evaporate during the day whereby the aerosol
pre-cursor gases NH3and HNO3are likely to condense on
pre-existing and larger aerosol particles (e.g. Wexler and Sein-feld, 1990). As a consequence, some anthropogenic air pol-lutants may not (or only during night) be confined to the fine aerosol mode but rather interact with larger particles which might be of natural origin such as sea salt and mineral dust aerosol.
To study the gas-aerosol partitioning of these compounds by considering inorganic and organic acids together with the major mineral cations that originate from sea salt and mineral dust (i.e. Na+, Ca2+, Mg2+, K+), we employ the available and widely used thermodynamic gas-aerosol equilibrium models ISORROPIA (Nenes et al., 1998), SCAPE2 (Kim et al., 1995; Meng et al., 1995) together with EQSAM2, which derives from EQSAM (Metzger, 2000; Metzger et
al. 2002a,b). In contrast to ISORROPIA and SCAPE2,
EQSAM2 includes both lumped organic acids and mineral cations; ISORROPIA is limited to the ammonium-sulfate-nitrate-sodium-chloride-water-system, while SCAPE2 addi-tionally includes major mineral cations (Ca2+, Mg2+, K+).
Compared to EQSAM, EQSAM2 also includes an extended description of gas-liquid-solid partitioning by accounting for the various mineral salt compounds based on theoretically derived activity coefficients and single solute molalities. A brief summary of the main new features of EQSAM2 is given in the Appendix. A detailed description, including theoreti-cal aerosol thermodynamics considerations, is in preparation for a separate publication.
Note that all models are constrained by measured gas (g)
and aerosol (a) concentrations, i.e. total ammonia (NH3(g)
and NH+4(a)), total nitrate (HNO3(g) and NO−3(a)), total
sul-fate (H2SO4(g)and SO2−4(a)), total chloride (HCl(g)and Cl−(a)),
sodium (Na+(a)), calcium (Ca2+(a)), magnesium (Mg2+(a)), potas-sium (K+(a))and organic acids (a), from which the phase par-titioning between the gas/liquid, gas/solid and liquid/solid aerosol phase and the equilibrium composition is calculated by the models.
2 Measurements
2.1 HNO3and NH3
The technique used for the sampling of atmospheric HNO3
and NH3is based on the nebulization/reflux principle (Cofer
et al., 1985; Sciare and Mihalopoulos, 2000). The Cofer
sam-pler was running with an average flow rate of 16 L min−1
and the sampling step was 2–3 h. After sampling the aliquots
for HNO3 and NH3 analysis were kept refrigerated at 4◦C
in the dark and analyzed within a month period using Ion Chromatography (see details below). The detection limit
for a mean sampling volume of 3 m3 was found to be
20 pmol mol−1and the precision was estimated to be 15%.
2.2 Aerosol sampling and analysis
Bulk aerosol samples were collected on 0.5 µm PTFE fil-ters running in parallel with the Cofer sampler. In total, 226 aerosol samples were collected during the sampling period and subsequently analyzed for the main anions and cations by Ion Chromatography. To obtain an impression of the dis-tribution of aerosols over the fine and coarse mode, we also collected aerosol samples in parallel on Stack Filter Units (SFUs). The 50% cut-point diameter (D50) of the 8 µm pore size filter was estimated to be of the order of 1.2±0.1 µm E.A.D. More details can be found in Sciare et al. (2005).
For the analysis of anions (chloride: Cl−; bromide:
Br−; nitrate: NO−3; sulfate: SO2−4 ; oxalate: C2O2−4 ) a
Dionex AS4A-SC column with ASRS-I suppressor in auto-suppression mode of operation was used and isocratic elution at 2.0 ml min−1of Na
2CO3/NaHCO3eluent. Organic anions
were analyzed using a Dionex DX-500 Ion Chromatograph with an AS11 analytical column and NaOH (0.1–3.5 mM) as
eluent in the gradient mode. For the cations (sodium: Na+;
ammonium: NH+4; potassium: K+; magnesium: Mg2+and
calcium: Ca2+)a CS12-SC column was used with CSRS-I
suppressor. Separation was achieved under isocratic condi-tions with 20 mM MSA eluent and flow rate of 1.0 ml/min: The reproducibility of the measurements was better than 2% and the detection limit ranged from around 5 ppb for the main anions and cations to below 0.2 ppb for the major organic an-ions. More details on the analytical technique can be found in Kouvarakis and Mihalopoulos (2002).
To support our modeling study, major low molecular weight (LMW) organic anions, being weak acids, were lumped together according their protonation constant, as they might be deprotonated in the presence of water (Reaction R1) and neutralized in case of excess cations, for instance sodium (Reaction R2), potassium (Reaction R3) or ammonium (Re-action R4).
R−COOH + H2O ⇐⇒ R−COO−+H3O+ (R1)
R−COO−+Na+⇐⇒R−COONa (R2)
EQSAM2 Aerosol Thermodynamics
Gas/liquid/solid partitioning
Temperature & Relative
Temperature & Relative
Humidity
Humidity
Liquid Phase, Ions:
Liquid Phase, Ions:
NO3-, NH
4+, SO42-, Cl-, Na+, K+, Ca2+, Mg2+, lumped Low Molecular Weight (LMW) organic acids (e.g., HCOOH),
H2O, pH Rcs
Gas Phase:
Gas Phase: HNO3, NH3, H2SO4, HCl, condensable
organic acids (g)
Solid Phase, Salts:
Solid Phase, Salts:
e.g.
NH4NO3, NH4HSO4, (NH4)2SO4, organic acid salts Rcs
NH4NO3, NH4HSO4,
(NH4)2SO4,
organic acid salts
Aerosol Mode
Coarse NO3-, NH4+, SO42-, Cl-,
organic anions (e.g., COOH-), Na+, K+, Ca2+, Mg2+, H 2O, pH Ras Ras . e.g. Accumulation Solids
Solids LiquidsLiquids
Aerosol Mode
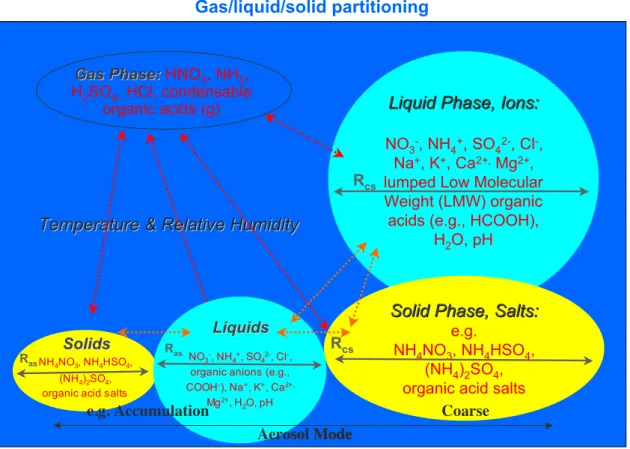
Fig. 2. Schematic description of the compounds and gas-aerosol partitioning processes included in EQSAM2.
R−COO−+NH+4 ⇐⇒R−COONH4 (R4)
Similar to the study by Trebs et al. (2005) equivalent moles were calculated as a first approximation assuming that mono-, di-mono-, and tricarboxylic acids form e.g. the respective mono-mono-, di-, and tri-ammonium salts. By this we simply assume that the acids donate all H+to be neutralized by bases such as am-monia (NH3), which forms the cation ammonium (NH+4). In
addition we assume that the organic acids might be neutral-ized by the other cations (Na+, Ca2+, Mg2+, K+). Although it is difficult to estimate the degree of acid dissociation (the pH of the sampled aerosol is not known), we assume that e.g. full acid dissociation of ammonium salts occurred, since
excess of NH3was available at the site. Organic acids are
therefore added to the ionic charge balance accounting for the total of carboxylic groups.
During MINOS the following classes of organic acids were measured: monocarboxylic (formate, acetate and pro-pionate), dicarboxylic (oxalate, succinate and glutarate) and
ketocarboxylic (pyruvate). The above measured organic
species account for the majority (more than 80%) of the organic acids existing in the aerosol phase (Kawamura et al., 1996; Kawamura and Sakaguchi, 1999; Krivacsy et al., 2001) and concurrent measurements during the campaign
(A. Roemp et al., personal communication) confirm this con-clusion. Note, however, that the total particulate organic mat-ter (POM) was not measured and that the identified organic acids might only account for a small fraction of POM (ap-proximately 10% according to Sect. 4.2.3).
3 Model description
The gas-aerosol partitioning of inorganic and organic aerosol compounds is modeled assuming thermodynamic and
chem-ical equilibrium. To study the gas-aerosol partitioning
we use the thermodynamic equilibrium models (EQMs) ISORROPIA (Nenes et al., 1998), SCAPE2 (Meng et al., 1995), which derives from SCAPE (Kim et al., 1995), and EQSAM2, an update of EQSAM (Metzger, 2000; Met-zger et al., 2002a; see Appendix). The gas-aerosol equi-librium models are driven by observations and partition the major aerosol precursor gases and aerosol compounds be-tween the gas-, liquid-, or solid aerosol phase based on the total of aerosol precursor gases and aerosol compounds. The gas-aerosol partitioning represented by EQSAM2 is schematically described in Fig. 2. The aerosol precursor gases are ammonia (NH3), sulfuric acid (H2SO4), nitric acid
(HNO3), hydrochloric acid (HCl), and condensable organic
acids (R-COOH), the latter being lumped together accord-ing to the total number of carboxylic groups. The corre-sponding ions are ammonium (NH+4), sulfate (SO2−4 ), bisul-fate (HSO−4), nitrate (NO−3), chloride (Cl−), and lumped
or-ganics (R-COO−), respectively. For each aerosol species
the aerosol precursor gases and anions are added (i.e. NH3+NH+4, H2SO4+SO42−+HSO−4, HNO3+NO−3, HCl+Cl−
, R-COOH+R-COO−)and the total is used as input in the
gas-aerosol models together with the total of the correspond-ing (major) cations, i.e. sodium (Na+), calcium (Ca2+),
mag-nesium (Mg2+)and potassium (K+).
The gas-aerosol equilibrium models (re-)partition the an-ions based on stochiometric neutralization reactan-ions with the cations, assuming chemical equilibrium, so that stronger acids drive the weaker acids out of the aerosol phase. For instance, chloride and nitrate anions are replaced by sulfate anions, since sulfuric acid is stronger than hydrochloric or nitric acid with respect to neutralization reactions. Chlorine release from the aerosol particles will follow the formation of nitrate. Organic acids are assumed to be weaker than the considered inorganic acids and are therefore driven out of the aerosol phase in case of insufficient cations. Similarly, am-monium is driven out of the aerosol phase (in the form of ammonia) in the presence of excess mineral cations. Since mineral cations originate mainly from primary production (e.g. wind blown dust or sea spray) they are therefore mainly present in the coarse rather than the fine aerosol particles. Thus cations strongly determine the particle size distribution, which in turn affects the gas-aerosol partitioning related to the ionic composition.
To take size distribution effects into account, we con-sider in this study simply a bi-modal aerosol size-spectrum with two major aerosol modes, i.e. the fine (D<1.2 µm) and
coarse (D≥1.2 µm) mode. For each mode, we calculate
the equilibrium composition from the total gas and aerosol concentrations. The gas-aerosol equilibrium partitioning is hereby based on size-segregated aerosol compounds that de-rive from the measured ion concentrations in the two modes. The EQMs used calculate the gas-aerosol equilibrium par-titioning based on the following assumptions. First of all, aerosol particles are assumed to be in thermodynamic and chemical equilibrium and internally mixed. While the latter assumption might be questionable under certain conditions, i.e. for coarse mode particles which originate from mineral dust (see discussion section), the equilibrium assumption is justified especially for fine particles. Smaller particles have shorter equilibrium time-scales than larger particles due to a larger surface to volume ratio. The equilibrium timescale is within the range of minutes to one hour for the condi-tions considered (Meng and Seinfeld, 1996), which is much shorter than the measurement intervals of about 2–3 h. How-ever, also the coarse particles can be regarded as internally mixed (and hence in equilibrium), if salt compounds are
pre-dominant. For instance, sea salt particles are very
hygro-scopic (mainly due to the presence of MgCl2), so that the
salt compounds deliquesce as soon as the relative humidity (RH) exceeds the relative humidity of deliquescence (RHD);
e.g. for MgCl2 the RHD is very low, i.e. 32% (at 298 K).
At RHD, the aerosol particle is then assumed to be a satu-rated solution of the inorganic salt compound(s) with the salts completely dissociated into the anion-cation pairs. By in-cluding the RHDs of various mineral salt compounds includ-ing MgCl2, we can account for the fact that the air over sea
is often foggy, even at a low RH, simply due to the presence
of MgCl2in sea salt aerosol particles. As a consequence, we
can clearly distinguish maritime from continental, polluted and unpolluted air.
To optionally apply the composition models within 3-D regional air pollution or global climate models, a simplifica-tion is made with respect to the set of chemical reacsimplifica-tions that needs to be solved. To reduce the computing time, the set of chemical reactions is minimized for a certain aerosol com-position by dividing the entire concentration range into cer-tain concentration domains (aerosol types) and sub-domains (RHD regimes), which match the actual aerosol composi-tion (e.g. sulfate neutral, sulfate rich or very rich cases, etc.). This framework is common to all EQMs used, see Metzger et al. (2002a), and the references therein for details.
Furthermore, it is common to all EQMs used to calculate temperature (T) and RH dependent gas-liquid-solid aerosol partitioning. This includes crystallization (or the deliques-cence and dissociation into ions) of salt compounds, if the
RH drops (or exceeds) the RHD of the salt compound or of
the mixture of salts (then called MRHD – mutual relative humidity of deliquescence). The EQMs finally compute the aerosol composition for a certain T, RH and the total of the gas and aerosol concentrations, based on the gas-liquid-solid, or gas-liquid, or gas-solid partitioning (either of one depend-ing on T, RH and the input concentrations), includdepend-ing the corresponding solid and/or ionic compositions, the aerosol associated water mass and other derived aerosol properties (e.g. pH, or ionic strength of the solution) which are difficult to measure.
4 Results
The MINOS measurements taken at Finokalia, Crete, in the southern Aegean Sea (Fig. 1) were analyzed with the gas-aerosol partitioning models for the MINOS core period, i.e. 1–18 August 2001. This core period can be subdivided into three different periods, i.e. two humid periods interrupted by a dry period:
– Period I (1 August–6 August 2001) was dominated by moderate winds from north-northwesterly direction, bringing humid air enriched with high levels of sea salt from central and western Europe over the Ionian Sea to Crete.
1. Period (1.8.-6.8.) N/NW Sea salt
1I. Period (6.8.-12.8.) Subsidence Dust + Biomass burning
1II. Period (12.8.-18.8.) N/NE Sea salt + Biomass burning
MINOS Campaign 20 22 24 26 28 30 32 01.08.2001 10:0002.08.2001 16:0003.08.2001 22:0005.08.2001 1:0006.08.2001 4:0007.08.2001 7:0008.08.2001 10:0009.08.2001 13:0011.08.2001 10:0012.08.2001 19:0013.08.2001 22:0015.08.2001 1:0016.08.2001 4:0017.08.2001 7:0018.08.2001 10:00 Date T [ o C] 0 10 20 30 40 50 60 70 80 90 100 RH [%] 2 x K + [nmol/m 3 ] . T RH K+
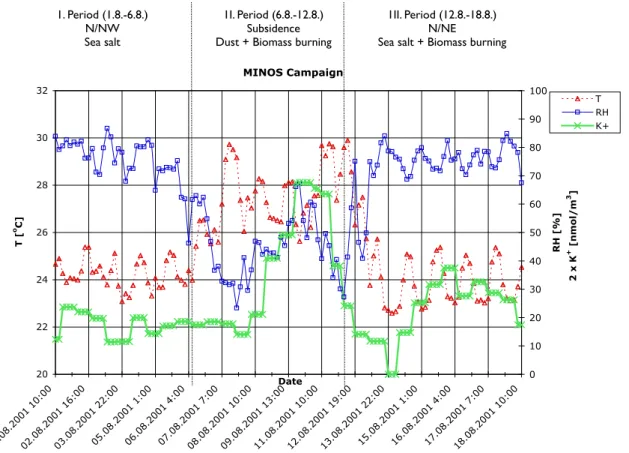
Fig. 3. Temperature (T), relative humidity (RH) and potassium (K+)time evolution during the MINOS campaign for three different air
pollution periods: Period I (1 August–6 August 2001) dominated by sea salt, period II (6 August–12 August 2001) dominated by mineral dust and biomass-burning air pollution, period III (12 August–18 August 2001) dominated by sea salt and biomass-burning air pollution. Note that potassium concentrations [nmol/m3], used as indicator for biomass burning, are scaled by a factor of two.
– Period II (6 August–12 August 2001) was dominated by subsidence, depositing pre-dominantly mineral dust from Saharan outbreaks, which was mixed or partly coated with biomass burning air pollution.
– Period III (12 August–18 August 2001) was dominated by moderate winds from north-northeasterly direction bringing again humid air with high levels of sea salt par-ticles though in this case from eastern Europe over the Aegean Sea to Crete. Similarly to period II, the air was mixed with pollution from biomass burning.
4.1 Observations
For the three different periods that characterize the MINOS campaign, time evolutions of the air temperature (T) and the relative humidity (RH) are shown in Fig. 3, together with fine mode (D<1.2 µm) non-sea-salt potassium (nss-K+); the latter is conceived to be an indicator for biomass burning air pollution.
The three different periods can also be characterized by the pollution levels of atmospheric aerosols and their ionic com-position. In particular, the concentration levels of cations are
characteristic. Time averages for the three different periods, including the time averages over all periods of the observed aerosol and aerosol precursor gas concentrations in units of
nanomole per cubic meter of air (nmol/m3) are shown for
the fine and coarse mode in Fig. 4 (note the different
scal-ing). The major mineral cations (Na+from sea salt aerosols,
Ca2+, Mg2+)are present in the coarse mode (more than 95%
of the total concentration) which indicates their natural ori-gin. The major mineral cation present in the fine mode is,
besides NH+4, pyrogenic potassium K+ (more than 70% of
the total concentration; Sciare et al., 2005).
The measurements further indicate that the major anthro-pogenic air pollutants are distributed over both the aerosol
fine and coarse mode. For instance nss-SO2−4 is mainly
present in the aerosol fine mode in contrast to aerosol ni-trate, which is confined to coarse mode particles. For a fur-ther discussion of the measurements, we refer to Salisbury et al. (2003), and Sciare et al. (2005). In the following we focus on the gas-aerosol partitioning modeling of reactive nitrogen compounds.
a) NH3 HNO3 HCl NH4+ NO3- SO4-- Cl-Na+ K+ Ca++ Mg++
R-COOH Period IIIAverage
Period II Period I 0 20 40 60 80 100 120 140
Observation: Fine Mode [nmol/m3]
Average 40.50 19.45 69.73 101.24 1.58 42.75 2.07 4.09 12.83 0.71 0.57 14.14 Period III 31.48 16.00 61.52 112.82 1.81 42.76 2.61 4.62 11.48 0.68 0.64 13.49 Period II 53.78 31.77 81.93 128.87 1.10 47.03 0.40 2.37 18.39 0.78 0.33 14.92 Period I 37.11 10.92 66.55 60.91 1.80 38.45 3.14 5.22 8.74 0.67 0.73 14.08 NH3 HNO3 HCl NH4+ NO3- SO4-- Cl- Na+ K+ Ca++ Mg++ R-COOH
b) NH3 HNO3 HCl NH4+ NO3- SO4-- Cl-Na+ K+ Ca++ Mg++
R-COOH Period IIIAverage
Period II Period I 0 10 20 30 40 50 60 70 80 90 100
Observation: Coarse Mode [nmol/m3]
Average 40.50 19.45 69.73 5.33 29.96 9.38 39.28 77.64 5.05 13.46 10.86 9.55 Period III 31.48 16.00 61.52 5.94 34.34 9.39 49.56 87.82 5.85 12.91 12.24 9.98 Period II 53.78 31.77 81.93 6.78 20.84 10.32 7.62 44.96 3.80 14.80 6.29 9.13 Period I 37.11 10.92 66.55 3.21 34.27 8.44 59.67 99.15 5.43 12.73 13.90 9.49 NH3 HNO3 HCl NH4+ NO3- SO4-- Cl- Na+ K+ Ca++ Mg++ R-COOH
Fig. 4. Time averages of observed aerosol precursor gas and aerosol concentrations [nmol/m3] for the three different periods as defined in
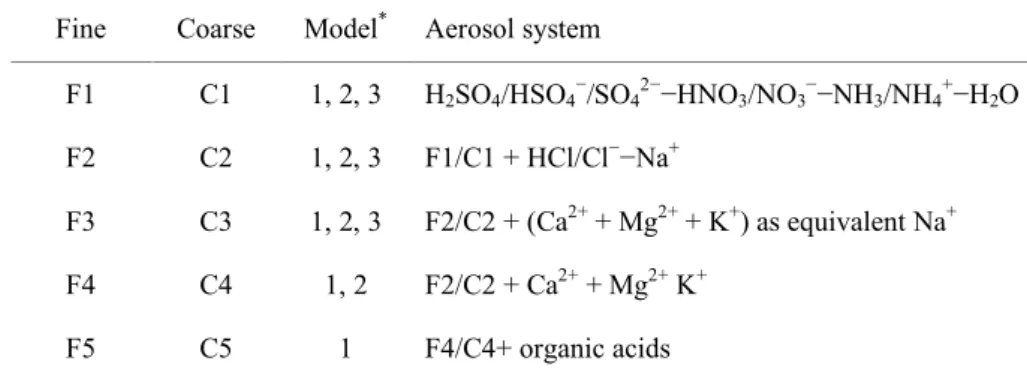
Table 1. Aerosol chemical systems considered in the different equilibrium models. Table 1. Aerosol systems.
Fine Coarse Model* Aerosol system
F1 C1 1, 2, 3 H2SO4/HSO4−/SO42−−HNO3/NO3−−NH3/NH4+−H2O F2 C2 1, 2, 3 F1/C1 + HCl/Cl−−Na+
F3 C3 1, 2, 3 F2/C2 + (Ca2+ + Mg2+ + K+) as equivalent Na+ F4 C4 1, 2 F2/C2 + Ca2+ + Mg2+ K+
F5 C5 1 F4/C4+ organic acids
* 1 = EQSAM2, 2 = SCAPE2, 3 = ISORROPIA
4.2 Modeling
To study the T and RH dependent equilibrium par-titioning of reactive nitrogen compounds of the observed H2SO4/HSO−4/SO2−4 −HNO3/NO−3−NH3/NH+4−HCl/Cl−−
Na+−Ca2+−Mg2+−K+−H
2O-system, including lumped
organic acids (R-COOH), we separate this complex aerosol system into five chemical systems for the fine (F1–F5) and the coarse (C1–C5) aerosol mode, according to Table 1. Chemical system F1/C1 excludes all mineral cations,
F2/C2 accounts for sodium, F3/C3 for Ca2+, Mg2+, K+
as equivalent sodium, F4/C4 accounts explicitly for all mineral cations (SCAPE2 and EQSAM2 only) and F5/C5 also accounts for additional anions from lumped organic acids (EQSAM2 only).
This distinction allows investigating the gas-aerosol par-titioning of nitrogen compounds and the sensitivity to the choice of the aerosol chemical subsystem. This is achieved by different constraints on the ionic composition, i.e. by subsequently including more and more cations and anions. This separation further allows comparing the results of differ-ently complex equilibrium models (ISORROPIA, SCAPE2,
EQSAM2) at different levels of complexity. While the
models are only comparable if applied at the same level of complexity, i.e. for the aerosol chemical systems F1/C1 and F2/C2, and with some restrictions also for F3/C3, the model comparison at different levels of complexity (F4/C4 and F5/C5) focuses on the relative importance of individual aerosol components for the gas-aerosol partitioning of nitro-gen compounds.
The most complex chemical system (F5/C5) is given by in-cluding all measurements. However, only EQSAM2 matches the chemical system F5/C5, while SCAPE2 is restricted to chemical system F4/C4 and ISORROPIA to F2/C2. Never-theless, mineral cations can be considered by all three mod-els, if mineral cations are added as “Na+-equivalent” to the sodium (e.g. 1 mole of Mg2+as 2 mole Na+). This so-called equivalent sodium approach (Moya et al., 2001) yields chem-ical system F3/C3 (Table 1), which should be considered
however as an approximation only, because of inconsisten-cies in the RHDs (see discussion section).
Note that all EQMs use as input for all cases the total of the measured gas and size-segregated aerosol phase concen-trations of the considered species. The selection of species included in the calculations depends on the defined cases and size fractions, e.g. F1 or C1, F2 or C2, etc. For each case (and size fraction) gas/liquid/solid phase partitioning and the composition of the size-segregated aerosols is calculated de-pending on observational data, which include temperature and relative humidity. The predicted size-segregated chemi-cal composition is then compared with observations. Ideally, the models should be able to predict the observations if all major aerosol species have been measured and used for the calculations. But even if a model fails, for instance, due to the limited chemical complexity (e.g. of organic acids), the results are of interest as the failure might point to a potential relevance of the missing aerosol species.
4.2.1 Gas-liquid-solid partitioning
To study the gas-aerosol partitioning of size-fractionated ni-trogen compounds, we first investigate in this section the rel-ative importance of the choice of the chemical system and of the modeling approach (application of different EQMs). Since ammonia is the relatively weakest base, its cation am-monium is driven out of the aerosol phase in the presence of sufficient mineral cations. Ammonium is hence an ideal indicator for a sensitivity study of the gas-aerosol partition-ing of size-fractionated nitrogen compounds. We therefore first address the ammonium partitioning, defined as the con-centration ratio of ammonium to the total of ammonia and
ammonium (Fig. 5). It is calculated from time averages
(over all periods) of observed and predicted ammonia and ammonium concentration for fine and coarse mode particles and for all chemical systems (Table 1). Note that the par-titioning is expressed in percent, which can result in large values pertaining to small concentrations, thus highlighting small differences, which underscores discrepancies between
0.00 10.00 20.00 30.00 40.00 50.00 60.00 70.00 80.00 NH4/(NH3+NH4) [%] F1 F2 F3 F4 F5 CF C1 C2 C3 C4 C5
Fine Mode | | Coarse Mode
Ammonium Partitioning Different Aerosol Compositions
EQSAM2 ISORROPIA SCAPE2 EQSAM2 58.70 56.26 56.86 54.89 72.48 12.41 39.83 1.44 0.71 0.01 14.15 ISORROPIA 58.96 57.18 57.74 57.18 57.67 40.25 7.15 7.45 7.15 7.40 SCAPE2 59.06 56.65 57.75 56.22 50.99 72.91 39.48 4.77 4.36 1.24 1.12 F1 F2 F3 F4 F5 CF C1 C2 C3 C4 C5
Fig. 5. Time averages (entire measurement time period) of observed and model calculated ammonium partitioning (ratio of aerosol
ammo-nium and ammoammo-nium plus ammonia) [%] for the fine (F) and coarse (C) aerosol mode and for all aerosol systems (F1–F5 and C1–C5) given in Table 1. For each system, all three model predictions are shown: from top to bottom EQSAM2 (red), ISORROPIA (blue) and SCAPE2 (green), whereas the observations (CF) are shown in the middle between the two aerosol modes starting from top to bottom with the coarse (C, red) and fine (F, green) modes.
models and observations. Note further that Fig. 5 also allows a comparison of the different model predictions of the three EQMs (ISORROPIA, SCAPE2, EQSAM2) with each other and with the observations for both the coarse and fine modes. The observations (marked as CF in Fig. 5) show that on av-erage 73% of the ammonium partitioned into the fine mode (F), while only about 13% partitioned into the coarse mode (C). The EQMs underestimate the fraction of fine mode am-monium for all chemical systems except F5 (EQSAM2) and C1 (all EQMs). This underestimation increases as more min-eral cations (Na+, Ca2+, Mg2+, K+)are considered (F1– F4 and C1–C4). The increasing underestimation of the am-monium partitioning is most pronounced for SCAPE2 and EQSAM2 (except F5/C5) as both explicitly include all min-eral cations; for ISORROPIA the values are approximately constant for F2–F5 and C2–C5, since mineral cations except
sodium (Na+)are not explicitly accounted for in the model
framework in contrast to SCAPE2 and EQSAM2 (see note at end of this section).
On the other hand, if all mineral cations (Na+, Ca2+,
Mg2+, K+)are omitted, i.e. chemical system C1, all EQMs
largely overestimate the amount of ammonium partitioned into the coarse mode. In this case, the large amount of
ammo-nium in the coarse fraction (C1) is only a result of the model-ing constraint. Because no coarse mode mineral cations were allowed to be present in this C1 case, ammonium was the only cation to neutralize the anions. This results in unrealisti-cally high concentrations of coarse ammonium calculated by all models as compared to observations. And since all three models agree for this artificial case within 1%, we do have a clear indication that mineral cations (which preferentially neutralize the anions) must have been present in reality, re-sulting in the observed ammonia gas and ammonium aerosol phase concentrations.
Interestingly, this is not the case for the same chemical sys-tem if it is applied to the fine mode (F1). Obviously, insuf-ficient anions of the ammonium-sulfate-nitrate-water-system are available for neutralization by ammonia to get a suffi-cient amount of ammonium into the fine aerosol phase (F1). Only if the additional anions from (lumped) organic acids are taken into account in the EQSAM2 model, ammonium realistically partitions into the aerosol phase. As a result, the predicted average ammonium partitioning is comparable to the observations within 1–2% for both the aerosol fine and coarse mode (F5/C5).
a) b) c) d) 1. Period (1.8.-6.8.) N/NW Sea salt 1I. Period (6.8.-12.8.) Subsidence Dust + Biomass burning
1II. Period (12.8.-18.8.) N/NE Sea salt + Biomass burning
1. Period (1.8.-6.8.) N/NW Sea salt
1I. Period (6.8.-12.8.) Subsidence Dust + Biomass burning
1II. Period (12.8.-18.8.) N/NE Sea salt + Biomass burning
1. Period (1.8.-6.8.) N/NW Sea salt
1I. Period (6.8.-12.8.) Subsidence Dust + Biomass burning
1II. Period (12.8.-18.8.) N/NE Sea salt + Biomass burning
1. Period (1.8.-6.8.) N/NW Sea salt
1I. Period (6.8.-12.8.) Subsidence Dust + Biomass burning
1II. Period (12.8.-18.8.) N/NE Sea salt + Biomass burning
Gas-liquid-solid Partitioning - Fine Mode (F1)
0 50 100 150 200 250 300 350 400 01.08.2001 10:0002.08.2001 16:0003.08.2001 22:0005.08.2001 1:0006.08.2001 4:0007.08.2001 7:0008.08.2001 10:0009.08.2001 13:0011.08.2001 10:0012.08.2001 19:0013.08.2001 22:0015.08.2001 1:0016.08.2001 4:0017.08.2001 7:0018.08.2001 10:00 Date NH 4 + [nmol/m 3] MINOS ISORROPIA R= 0.83 SCAPE2 R= 0.83 EQSAM2 R= 0.83
Gas-liquid-solid Partitioning - Fine Mode (F5)
0 50 100 150 200 250 300 350 400 01.08.2001 10:0002.08.2001 16:0003.08.2001 22:0005.08.2001 1:0006.08.2001 4:0007.08.2001 7:0008.08.2001 10:0009.08.2001 13:0011.08.2001 10:0012.08.2001 19:0013.08.2001 22:0015.08.2001 1:0016.08.2001 4:0017.08.2001 7:0018.08.2001 10:00 Date NH 4 + [nmol/m 3] MINOS ISORROPIA R= 0.85 SCAPE2 R= 0.75 EQSAM2 R= 0.89
Gas-liquid-solid Partitioning - Coarse Mode (C1)
0 5 10 15 20 25 30 35 40 45 50 01.08.2001 10:0002.08.2001 16:0003.08.2001 22:0005.08.2001 1:0006.08.2001 4:0007.08.2001 7:0008.08.2001 10:0009.08.2001 13:0011.08.2001 10:0012.08.2001 19:0013.08.2001 22:0015.08.2001 1:0016.08.2001 4:0017.08.2001 7:0018.08.2001 10:00 Date NH 4 + [nmol/m 3] MINOS ISORROPIA R= 0.77 SCAPE2 R= 0.78 EQSAM2 R= 0.78
Gas-liquid-solid Partitioning - Coarse Mode (C5)
0 5 10 15 20 25 30 35 40 01.08.2001 10:0002.08.2001 16:0003.08.2001 22:0005.08.2001 1:0006.08.2001 4:0007.08.2001 7:0008.08.2001 10:0009.08.2001 13:0011.08.2001 10:0012.08.2001 19:0013.08.2001 22:0015.08.2001 1:0016.08.2001 4:0017.08.2001 7:0018.08.2001 10:00 Date NH 4 + [nmol/m 3] MINOS ISORROPIA R= 0.19 SCAPE2 R= 0.14 EQSAM2 R= 0.47
Fig. 6. Time series of measured (black solid line) fine mode aerosol ammonium (panels a and b) [nmol/m3] and coarse (panels c and d)
mode ammonium [nmol/m3] for two different aerosol systems: The reduced chemical system (panels a and c) neglecting all cations except ammonium (F1/C1) and the most complete chemical system (F5/C5) (panels b and d) including mineral cations (Na+, K+, Ca2+, Mg2+). For each model the correlation coefficient (R) is given. The model results are obtained with ISORROPIA (purple, dashed line with closed squares), SCAPE2 (blue, long dashed line with closed diamonds), EQSAM2 (gold, short-long dashed line with closed circles).
It should be noted that all three EQMs give, within the measurement uncertainty of approximately 10%, compara-ble results for the ammonium partitioning if applied at the same level of complexity, i.e. for the chemical systems F1/C1 and F2/C2, and with the above-mentioned restrictions also for F3/C3. However, the model comparison at higher levels of complexity (F4/C4 and F5/C5) indicates that it is impor-tant for the gas-aerosol partitioning of nitrogen compounds to consistently include mineral cations and organic acids, since the model predictions are only comparable to the observa-tions if both, mineral caobserva-tions and organic acids are consid-ered (F5/C5).
Note further that for ISORROPIA the results are the same for the cases F4/C4 and F2/C2 as the model complexity is the same. However, F3/C3 differs due to the equivalent sodium approach, while the results differ for F5/C5 due to differ-ences in the concentrations of mineral cations as discussed below (missing insoluble fraction). For the same reason, the results of SCAPE2 differ (from F4/C4 to F5/C5) although the level of model complexity is the same.
4.2.2 Aerosol system F1/C1 compared to F5/C5
In this section we investigate the time evolution of the gas-aerosol partitioning of size-fractionated ammonium com-pounds over the three different periods (Period I–III). Sim-ilar to the previous section, we focus on the ammonium par-titioning. Figure 6 shows the time series of the observed
ammonium concentrations (in nmol/m3 air) for the aerosol
fine and coarse mode, together with the model predictions by ISORROPIA, SCAPE2 and EQSAM2 for the chemical sys-tems F1/C1 and F5/C5 (Table 1), which exclude and include mineral cations (Na+, Ca2+, Mg2+, K+)and organic acids, respectively.
Firstly, Figs. 6a and c confirms that all three EQMs are in an excellent agreement if applied at the same level of com-plexity (F1/C1). However, they fail to predict the observed fine and coarse mode concentrations of ammonium for all three periods. The only exception is the relatively realis-tic partitioning of fine mode ammonium for period I. Since all three EQMs also give similar results for system F5 and
period I, it indicates that mineral cations and organic acids are unimportant for the ammonium partitioning for period I (fine aerosol mode). Obviously, for this period the fine mode is well represented by chemical system F1 since sulfate is the predominant anion, being predominantly neutralized by ammonium as a result of the limited availability of mineral cations (Fig. 4a).
For periods II and III the situation considerably differs as both are affected by biomass burning, as indicated by en-hanced concentrations of potassium in the aerosol fine mode. As a result, ammonium is driven out of the aerosol phase by the additional potassium cations, which preferentially neu-tralize the inorganic anions. Only if additionally organic an-ions are considered in EQSAM2, the model reproduces mea-sured ammonium concentrations in the fine mode. This is only accomplished by the model predictions of EQSAM2 (chemical system F5, Fig. 6b). Since both minerals and or-ganic acids (together) are not accounted for in the other two EQMs, the results do not improve. Instead, the results be-come worse for SCAPE2 as this model only considers addi-tional cations (Ca2+, Mg2+, K+)but no organic acids, with the result that even more ammonium is driven out of the aerosol phase. In contrast, the results of ISORROPIA do not change, as these additional cations are not considered.
In strong contrast to the fine mode (Fig. 6a), all EQMs largely overestimate the ammonium concentrations for the coarse mode (Figs. 6c and d), if the calculations do not take into account mineral cations (chemical system C1, Fig. 6c). Mineral cations are predominant in the coarse mode for all
periods (Fig. 4b). A further consequence of this is that
SCAPE2 and ISORROPIA hardly predict any coarse mode ammonium for period II (Fig. 6d). The reason is that the sea salt concentrations are relatively low and the concentra-tions of caconcentra-tions from mineral (Saharan) dust high. While the predictions of SCAPE2 fail more-or-less for all periods as a result of the fact that mineral cations have been considered, the predictions of ISORROPIA particularly fail for the rel-atively dry period II as a consequence of the overall lower total anion (and in particular chloride) concentrations (see table below Fig. 4b). However, for the two humid periods with high sea salt concentrations (period I and III) the coarse mode simulations with ISORROPIA compare relatively well for the wrong reason, i.e. only because both mineral cations and lumped organic acids are neglected in the modeling ap-proach. As demonstrated with the EQSAM2 calculations, both seem to be important for the gas-aerosol partitioning of reactive nitrogen compounds for certain Mediterranean con-ditions (period II and III).
4.2.3 Sensitivity to organic acids and mineral cations
(F5/C5)
In this section we focus on the sensitivity of the gas-aerosol partitioning of reactive nitrogen compounds to the concentra-tions of organic acids and mineral caconcentra-tions. We first focus on
the ammonium concentrations, for which we discuss only the fine mode. Ammonium is predominantly present in the fine mode and in competition with pyrogenic potassium, which is the predominant mineral cation in the fine mode as shown above (Fig. 4a).
To account for a potential disequilibrium for coarse mode particles due to the longer equilibration timescales of larger particles (smaller surface to volume ratio) or the unknown amount of insoluble matter (especially of mineral dust particles), we also study the sensitivity of coarse mode nitrate to the insoluble fraction of mineral cations from coarse mode sea salt and mineral dust.
Organic acids (F5)
Figure 7a shows similar to Fig. 6b time series of the
mea-sured ammonium concentrations (in nmol/m3 air) for the
aerosol fine mode (chemical system F5), together with the model results with ISORROPIA, SCAPE2 and EQSAM2, while Fig. 7b shows the associated scatter plots (model versus observations). In addition, the results of EQSAM2*
are shown. The asterisk (*) denotes that EQSAM2 was
constrained with different input concentrations (see below). In contrast to EQSAM2 (see discussion of Fig. 6b), the predicted concentrations of fine mode ammonium by EQSAM2* are, according to Figs. 7a and b, much closer to the results of ISORROPIA and SCAPE2 for period II and III, only due to differences in the input concentrations of lumped organic acids, which were lower during all pe-riods for EQSAM2* (discussion follows). In particular the high ammonium concentrations, which are confined to the biomass burning periods (II–III), are only reproduced by EQSAM2. Note that the correlation coefficients (R) given in the legends need not necessarily to be in agreement with the scatter shown in Fig. 7b. The reason is that the correla-tion coefficient is mainly phase sensitive (i.e. R=1 means that the values occur at the same time), while the scatter (slope) shows the error in amplitude (i.e. a zero error or one-by-one slope if the predicted values are identical to the observed val-ues at a certain time).
Obviously, there is a threshold value for the input concen-tration of lumped organic acids at which the ammonium is predicted in the aerosol phase in amounts as observed. This threshold value can be determined by the difference between total anions and cations, by accounting for the observed am-monium concentrations. For instance, for this study the re-quired input concentration (threshold value) of the lumped organic acids – needed to balance the aerosol ammonium with respect to the observed concentration – has been esti-mated to best match the observed ammonium concentration for each period, by running EQSAM2 twice. In the first run the model is constrained by observed ammonia and ammo-nium concentrations to predict the amount of (lumped) or-ganic acids that are required to balance the model predic-tions for aerosol ammonium with the observapredic-tions (inverse
1. Period (1.8.-6.8.) N/NW Sea salt
1I. Period (6.8.-12.8.) Subsidence Dust + Biomass burning
1II. Period (12.8.-18.8.) N/NE Sea salt + Biomass burning
a)
Aerosol Ammonium
Gas-liquid-solid Partitioning - Fine Mode (F5)
0 50 100 150 200 250 300 350 400 01.08.2001 10:0002.08.2001 16:0003.08.2001 22:0005.08.2001 1:0006.08.2001 4:0007.08.2001 7:0008.08.2001 10:0009.08.2001 13:0011.08.2001 10:0012.08.2001 19:0013.08.2001 22:0015.08.2001 1:0016.08.2001 4:0017.08.2001 7:0018.08.2001 10:00 Date NH 4 + [nmol/m 3] MINOS ISORROPIA R= 0.85 SCAPE2 R= 0.75 EQSAM2 R= 0.89 EQSAM2* R= 0.80
b) Gas-liquid-solid Partitioning - Fine Mode (F5, Period I-III) Aerosol Ammonium .
0 50 100 150 200 250 300 350 400 0 50 100 150 200 250 300 350 400 Observed NH4+ [nmol/m3] . Modeled NH 4 + [nmol/m 3] . MINOS Period I ISORROPIA R= 0.82 SCAPE2 R= 0.82 EQSAM2 R= 0.79 EQSAM2* R= 0.79 Period II ISORROPIA R= 0.88 SCAPE2 R= 0.69 EQSAM2 R= 0.89 EQSAM2* R= 0.86 Period III ISORROPIA R= 0.86 SCAPE2 R= 0.85 EQSAM2 R= 0.89 EQSAM2* R= 0.81
Fig. 7. Time series of measured (black solid line) and calculated fine mode aerosol ammonium (panel a) [nmol/m3] with the corresponding
scatter plot (panel b) (model predictions versus observations) for the most comprehensive chemical system (F5/C5). The correlation coef-ficients (R) are given in the legends and the colors and symbols of the three models (ISORROPIA, SCAPE2, EQSAM2) are the same as in Fig. 6. The additional model EQSAM2* (turquoise, short-long-dotted dashed with closed triangles) is the same as EQSAM2 except for the input concentrations of mineral cations and lumped organic acids. See text for details. Note the different symbols for the scatter plot that indicate each period, i.e. large closed symbols are used for period I, small open symbols for period II and small closed symbols for period III. The symbols are the same as in panel (a). The correlation coefficients (R) are given in the legend of panel (b) for each period and model, while panel (a) shows the entire period (and each model).
approach). In the subsequent application (forward approach) we account for the estimated amount of (lumped) organic acids that is needed to balance aerosol ammonium.
From this sensitivity study the following values of Lumped Organic Acids (LOA) in percentage of the total (estimated since unknown) particulate organic matter (POM) have been deduced for EQSAM2, while for EQSAM2* we used all of the measured LOA values, assuming that they explain for all three periods approximately 10% of POM: I. Period (1 August 2001, 10:00 h–6 August 2001, 16:00 h):
– fine mode: 10% of POM as LOA
II. Period (6 August 2001, 16:00 h–12 August 2001, 19:00 h): – fine mode: 70% of POM as LOA
III. Period (12 August 2001, 19:00 h–18 August 2001, 10:00 h):
– fine mode: 70% of POM as LOA
Note that for this modeling study we have assumed that the measured LOA (Fig. 4a), with values derived by Sciare et al. (2005), account for approximately 10% of the total though not measured particulate organic matter (POM), since POM might also include water soluble humic-like substances (HULIS). Thus, the total water soluble organic carbon frac-tion (WSOC) that was used as LOA input for EQSAM2 has been 70% of POM for period II and III instead of 10% that were used for EQSAM2* for all periods (accounting for all of the identified organic acids only).
The considerably larger amount of lumped organic acids, required to balance the observed fine mode ammonium during the two periods affected by biomass burning (i.e. period II and III), thus provides an indication of the fraction of additional organic matter, e.g. HULIS, which may be im-portant in addition to the lumped organic acids considered. Assuming that the extracted organic acids are water soluble that roughly account for 10% of the total organic matter (as mentioned above), additionally 60% of the POM would be subject to neutralization by ammonium, which might be HULIS. This fraction would therefore behave as the WSOC fraction that consist of the low molecular weight (LMW) organic acids given in Sect. 2.
Mineral cations (C5)
Similarly to Fig. 7a, Fig. 8a shows the time series of measured nitrate concentrations (in nmol/m3)for the aerosol coarse mode (chemical system C5), together with the model predictions by ISORROPIA, SCAPE2, EQSAM2, while Fig. 8b shows the associated scatter plots (model versus
observations). In addition the results of EQSAM2* are
shown. The asterisk (*) again denotes that EQSAM2 was constrained with different input concentrations (see below).
The time series for aerosol nitrate (Fig. 8a) show that the observed nitrate partitioning follows the RH relatively well (compare with Fig. 3) for the coarse mode, in contrast to aerosol ammonium (Fig. 7a). Nitric acid partitions largely into the aerosol phase under humid conditions, which is less well captured by the models that include all additional min-eral aerosol compounds (SCAPE2 and EQSAM2*). They largely overestimate coarse mode nitrate, especially for the dry period (II). In particular Figs. 8a and b show that – from all models that have been applied to the same input concen-trations, i.e. ISORROPIA, SCAPE2, EQSAM2* – the model predictions of ISORROPIA are in best agreement with the observations for coarse mode nitrate, since mineral cations
except (Na+)are neglected. And for the same reason, the
model predictions of ISORROPIA differ most compared to the other model predictions for the dry period (II), which was influenced by Saharan dust. Only EQSAM2 yields a comparable close agreement with the observations (Fig. 8b) by considering all cations from sea salt and mineral dust. In contrast to EQSAM2, the predicted concentrations of coarse mode nitrate by EQSAM2* are closer to the predictions of SCAPE2 for the entire period and in particular for period II and III (Fig. 8).
Similar to the sensitivity of aerosol ammonium to the con-centration of organic acids, aerosol nitrate appears to be quite sensitive to the overall concentration of mineral cations. In particular for the dry period (II), the additional cations from mineral dust leads to an overestimation of coarse mode ni-trate compared to the observation.
This result indicates that not all of the measured mineral cations are required to neutralize the nitric acid to form ni-trate. Similar to the required input concentration (threshold value) of the lumped organic acids, needed to balance the aerosol ammonium with respect to the observed concentra-tion, the critical concentration of mineral cations has been determined to best match the observed nitrate concentration for each period by running EQSAM2 twice. In the first run the model is constrained by observed nitrate and nitric acid concentrations to predict the amount of mineral cations that are required to balance the model predictions for aerosol ni-trate with the observations (reverse approach, first applica-tion). In the second application (forward approach) we then only account for the fraction of mineral cations that is needed to balance the anions. In this way we implicitly account for the unknown insoluble matter (cations), or the amount of cations not available to neutralize nitric acid due to long equilibration time-scales, or due to the possibility that ni-tric acid might just have been absorbed on the surface of mineral dust particles, still not being neutralized. From this sensitivity study the following values have been deduced for EQSAM2, while we used for EQSAM2*, consistently with all other EQMs and for all periods, the total concentration of measured cations according to Fig. 4b:
1. Period (1.8.-6.8.) N/NW Sea salt
1I. Period (6.8.-12.8.) Subsidence Dust + Biomass burning
1II. Period (12.8.-18.8.) N/NE Sea salt + Biomass burning
a)
Aerosol Nitrate
Gas-liquid-solid Partitioning - Coarse Mode (C5)
0 20 40 60 80 100 120 01.08.2001 10:0002.08.2001 16:0003.08.2001 22:0005.08.2001 1:0006.08.2001 4:0007.08.2001 7:0008.08.2001 10:0009.08.2001 13:0011.08.2001 10:0012.08.2001 19:0013.08.2001 22:0015.08.2001 1:0016.08.2001 4:0017.08.2001 7:0018.08.2001 10:00 Date NO 3 -[nmol/m 3] MINOS ISORROPIA R= 0.74 SCAPE2 R= 0.66 EQSAM2 R= 0.67 EQSAM2* R= 0.68 b) Aerosol Nitrate
Gas-liquid-solid Partitioning - Coarse Mode (C5, Period I-III) .
0 20 40 60 80 100 120 0 10 20 30 40 50 60 Observed NO3- [nmol/m3] . Modeled NO 3 - [nmol/m 3] MINOS Period I ISORROPIA R= 0.83 SCAPE2 R= 0.75 EQSAM2 R= 0.80 EQSAM2* R= 0.85 Period II ISORROPIA R= 0.61 SCAPE2 R= 0.75 EQSAM2 R= 0.53 EQSAM2* R= 0.84 Period III ISORROPIA R= 0.59 SCAPE2 R= 0.60 EQSAM2 R= 0.44 EQSAM2* R= 0.70
Fig. 8. Time series of measured (black solid line) and calculated coarse mode aerosol nitrate (panel a) [nmol/m3] and the corresponding
I. Period (1 August 2001, 10:00 h–6 August 2001, 16:00 h): – coarse mode: 4% of POM as LOA, 60% of Na+, 20%
of Ca2+and Mg2+
II. Period (6 August 2001, 16:00 h–12 August 2001, 19:00 h): – coarse mode: 8% of POM as LOA, 60% of Na+, 20%
of Ca2+and Mg2+
III. Period (12 August 2001, 19:00 h–18 August 2001, 10:00 h):
– coarse mode: 8% of POM as LOA, 60% of Na+, 20%
of Ca2+and Mg2+
According to Fig. 4, aerosol nitrate is largely confined to the coarse mode, in contrast to ammonium that is mainly present in the fine mode. In particular the model results (Fig. 8b) are much closer to the observations for coarse mode nitrate for period I, with fewer discrepancies between the models compared to the results for period II and III, indi-cating that aerosol nitrate is mostly neutralized by sodium and less by other cations. The differences in the models pdictions of EQSAM2 and EQSAM2* and the fact that the re-sults of EQSAM2 are closer to the observations for period II and III compared to EQSAM2* (and the other EQMs) indi-cate that not all measured mineral cations were involved in the neutralization of nitric acid. Hence, the predictions of EQSAM2* are closer to SCAPE2 as both consider mineral cations, but both deviate most from the observations com-pared to EQSAM2 and ISORROPIA. This is in particular the case for the dry period, being strongly influenced by Saharan dust aerosols that lead to a significant contribution of mineral cations from mineral dust (in particular Ca2+and Mg2+).
According to the results shown in Fig. 8, however, also not all measured sodium was needed for the neutralization of observed nitric acid during the two humid periods (I and III), which were predominantly influenced by coarse sea salt aerosol. The additional – although small – amount of
non-sodium cations (in particular Ca2+ and Mg2+)lead to too
high nitrate concentrations if all sodium is considered in the neutralization reactions, as the results of SCAPE2 and EQSAM2* indicate. Even for the case where we have ne-glected any additional mineral cations (Ca2+, Mg2+and K+)
except sodium, the predicted nitrate concentrations are too high if all sodium is considered for the neutralization reac-tions, as indicated by the results of ISORROPIA. Obviously, not all sodium cations are required to neutralize nitric acid, even for the two humid periods (I and III). This indicates that for these cases sea salt particles might have consisted of an insoluble sodium chloride core, which did not equilibrate with nitric acid within the measurement interval of two–three hours. Approximately 40% of the sea salt particles (moles m−3air) were not internally mixed but rather coated by non-neutralized nitric acid, possibly associated with an organic film.
5 Discussion
To study the temperature (T) and relative humidity
(RH) dependent gas/aerosol equilibrium
partition-ing of reactive nitrogen compounds of the observed H2SO4/HSO−4/SO2−4 −HNO3/NO−3−NH3/NH+4−HCl/Cl−−
Na+−Ca2+−Mg2+−K+−H
2O-system, including lumped
organic acids (R-COOH) (Fig. 2), we have divided this complex aerosol system into five chemical systems for the fine (F1–F5) and coarse (C1–C5) aerosol mode, according to Table 1. This has been achieved by different constraints on the ionic composition, i.e. by subsequently including
additional cations and anions. This distinction allowed
a comparison of rather different EQMs (ISORROPIA, SCAPE2, EQSAM2) at the same and different levels of complexity.
While first of all our results show that all three EQMs yield comparable results (on average within ∼10% that approxi-mately is the measurement uncertainty) if they are applied at the same level of complexity (involving chemical systems F1/C1–F3/C3 of Figs. 5 and 6a, c), the application of the EQMs at different levels of complexity (and the compari-son with measurements) first of all indicates the importance of the consistent inclusion of (soluble) mineral cations and (lumped) organic acids. Note that the application of the three EQMs at the different levels of complexity is a much less well-constrained approach, which yields much less compa-rable results, especially under different chemical conditions, than applied at the same level of complexity (Fig. 5).
Note further that the so-called equivalent sodium approach (chemical system F3/C3, Table 1), should be regarded as an approximation only, because of inconsistencies in the RHDs.
For instance, the RHD of Na2SO4is 93% and higher than of
MgSO4, which is 86%, while the RHD of NaHSO4is 52%
and thus lower than that of MgSO4. In the case of the
equiv-alent sodium approach, these differences in the RHDs will cause differences in the liquid/solid partitioning, which sub-sequently affects the gas-aerosol partitioning (also of nitro-gen compounds). This picture becomes even more compli-cated as EQSAM2 and ISORROPIA consider deliquescence relative humidities of mixed salts (Nenes et al., 1998), since they are for thermodynamic reasons generally lower than the
RHDs of the individual salt compounds, which are only
con-sidered in SCAPE2 (Kim et al., 1995). Nevertheless, the models agree within 10% also for the equivalent sodium ap-proach (F3/C3 of Fig. 5), which indicates that these differ-ences are of secondary importance for the gas-aerosol par-titioning of reactive nitrogen compounds. Obviously, it is more important to consistently include the major aerosol components, as demonstrated by the model comparison at different levels of complexity (F4/C4 and F5/C5) (Fig. 5).
Figures 5 and 6b, d further reveal the relative importance of mineral cations and organic acids for the gas-aerosol par-titioning of nitrogen compounds. For instance, our results show that (lumped) organic acids are required to correctly

![Fig. 4. Time averages of observed aerosol precursor gas and aerosol concentrations [nmol/m 3 ] for the three different periods as defined in Fig](https://thumb-eu.123doks.com/thumbv2/123doknet/14544035.535914/8.892.171.737.120.969/averages-observed-aerosol-precursor-aerosol-concentrations-different-periods.webp)
![Fig. 5. Time averages (entire measurement time period) of observed and model calculated ammonium partitioning (ratio of aerosol ammo- ammo-nium and ammoammo-nium plus ammonia) [%] for the fine (F) and coarse (C) aerosol mode and for all aerosol systems (F1](https://thumb-eu.123doks.com/thumbv2/123doknet/14544035.535914/10.892.130.757.87.540/averages-measurement-observed-calculated-ammonium-partitioning-aerosol-ammoammo.webp)
![Fig. 6. Time series of measured (black solid line) fine mode aerosol ammonium (panels a and b) [nmol/m 3 ] and coarse (panels c and d) mode ammonium [nmol/m 3 ] for two different aerosol systems: The reduced chemical system (panels a and c) neglecting all](https://thumb-eu.123doks.com/thumbv2/123doknet/14544035.535914/11.892.78.821.95.593/measured-aerosol-ammonium-ammonium-different-aerosol-chemical-neglecting.webp)
![Fig. 7. Time series of measured (black solid line) and calculated fine mode aerosol ammonium (panel a) [nmol/m 3 ] with the corresponding scatter plot (panel b) (model predictions versus observations) for the most comprehensive chemical system (F5/C5)](https://thumb-eu.123doks.com/thumbv2/123doknet/14544035.535914/13.892.172.723.120.878/measured-calculated-ammonium-corresponding-predictions-observations-comprehensive-chemical.webp)
![Fig. 8. Time series of measured (black solid line) and calculated coarse mode aerosol nitrate (panel a) [nmol/m 3 ] and the corresponding scatter plot (panel b), analogous to Fig](https://thumb-eu.123doks.com/thumbv2/123doknet/14544035.535914/15.892.129.764.115.975/series-measured-calculated-aerosol-nitrate-corresponding-scatter-analogous.webp)
![[PDF] cours Langage UML PDF | Télécharger PDF](data:image/gif;base64,R0lGODlhAQABAIAAAP///wAAACH5BAEAAAAALAAAAAABAAEAAAICRAEAOw==)