HAL Id: inserm-00122150
https://www.hal.inserm.fr/inserm-00122150
Submitted on 27 Dec 2006
HAL is a multi-disciplinary open access
archive for the deposit and dissemination of
sci-entific research documents, whether they are
pub-lished or not. The documents may come from
teaching and research institutions in France or
abroad, or from public or private research centers.
L’archive ouverte pluridisciplinaire HAL, est
destinée au dépôt et à la diffusion de documents
scientifiques de niveau recherche, publiés ou non,
émanant des établissements d’enseignement et de
recherche français ou étrangers, des laboratoires
publics ou privés.
Construction of a multiple fluorescence labelling system
for use in co-invasion studies of Listeria monocytogenes.
Jens Andersen, Bent Roldgaard, Ariel Lindner, Bjarke Christensen, Tine Licht
To cite this version:
Jens Andersen, Bent Roldgaard, Ariel Lindner, Bjarke Christensen, Tine Licht. Construction of a
multiple fluorescence labelling system for use in co-invasion studies of Listeria monocytogenes.. BMC
Microbiology, BioMed Central, 2006, 6, pp.86. �10.1186/1471-2180-6-86�. �inserm-00122150�
Open Access
Methodology article
Construction of a multiple fluorescence labelling system for use in
co-invasion studies of Listeria monocytogenes
Jens B Andersen
1, Bent B Roldgaard
1, Ariel B Lindner
2, Bjarke B Christensen
1and Tine R Licht*
1Address: 1Danish Institute for Food and Veterinary Research, Department of Microbiological Food Safety, Mørkhøj Bygade 19, 2860 Søborg,
Denmark and 2Molecular, Evolution and Medical Genetics Laboratory, INSERM U571, Necker-Enfants Malades Faculty of Medicine, René Decartes
– Paris V University, 156 Rue de Vaugirard, 75730 Paris Cedex 15, France
Email: Jens B Andersen - jeban@dfvf.dk; Bent B Roldgaard - bebro@dfvf.dk; Ariel B Lindner - lindner@necker.fr; Bjarke B Christensen - bbc@dfvf.dk; Tine R Licht* - trl@dfvf.dk
* Corresponding author
Abstract
Background: Existing virulence models are often difficult to apply for quantitative comparison of
invasion potentials of Listeria monocytogenes. Well-to-well variation between cell-line based in vitro assays is practically unavoidable, and variation between individual animals is the cause of large deviations in the observed capacity for infection when animal models are used.
One way to circumvent this problem is to carry out virulence studies as competition assays between 2 or more strains. This, however, requires invasion-neutral markers that enable easy discrimination between the different strains.
Results: A fluorescent marker system, allowing visualization and identification of single L.
monocytogenes cells as well as colonies in a non-destructive manner, was developed. Five different
fluorescent labels are available, and allowed simultaneous visual discrimination between three differently labelled strains at the single cell level by use of fluorescence microscopy. More than 90% of the L. monocytogenes host cells maintained the fluorescence tags for 40 generations.
The fluorescence tags did not alter the invasive capacity of the L. monocytogenes cells in a traditional Caco-2 cell invasion assay, and visual discrimination between invaded bacteria carrying different fluorescent labels inside the cells was possible.
Conclusion: The constructed fluorescent marker system is stable, easy to use, does not affect the
virulence of L. monocytogenes in Caco-2 cell assays, and allows discrimination between differently labelled bacteria after internalization in these cells.
Background
Listeria monocytogenes is an intracellular pathogen of
humans and animals [1], and has been implicated in sev-eral foodborne outbreaks as well as sporadic cases of dis-ease during the last ten to fifteen years [2]. It is known that
differences between strains as well as differences in envi-ronmental conditions affect the invasive potential of this pathogen [3-5]. Virulence models allowing comparison of the pathogenic potency of different cultures of Listeria are therefore essential tools in the study of bacteria within
Published: 03 October 2006
BMC Microbiology 2006, 6:86 doi:10.1186/1471-2180-6-86
Received: 18 July 2006 Accepted: 03 October 2006 This article is available from: http://www.biomedcentral.com/1471-2180/6/86
© 2006 Andersen et al; licensee BioMed Central Ltd.
This is an Open Access article distributed under the terms of the Creative Commons Attribution License (http://creativecommons.org/licenses/by/2.0), which permits unrestricted use, distribution, and reproduction in any medium, provided the original work is properly cited.
BMC Microbiology 2006, 6:86 http://www.biomedcentral.com/1471-2180/6/86
this genus. Additionally, such models are needed to study the role of specific genes in the process of infection. Virulence models most commonly applied include cell-line based assays and various animal models. However, a number of obstacles are associated with the use of such models for comparative studies of the infectivity of
Liste-ria. Despite efforts to optimize reproducibility in cell line
based in vitro studies, well to well variation is difficult to avoid [6]. Likewise, in animal models, regardless of the employment of well-characterised laboratory animal strains, variations between individual animals commonly occur. The lack of accurate reproducibility in existing vir-ulence models means that it is often difficult to compare the virulence of two different Listeria strains in a quantita-tive manner. A solution to this problem is to carry out vir-ulence studies as competition assays between two or more strains. This approach has been applied with success by use of Listeria carrying resistance markers to various anti-biotics [7]. An attractive alternative is to use fluorescent protein markers. The Green Fluorescent Protein (GFP) was introduced approximately ten years ago as a conven-ient tool for studies of the pathogenesis of e.g. Salmonella
typhimurium and Yersenia paratuberculosis [8]. More
recently, this protein has been applied in studies of Gram-positive bacteria including Streptococcus suis [9], and
Liste-ria monocytogenes [10,11]. The advantage of fluorescent
markers, when compared to resistance gene markers, is that they allow direct visualization and real-time studies of tagged bacteria. Furthermore, they allow certain identi-fication of the tagged strains in un-sterile systems such as the mammalian gastrointestinal tract, where naturally occurring resistant bacteria may be difficult to distinguish from resistance-tagged strains. The disadvantage of fluo-rescence tagging is that small, tagged subpopulations can be difficult to quantify, since selection for fluorescence is not possible. This disadvantage may be overcome by com-bining fluorescent markers with antibiotic resistance markers.
We have developed a fluorescent marker system that allows identification of single Listeria cells as well as colo-nies in a non-destructive manner, and demonstrate its use in a traditional Caco-2 cell invasion assay.
Results and discussion
A multicolour tagging system based on the synthesis of Cyan Fluorescent Protein (CFP), Green Fluorescent Protein (GFP), Yellow Fluorescent Protein (YFP), DsRedExpress or HcRed
Fluorescent microscopy at 16× magnification revealed that L. monocytogenes ScottA harbouring either pNF8 (wt-GFP), pJEBAN2 (wt-CFP), pJEBAN3 (wt-YFP), pJEBAN4 (wt-HcRed) and pJEBAN6 (wt-DsRedEx) all gave rise to easily detectable fluorescent colonies of the expected
col-our, demonstrating that a heterolog expression of Green Fluorescent Protein (GFP), Cyan Fluorescent Protein (CFP), Yellow Fluorescent Protein (YFP), or the red fluo-rescent markers HcRed and DsRedexpress had successfully been established in L. monocytogenes ScottA. The labelling system was tested and shown to confer the expected fluo-rescence also to other strains of L. monocytogenes, includ-ing EGDe and LO28 (Table 1).
L. monocytogenes cells tagged with any of the fluorescent
proteins could be detected at the single cell level by fluo-rescence microscopy (630× magnification). By employ-ment of appropriate combinations of different excitation wavelength and different filtersets, spectral discrimination between strains wt-CFP, wt-YFP and wt-DsRedEx mixed in a ratio of 1:1:1 was obtained at the single cell level (Figure 1). Although CFP, YFP and DsRedExpress are not maxi-mally excitated by UV-light, visual inspection revealed that colonies of wt-CFP, wt-YFP and wt-DsRedEx could be discriminated when placed on a 302 nmUV-table (Figure 2). GFP tagged Listeria also gave rise to fluorescent colo-nies when excitated at 302 nm, however as expected from the similar spectral properties of GFP (emission maxi-mum at 510 nm), and YFP (emission maximaxi-mum at 527 nm), visual differentiation between GFP-tagged and YFP-tagged L. monocytogenes at the colony level was not possi-ble. Similarly, visual discrimination between colonies of GFP- and CFP-tagged cells was difficult.
Listerial growth and plasmid stability in batch cultures
No difference in growth rate between the labelled strains was observed during exponential growth in Erythromy-cin-supplemented BHI of L. monocytogenes ScottA tagged with plasmids carrying CFP, GFP, YFP, DsRedEx or HcRed. This observation is important for the utility of the tagged stains in comparative co-inoculation studies, where biases in growth could obscure the results.
Propagation of the five labelled strains for 100 genera-tions without Erythromycin revealed that within the first 40 generations, more than 90 % of the bacteria in any of the five cultures still carried the plasmid. No significant differences in the fraction of plasmid harbouring cells were observed among the five cultures during this period, clearly demonstration that the segregational stability of pNF8, pJEBAN2, pJEBAN3, pJEBAN4 and pJEBAN6 was the same for all plasmids during the first 40 generations (Figure 3). Throughout the experiment, the fraction of plasmid harbouring bacteria as a function of the number of cell divisions was similar for cultures of L.
monocy-togenes tagged with CFP, GFP, and YFP, reaching a value of
approximately 20 % following propagation for 100 gener-ations in the absence of selective pressure. Likewise, the fraction of plasmid harbouring bacteria as a function of generation number was observed to be similar in cultures
of HcRed- and DsRedEx-tagged cells, however more than 50% of these bacteria still carried the plasmid at the end of the experiment (Figure 3). This group of plasmids was thus slightly more stably maintained than the plasmids tagged with CFP, GFP and YFP, which are all derivatives of the same Green Fluorescent Protein isolated from the jel-lyfish Aequorea victoria [10,12]. The sequences of the red fluorescent proteins, which are obtained from the sea anemone Heteractis crispa [13] and the coral Discosoma [14], respectively, are shorter than the GFP-derived pro-teins, which may mean that they impose a smaller cell burden on the tagged Listeria, thus explaining the better stability. The observed differences in maintenance should be taken into consideration when applying the con-structed plasmids (Table 1) for comparison experiments where fluorescence tagged bacteria are quantified after more than 40 bacterial generations.
Non-fluorescent, erythromycin resistant colonies were never observed in any of the 5 cultures investigated,
con-firming that all the constructed plasmids were 100 % structurally stable.
Invasion assays with fluorescence-tagged bacteria
Exposure of Caco-2 cells to the fluorescence tagged strains of L. monocytogenes ScottA at an infection multiplicity of approximately 25 bacteria per cell showed that infection potentials of these strains were not different (p < 0.05) from that of the un-tagged parent strain (Figure 4). Expres-sion of the fluorescent proteins thus did not affect the infection potential of the investigated strain. Additionally, when wt strains with three different fluorescent tags were mixed in a ratio of 1:1:1 prior to invasion in Caco-2 cells, almost the same ratio was found between the tagged
Liste-ria that had invaded the cells, showing that differently
labelled strains were equally virulent (Figure 5). Caco-2 assays performed with the L. monocytogenes strains EGDe and LO28 tagged with either CFP or YFP showed that the invasion frequency was independent of these two fluores-cent tags also in other strain backgrounds (data not shown).
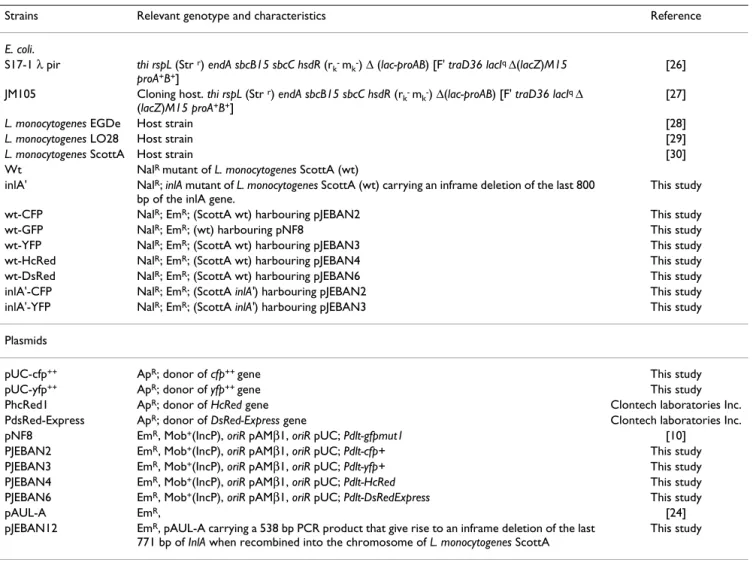
Table 1: Strains and plasmids
Strains Relevant genotype and characteristics Reference
E. coli.
S17-1 λ pir thi rspL (Str r) endA sbcB15 sbcC hsdR (r
k- mk-) Δ (lac-proAB) [F' traD36 lacIq Δ(lacZ)M15
proA+B+]
[26] JM105 Cloning host. thi rspL (Str r) endA sbcB15 sbcC hsdR (r
k- mk-) Δ(lac-proAB) [F' traD36 lacIq Δ
(lacZ)M15 proA+B+]
[27]
L. monocytogenes EGDe Host strain [28]
L. monocytogenes LO28 Host strain [29]
L. monocytogenes ScottA Host strain [30]
Wt NalR mutant of L. monocytogenes ScottA (wt)
inlA' NalR; inlA mutant of L. monocytogenes ScottA (wt) carrying an inframe deletion of the last 800
bp of the inlA gene.
This study wt-CFP NalR; EmR; (ScottA wt) harbouring pJEBAN2 This study
wt-GFP NalR; EmR; (wt) harbouring pNF8 This study
wt-YFP NalR; EmR; (ScottA wt) harbouring pJEBAN3 This study
wt-HcRed NalR; EmR; (ScottA wt) harbouring pJEBAN4 This study
wt-DsRed NalR; EmR; (ScottA wt) harbouring pJEBAN6 This study
inlA'-CFP NalR; EmR; (ScottA inlA') harbouring pJEBAN2 This study
inlA'-YFP NalR; EmR; (ScottA inlA') harbouring pJEBAN3 This study
Plasmids
pUC-cfp++ ApR; donor of cfp++ gene This study
pUC-yfp++ ApR; donor of yfp++ gene This study
PhcRed1 ApR; donor of HcRed gene Clontech laboratories Inc.
PdsRed-Express ApR; donor of DsRed-Express gene Clontech laboratories Inc.
pNF8 EmR, Mob+(IncP), oriR pAMβ1, oriR pUC; Pdlt-gfpmut1 [10]
PJEBAN2 EmR, Mob+(IncP), oriR pAMβ1, oriR pUC; Pdlt-cfp+ This study
PJEBAN3 EmR, Mob+(IncP), oriR pAMβ1, oriR pUC; Pdlt-yfp+ This study
PJEBAN4 EmR, Mob+(IncP), oriR pAMβ1, oriR pUC; Pdlt-HcRed This study
PJEBAN6 EmR, Mob+(IncP), oriR pAMβ1, oriR pUC; Pdlt-DsRedExpress This study
pAUL-A EmR, [24]
pJEBAN12 EmR, pAUL-A carrying a 538 bp PCR product that give rise to an inframe deletion of the last
771 bp of InlA when recombined into the chromosome of L. monocytogenes ScottA
BMC Microbiology 2006, 6:86 http://www.biomedcentral.com/1471-2180/6/86
It should be noted, that infection of mammalian cells does not give full information about infection at the levels of complex tissues and individuals. However, unpub-lished data from our lab indicated that also in a guinea-pig model, the virulence of Listeria was unaffected by the fluorescent labels [B. B. Roldgaard, J. B. Andersen, T.R. Licht and B.B. Christensen, unpublished]. This is in accordance with previous studies showing that GFP-tag-ging did not affect the virulence of Listeria in a murine model [10].
An L. monocytogenes ScottA strain carrying a mutation in the inlA gene, encoding InternalinA which is known to be necessary for listerial epithelial invasion [15] was con-structed and designated inlA'. The infection potential of the inlA' mutant was more than 1000 fold lower than observed for the wt strains (Figure 4), which is in accord-ance with previous reports [16,17].
When fluorescence-tagged L. monocytogenes wt strains were mixed with the fluorescence-tagged invasion-impaired inlA' mutant, the difference in invasion capacity observed for the individual strains was reflected also in the mixed infections (Figure 5). However, since it was not possible to select for the mutant strain, the detection limit
was increased by the presence of the wt strain, which out-numbered the mutant about 1000 fold as expected from the separate invasion assays (Figure 4).
This demonstrates that co-invasion assays may be a useful method for rapid screening of differences in infection potentials between different strains of L. monocytogenes when a fluorescent labelling system is used for discrimina-tion between the strains. Addidiscrimina-tionally, it shows that the presence of the wt strain does not mediate passive uptake of the inlA' mutant. Fluorescent bacteria were easily visu-alized and distinguished from each other inside the Caco-2 cells by fluorescence microscopy (Figure 6).
Conclusion
We have developed a stable fluorescent labelling system for use in L. monocytogenes, and demonstrate that the labels do not affect the invasion potential of L.
monocy-togenes ScottA nor of an invasion-impaired mutant of this
strain. The fluorescent labels allows easy discrimination between tagged cells and other bacteria in un-sterile sys-tems, as well as discrimination between strains carrying different fluorescent markers, and provides a highly useful tool for researchers addressing virulence mechanisms of
Listeria. Additionally, the labelling system allows
real-time studies and visualization of bacteria internalized in
Visualization of fluorescent L. monocytogenes colonies Figure 2
Visualization of fluorescent L. monocytogenes colo-nies. Colonies of wt-CFP, wt-YFP and wt-DsRedExpress
could be discriminated when placed on a 302 nmUV-table, and appeared bluish, yellow and red.
Visualization of fluorescent L. monocytogenes cells Figure 1
Visualization of fluorescent L. monocytogenes cells.
Confocal image showing single cells of L. monocytogenes tagged with CFP, YFP or DsREdExpress. Over night cultures of each of the three strains were mixed in a 1:1:1 ratio prior to visualization. Exitation wavelengths were 456, 488 or 543 nm, and emission was captured at 500–510, 555–583 or 592– 640 nm.
eukaryotic cells, and is an optimal tool for comparative co-infection studies between up to three Listeria strains. However, for comparison of strains with highly different infection potentials, such as a wt Listeria and its inlA mutant, it should be taken into account that it is not
pos-sible to select for fluorescence, and that visualization of a strain constituting a very small minority might therefore be difficult. One solution to this would be to equip the less virulent strain with a distinct antibiotic resistance.
Methods
Bacterial strains, plasmids and growth media
Strains and plasmids used in this study are listed in Table 1. Bacterial strains were grown on BHI-agar supplemented with the relevant antibiotics. Erythromycin was used at a final concentration of 5 to 10 µg/mL for L. monocytogenes and of 150 ug/mL for E. coli. Nalidixic acid was used at a final concentration of 100 µg/mL for L. monocytogenes.
DNA manipulation
Standard techniques for DNA manipulation were applied [18]. Plasmid DNA was prepared using the QIAGEN mini spin prep Kit (QIAGEN, Germany) and chromosomal DNA was extracted by the QIAGEN Genomic DNA Tip
Mixed infections Figure 5
Mixed infections. Ratio of wt L. monocytogenes strains and
its inlA' mutant tagged with YFP (yellow), DsRed (red) or CFP (blue) prior to invasion (A) and after recovery from Caco-2 cells (B).
wt
wt
wt
wt
wt
inlA’
inlA’
A
B
Stability of fluorescence-encoding plasmids Figure 3
Stability of fluorescence-encoding plasmids.
Segrega-tional stability of plasmid pNT8 derivatives encoding the fluo-rescent proteins CFP (blue), GFP (green), YFP (yellow), DsRedExpress (red, solid line) or HcRed (red, broken line).
L. monocytogenes harbouring the plasmids were propagated in
BHI batch culture as described in the Methods section. Each point represents the average of data from three experiments. Error bars represent standard deviations.
0 10 20 30 40 50 60 70 80 90 100 0 20 40 60 80 100 No. of generations % plasm id carrying bacteria
Invasion potentials fluorescence tagged L. monocytogenes Figure 4
Invasion potentials fluorescence tagged L.
monocy-togenes. Numbers of Colony Forming Units (CFU) of
fluo-rescent L. monocytogenes strains and its inlA' mutant, which were internalized per well of Caco-2 cells. Counts were nor-malized to a concentration of 107 L. monocytogenes per ml in
the bacterial cultures prior to infection of Caco-2 cells. Each point represents the average of data from two experiments. Error bars represent standard deviations. Statistical analysis (Dunnet's test) confirmed that the infection potentials of the labelled strains were not different from that of the wt (p < 0.05). 0 1 2 3 4 5 6
(wt, GFP) (wt, CFP) (wt, YFP) (wt, DsRed) (wt, HcRed) (wt) (inlA', CFP) (inlA', YFP)
Log CF
BMC Microbiology 2006, 6:86 http://www.biomedcentral.com/1471-2180/6/86
100/G System (QIAGEN, Germany). Transformation of E.
coli and L. monocytogenes was done by electroporation in a
0.2 cm cuvette by use of a GenePulser apparatus (Bio-Rad) set to 25 µF, 400 Ω and 2.5 kV/cm. PCR was carried out using the Phusion High Fidelity PCR system (FINNZYMES OY, Finland). A GFX PCR DNA and Gel Band Purification Kit (Amersham Pharmacia Biotech) were applied for puri-fication of DNA fragments.
Construction of a multi colour tagging system
Optimized version of the Cyan- and Yellow fluorescent proteins were created as follows: The hsp60 promoter driven GFP+ [19] was amplified and cloned into the pUC18 plasmid. pUC-yfp++ was obtained by introducing
the following mutations by site-directed mutagenesis (Stratagene): F46L, S65G, V68A, S72A, S175G, T203Y, whereas the pUC-cfp++, was obtained by introducing the
K26R, Y66W, N146I, N164H, S175G, N212K mutations. Sequences can be found at [20]. The resulting proteins exhibit improved stability at elevated temperature (up to 46°C) and stronger fluorescence as judged by comparison with commercially available variants.
To construct a multicolour tagging system, the cfp++ gene
of pUC-cfp++, the yfp++ gene of pUC-yfp++, the HcRed gene
of pHcRed1 and the DsRed-Express gene of pDsRed-Express (Clontech Laboratories Inc., USA), were initially PCR amplified using either of the primersets Gfp_for/ Gfp_rev, HcRed_for/HcRed_rev, or RedEx_for/ DsRedEx_rev (Table 1). The four resulting PCR products encoding cfp++, yfp++, HcRed and DsRed-Express
respec-tively, were restricted with BamHI and PstI and
subse-quently ligated to the 7 Kb BamHI-PstI fragment of pNF8, to give pJEBAN2, pJEBAN3, pJEBAN4 and pJEBAN6. Finally, pJEBAN2, pJEBAN3, pJEBAN4, pJEBAN6 and pNF8 were electroporated into E. coli strain S17-λ-pir to obtain donor strains from which pJEBAN2, pJEBAN3, pJEBAN4, pJEBAN6 and pNF8 can be conjugated into a broad range of bacteria by a simple 2 strain mating proce-dure.
Fluorescent tagging of L. monocytogenes
All matings were carried out using a slightly modified ver-sion of the protocol previously described by Trieu-Cout and coworkers [21]. Briefly, 250 uL culture of L.
monocy-togenes ScottA (recipient) cultivated for 18 hours at 37°C
in BHI broth containing 100 µg/mL Nalidixic acid and 250 µL culture of S17-λ-pir harbouring pJEBAN2 (donor) cultivated for 18 hours at 37°C in BHI broth containing 150 µg/mL erythromycin was harvested by centrifugation, washed twice with 250 µL of 0.9 % NaCl to remove anti-biotics and subsequently resuspended in 25 µL of 0.9 % NaCl. The 25 µL aliquots of the donor and the recipient were mixed and subsequently spotted onto a BHI-agar plate containing 0.5 µg/mL penicillinG. Following 24 hours of incubation at 37°C, the resulting conjugation spots were gently removed from the BHI-agar plate and resuspended in 1 mL 0.9 % NaCl. Finally, in order to select Cyan fluorescent transconjugants (strains harbour-ing pJEBAN2), appropiate dilutions of the conjugation mix were spread onto BHI-agar containing 100 µg/mL nalidixic acid and 10 µg/mL erythromycin. By analogy, pNF8, pJEBAN3, pJEBAN4 and pJEBAN6 were conjugated from S17-λ-pir into L. monocytogenes to give green fluores-cent, yellow fluorescent and red fluorescent strains. The inlA' mutant of L. monocytogenes (construction described below) was tagged with pJEBAN2 and pJEBAN3 in a sim-ilar way.
Plasmid stability in vitro
To obtain starter cultures in which the entire L.
monocy-togenes populations carried pNF8, pJEBAN2, pJEBAN3,
pJEBAN4 or pJEBAN6, brightly fluorescent single colonies of the strain harbouring either of these plasmids were ini-tially inoculated into 10 mL BHI supplemented with 100 µg/mL Nalidixic acid and 10 µg/mL Erythromycin and incubated at 37°C for 18 hours. At timepoint g = 0 (number of population generations in the absence of selective pressure), 10 µl of each of the starter cultures were inoculated into 10 mL BHI supplemented with 100 µg/mL of Nalidixic acid (non selective media) and from the resulting cultures, samples were immediately taken to determine the fraction of plasmid harbouring bacteria at the start of the experiment (g = 0). Following 12 hours of growth in the absence of selective pressure (time point g = 10), 10 uL of each of the outgrown cultures were again inoculated into 10 mL of fresh medium, and from the
Visualization of internalized bacteria Figure 6
Visualization of internalized bacteria. Caco-2 cell
con-taining a mixture of blue/cyan wt-CFP and yellow wt-YFP L.
monocytogenes. A: Fluorescence microscopy image. B:
Over-lay of fluorescent image and phase contrast image showing the Caco-2 cell.
resulting cultures samples were taken to determine the fraction of fluorescent bacteria (plasmid harbouring bac-teria) at timepoint g = 10. This procedure was repeated every 12 hours for a total of 120 hours equivalent to approximately 100 generations. Following 24 hours of incubation at 37°C, all BHI-agar plates were replicated to BHI-agar plates supplemented with 10 µg/ml of Erythro-mycin, and the fraction of plasmid harbouring bacteria was determined as the number of Erythromycin resistant colonies divided by the total number of colonies present on the BHI-agar master plate. It was verified that all Eryth-romycin-resistant colonies were fluorescent by inspection on a UV-table (exitation 302 nm). All sampling was done in duplicates. The experiment was repeated 3 times.
Construction of an L. monocytogenes deletion mutant designated inlA'
A mutant of L. monocytogenes ScottA carrying an in-frame deletion of the last 771 bp of the inlA gene was con-structed using 2-way splicing by overlap extension (SOE) PCR [22] followed by allelic exchange mutagenesis. Ini-tially, 2 PCR fragments designated InlA-int (293 bp) and InlA-down (270 bp) covering different regions of the inlA gene was amplified from chromosomal DNA of L.
mono-cytogenes by use of the primersets, InlA_N_up/
InlA_N_down and InlA_C_up/InlA_C_down, respectively (Table 2). Since the inlA gene of L. monocytogenes ScottA had only been partially sequenced at the time of design, primers were designed based on the genome sequence of
L. monocytogenes 4b 2365 [23]. In a second round of PCR,
fragments InlA-int and InlA-down were spliced together by use of the primerset InlA_N_up/InlA_C_down to pro-duce a 538 bp fragment (designated InlA') covering nt 1381 to nt 1630 directly followed by nt 2401 to nt 2652
of inlA. The PCR fragment InlA' was restricted with BamHI and HindIII, and cloned in between the BamHI and Hin-dIII sites of the temperature sensitive shuttle vector pAUL-A [24]. The resulting plasmid pJEBpAUL-AN12 was introduced into L. monocytogenes by electroporation and inlA mutants carrying inframe deletions covering the last 771 nt of the
inlA gene were subsequently constructed as previously
described [25]. Finally, strains carrying the desired dele-tion were identified by PCR, and the correct deledele-tion event was verified by DNA sequence analysis of the resulting PCR product.
Caco-2 invasion assays
Enterocyte-like Caco-2 cells were cultivated and prepared as previously described [3]. Bacteria were cultivated over night at 37°C in BHI media supplemented with 10 µg/mL of Erythromycin and diluted to a concentration of 107
bacteria/mL prior to the invasion assays. For co-invasion assays, the two or three strains were mixed in a 1:1 or 1:1:1 ratio. One ml of bacterial culture was applied to each well, resulting in a multiplicity of infection of approximately 25 bacteria per Caco-2 cell. Following 1 hour of invasion and 2 hours of gentamycin treatment to kill extracellularly located bacteria, Caco-2 cells were lysed, diluted and sub-sequently spread onto BHI-agar supplemented with 10 µg/mL of Erythromycin. After 96 hours of incubation at 22°C, plates were placed on a UV table (excitation at 302 nm), fluorescent colonies were enumerated, and digital images were recorded as described below. Sampling was done in triplicate, and the experiments were performed twice.
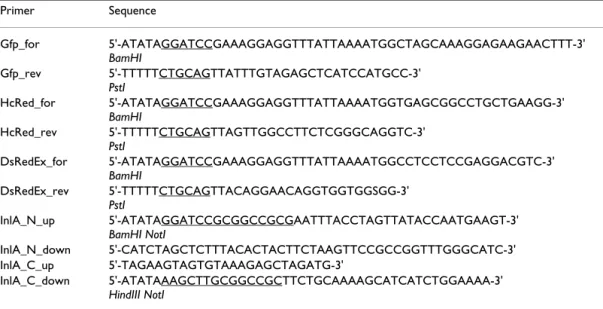
Table 2: Primers designed in this study.
Primer Sequence Gfp_for 5'-ATATAGGATCCGAAAGGAGGTTTATTAAAATGGCTAGCAAAGGAGAAGAACTTT-3' BamHI Gfp_rev 5'-TTTTTCTGCAGTTATTTGTAGAGCTCATCCATGCC-3' PstI HcRed_for 5'-ATATAGGATCCGAAAGGAGGTTTATTAAAATGGTGAGCGGCCTGCTGAAGG-3' BamHI HcRed_rev 5'-TTTTTCTGCAGTTAGTTGGCCTTCTCGGGCAGGTC-3' PstI DsRedEx_for 5'-ATATAGGATCCGAAAGGAGGTTTATTAAAATGGCCTCCTCCGAGGACGTC-3' BamHI DsRedEx_rev 5'-TTTTTCTGCAGTTACAGGAACAGGTGGTGGSGG-3' PstI InlA_N_up 5'-ATATAGGATCCGCGGCCGCGAATTTACCTAGTTATACCAATGAAGT-3' BamHI NotI InlA_N_down 5'-CATCTAGCTCTTTACACTACTTCTAAGTTCCGCCGGTTTGGGCATC-3' InlA_C_up 5'-TAGAAGTAGTGTAAAGAGCTAGATG-3' InlA_C_down 5'-ATATAAAGCTTGCGGCCGCTTCTGCAAAAGCATCATCTGGAAAA-3' HindIII NotI
BMC Microbiology 2006, 6:86 http://www.biomedcentral.com/1471-2180/6/86
Fluorescence microscopy
Fluorescence microscopy was carried out by use of a Leitz DM RBE microscope fitted with filter cubes G/R, I3 and N2.1 (Leica Microsystems Heidelberg GmbH, Germany). Microscopic observations and image acquisitions were performed with a model TCS SP1 three channel scanning confocal laser microscope (Leica Microsystems Heidel-berg GmbH, Germany) equipped with an argon laser (458 nm, 476 nm, 488 nm and 514 nm wavelength) and two HeNe lasers (543 nm and 633 nm wavelength) and a var-iable spectrophometric detection system. The Leica Con-focal Sofware TCS SP/NT version 2.5.1347 was used.
Authors' contributions
JBA and ABL carried out the molecular constructions. JBA carried out the invasion assays and BBR did the micros-copy. BBC and TRL conceived of the study and partici-pated in its design and coordination. JBA and TRL drafted the manuscript. All authors red and approved the final manuscript.
Acknowledgements
The authors thank Grethe Fisher and Mansour Badaki for excellent techni-cal assistance. The Danish Research Council supported this work.
References
1. Farber JM, Peterkin PI: Listeria monocytogenes, a food-borne
pathogen. Microbiol Rev 1991, 55:476-511.
2. Low JC, Donachie W: A review of Listeria monocytogenes and
listeriosis. Vet J 1997, 153:9-29.
3. Larsen CN, Norrung B, Sommer HM, Jakobsen M: In Vitro and In
Vivo Invasiveness of Different Pulsed-Field Gel Electro-phoresis Types of Listeria monocytogenes. Appl Environ
Micro-biol 2002, 68:5698-5703.
4. Wiedmann M, Bruce JL, Keating C, Johnson AE, McDonough PL, Batt CA: Ribotypes and virulence gene polymorphisms suggest
three distinct Listeria monocytogenes lineages with differ-ences in pathogenic potential. Infect Immun 1997, 65:2707-2716.
5. Kim H, Boor KJ, Marquis H: Listeria monocytogenes {sigma}B
Contributes to Invasion of Human Intestinal Epithelial Cells.
Infect Immun 2004, 72:7374-7378.
6. Gaillard JL, Finlay BB: Effect of cell polarization and
differentia-tion on entry of Listeria monocytogenes into the enterocyte-like Caco-2 cell line. Infect Immun 1996, 64:1299-1308.
7. Sleator RD, Wemekamp-Kamphuis HH, Gahan CGM, Abee T, Hill C:
A PrfA-regulated bile exclusion system (BilE) is a novel viru-lence factor in <i>Listeria monocytogenes</i>. Molecular
Microbiology 2005, 55:1183-1195 [http://www.blackwell-synergy.com/
links/doi/10.1111/j.1365-2958.2004.04454.x/abs].
8. Valdivia RH, Hromockyj AE, Monack D, Ramakrishnan L, Falkow S:
Applications for green fluorescent protein (GFP) in the study of host-pathogen interactions. Gene 1996, 173:47-52.
9. Lun S, Willson PJ: Expression of green fluorescent protein and
its application in pathogenesis studies of serotype 2 Strepto-coccus suis. J Microbiol Methods 2004, 56:401-412.
10. Fortineau N, Trieu-Cuot P, Gaillot O, Pellegrini E, Berche P, Gaillard JL: Optimization of green fluorescent protein expression
vec-tors for in vitro and in vivo detection of Listeria monocy-togenes. Research in Microbiology 2000, 151:353-360.
11. Pentecost M, Otto G, Theriot JA, Amieva MR: Listeria
monocy-togenes Invades the Epithelial Junctions at Sites of Cell Extrusion. PLoS Pathog 2006, 2:e3.
12. Prasher DC, Eckenrode VK, Ward WW, Prendergast FG, Cormier MJ: Primary structure of the Aequorea victoria
green-fluo-rescent protein. Gene 1992, 111:229-233.
13. Gurskaya NG, Fradkov AF, Terskikh A, Matz MV, Labas YA, Martynov VI, Yanushevich YG, Lukyanov KA, Lukyanov SA: GFP-like
chromoproteins as a source of far-red fluorescent proteins.
FEBS Lett 2001, 507:16-20.
14. Baird GS, Zacharias DA, Tsien RY: Biochemistry, mutagenesis,
and oligomerization of DsRed, a red fluorescent protein from coral. Proc Natl Acad Sci U S A 2000, 97:11984-11989.
15. Gaillard JL, Berche P, Frehel C, Gouin E, Cossart P: Entry of L.
monocytogenes into cells is mediated by internalin, a repeat protein reminiscent of surface antigens from gram-positive cocci. Cell 1991, 65:1127-1141.
16. Olier M, Garmyn D, Rousseaux S, Lemaitre JP, Piveteau P, Guzzo J:
Truncated Internalin A and Asymptomatic Listeria monocy-togenes Carriage: In Vivo Investigation by Allelic Exchange.
Infect Immun 2005, 73:644-648.
17. Cossart P, Pizarro-Cerda J, Lecuit M: Invasion of mammalian cells
by Listeria monocytogenes: functional mimicry to subvert cellular functions. Trends Cell Biol 2003, 13:23-31.
18. Sambrook J, Fritsch EF, Maniatis T: Molecular Cloning - A Laboratory
Manual 2nd edition. Cold Spring Harbor Laboratory Press; 1989.
19. Scholz O, Thiel A, Hillen W, Niederweis M: Quantitative analysis
of gene expression with an improved green fluorescent pro-tein. p6. Eur J Biochem 2000, 267:1565-1570.
20. TaMaRa's staff website 2006 [http://www.necker.fr/tamara/pages/
ariel.html].
21. Trieu-Cuot P, Derlot E, Courvalin P: Enhanced conjugative
trans-fer of plasmid DNA from Escherichia coli to Staphylococcus aureus and Listeria monocytogenes. FEMS Microbiol Lett 1993, 109:19-23.
22. Horton RM, Cai ZL, Ho SN, Pease LR: Gene splicing by overlap
extension: tailor-made genes using the polymerase chain reaction. Biotechniques 1990, 8:528-535.
23. Nelson KE, Fouts DE, Mongodin EF, Ravel J, DeBoy RT, Kolonay JF, Rasko DA, Angiuoli SV, Gill SR, Paulsen IT, Peterson J, White O, Nel-son WC, Nierman W, Beanan MJ, Brinkac LM, Daugherty SC, DodNel-son RJ, Durkin AS, Madupu R, Haft DH, Selengut J, Van Aken S, Khouri H, Fedorova N, Forberger H, Tran B, Kathariou S, Wonderling LD, Uhlich GA, Bayles DO, Luchansky JB, Fraser CM: Whole genome
comparisons of serotype 4b and 1/2a strains of the food-borne pathogen Listeria monocytogenes reveal new insights into the core genome components of this species. Nucl Acids
Res 2004, 32:2386-2395.
24. Chakraborty T, Leimeister-Wachter M, Domann E, Hartl M, Goebel W, Nichterlein T, Notermans S: Coordinate regulation of
viru-lence genes in Listeria monocytogenes requires the product of the prfA gene. J Bacteriol 1992, 174:568-574.
25. Guzman CA, Rohde M, Chakraborty T, Domann E, Hudel M, Weh-land J, Timmis KN: Interaction of Listeria monocytogenes with
mouse dendritic cells. Infect Immun 1995, 63:3665-3673.
26. de LV, Timmis KN: Analysis and construction of stable
pheno-types in gram-negative bacteria with Tn5- and Tn10-derived minitransposons. Methods Enzymol 1994, 235:386-405.
27. Yanisch-Perron C, Vieira J, Messing J: Improved M13 phage
clon-ing vectors and host strains: nucleotide sequences of the M13mp18 and pUC19 vectors. Gene 1985, 33:103-119.
28. Glaser P, Frangeul L, Buchrieser C, Rusniok C, Amend A, Baquero F, Berche P, Bloecker H, Brandt P, Chakraborty T, Charbit A, Chetouani F, Couve E, de Daruvar A, Dehoux P, Domann E, Dominguez-Bernal G, Duchaud E, Durant L, Dussurget O, Entian KD, Fsihi H, Portillo FGD, Garrido P, Gautier L, Goebel W, Gomez-Lopez N, Hain T, Hauf J, Jackson D, Jones LM, Kaerst U, Kreft J, Kuhn M, Kunst F, Kurapkat G, Madueno E, Maitournam A, Vicente JM, Ng E, Nedjari H, Nordsiek G, Novella S, de Pablos B, Perez-Diaz JC, Purcell R, Remmel B, Rose M, Schlueter T, Simoes N, Tierrez A, Vazquez-Boland JA, Voss H, Wehland J, Cossart P: Comparative Genomics of Listeria
Spe-cies. Science 2001, 294:849-852.
29. Vicente MF, Baquero F, Perez-Diaz JC: Cloning and expression of
the Listeria monocytogenes haemolysin in Escherichia coli.
FEMS Microbiology Letters 1985, 30:77-79.
30. Olier M, Pierre F, Lemaitre JP, Divies C, Rousset A, Guzzo J:
Assess-ment of the pathogenic potential of two Listeria monocy-togenes human faecal carriage isolates. Microbiology 2002, 148:1855-1862.