HAL Id: hal-02540365
https://hal.archives-ouvertes.fr/hal-02540365
Submitted on 16 Apr 2021HAL is a multi-disciplinary open access archive for the deposit and dissemination of sci-entific research documents, whether they are pub-lished or not. The documents may come from teaching and research institutions in France or abroad, or from public or private research centers.
L’archive ouverte pluridisciplinaire HAL, est destinée au dépôt et à la diffusion de documents scientifiques de niveau recherche, publiés ou non, émanant des établissements d’enseignement et de recherche français ou étrangers, des laboratoires publics ou privés.
Substitutional carbon defects in silicon: A quantum
mechanical characterization through the infrared and
Raman spectra
Francesco Gentile, Alexander Platonenko, Khaled El-Kelany, Michel Rérat,
Philippe d’Arco, Roberto Dovesi
To cite this version:
Francesco Gentile, Alexander Platonenko, Khaled El-Kelany, Michel Rérat, Philippe d’Arco, et al.. Substitutional carbon defects in silicon: A quantum mechanical characterization through the in-frared and Raman spectra. Journal of Computational Chemistry, Wiley, 2020, 41 (17), pp.1638-1644. �10.1002/jcc.26206�. �hal-02540365�
Substitutional carbon defects in Silicon. A quantum
mechanical characterization through the IR and Raman
spectra.
Gentile F.S.
∗, Platonenko A.
†, El-Kelany K.E.
‡, R´
erat M.
§, D’arco P.
¶, Dovesi R.
kFebruary 10, 2020
Abstract
The Infrared and Raman spectra of eight substitutional carbon defects in silicon are computed at the quantum mechanical level by using a periodic supercell approach based on hybrid functionals, an all electron Gaussian type basis set and the Crystal code. The single substitutional Cs case and its combination with a vacancy (CsV and
CsSiV) are considered first. The progressive saturation of the four bonds of a Si atom
with C is then examined. The last set of defects consists of a chain of adjacent carbon atoms Cis, with i = 1 to 3. The simple substitutional case, Cs, is the common first
member of the three sets. All these defects show important, very characteristic features in their IR spectrum. One or two C related peaks dominate the spectra: at 596 cm−1 for Cs (and CsSiV, the second neighbor vacancy is not shifting the Cs peak), at 705
and 716 cm−1 for CsV, at 537 cm−1 for C2s and C3s (with additional peaks at 522, 655
and 689 for the latter only), at 607 and 624 cm−1, 601 and 643 cm−1and 629 cm−1 for SiC2s, SiC3s, SiC4s, respectively. Comparison with experiment allows to attribute many observed peaks to one of the C substitutional defects. Observed peaks above 720 cm−1 must be attributed to interstitial C or more complicated defects.
Keywords: Silicon, substitutional carbon defect, Ab-initio calculation, IR and Raman spectra.
∗Dipartimento di Chimica, Universit`a di Torino and NIS (Nanostructured Interfaces and Surfaces) Centre,
Via P. Giuria 5, 10125 Torino, Italy
†Institute of Solid State Physics, University of Latvia, 8 Kengaraga street, LV1063, Riga, Latvia
‡Institute of Nanoscience and Nanotechnology, Kafrelshiekh University, 33516 Kafrelskiekh, Egypt
§Universit´e de Pau et des Pays de l’Adour, E2S UPPA, CNRS, IPREM, 2 av. pr´esident P. Angot, Pau
64053, France
¶Sorbonne Universit´es, UPMC Paris 06, UMR 7193, Institut des Sciences de la Terre Paris (ISTeP), 4
place Jussieu, F-75005 Paris, France
kDipartimento di Chimica, Universit`a di Torino and NIS (Nanostructured Interfaces and Surfaces) Centre,
-200 0 200400600800 1000 1200 1400 1600 1800 0 200 400 600 800 1000 C A C 0 200 400 600 800 0 20 40 60 80 B A B
The Infrared and Raman spectra of eight substitutional carbon defects in silicon are com-puted at the quantum mechanical level by using a periodic supercell approach based on hybrid functionals and all electron Gaussian type basis set. All these defects show impor-tant, very characteristic features in their vibrational spectrum. Comparison with experiment allows to attribute many observed peaks to one of the C substitutional defects.
INTRODUCTION
Electronic and mechanical properties of silicon are known to be significantly affected by the presence of impurities and defects. Carbon, along with oxygen, represents one of the most common impurity. Carbon is substitutionally dissolved as isovalent impurity and can in-teract with other point defects. It was found that implantation-generated excess of silicon self-interstitials after boron implantation is greatly reduced in the presence of carbon1.
Car-bon substitutional is considered immobile2 and characterized by single vibrational mode at 608 cm−1, while carbon interstitial is highly mobile3. Carbon substitutional reacts with
sili-con self-interstitials, producing a new carbon interstitial defect. EPR measurements suggest that this defect has C2v symmetry and a doublet electronic ground state.
In the present study we investigate eight defects in silicon, limiting the analysis to substitu-tional carbon. The aim is to explore whether the IR and/or Raman spectra provide enough information for the clear identification of the most important of these defects. As these defects are EPR inactive (they have a closed shell ground state, or the most stable state is a singlet, as for the two here considered that couple Cs and V, a vacancy), the vibrational
analysis is the most general tool available for this characterization. The extension to defects involving interstitial carbon, possibly in combination with N or O will be the object of a forthcoming paper4.
The eight investigated defects can be grouped in three sets, the first one includes the simple substitutional Cs defect, and its perturbed cases CsV and CsSiV, in which Cs is a first or
second neighbor of a vacancy. The second set includes 4 cases, to be indicated as SiCis, with i=1 to 4, in which the four neighbors of a Si atom are progressively substituted by C atoms. The third set includes three defects, Cis, with i=1 to 3, in which a chain of adjacent carbon atoms has been taken into account.
The supercell scheme (cubic supercells containing 64 and 216 atoms will be considered), the very effective hybrid B3LYP5,6 functional, an all electron Gaussian type basis set and the Crystal code have been used. As outlined previously7–12, the B3LYP hybrid functional, with 20% non-local exact exchange, leads to a proper description of (electronic) spin
polar-ization, and accurate vibrational spectra.
The paper is structured as follows. Section METHODOLOGY contains the details of the computational procedures and conditions. Section RESULTS describes the geometry, the charge and spin (when applies) density, and the vibrational features of the eight defects. In Section DISCUSSION the results are discussed and compared with experiments. A few con-clusions are drawn in section CONCLUSIONS. A Supplementary Material Section contains some of the technical details concerning the vibrational part, and shows the Raman spectra of the eight defects.
METHODOLOGY
Calculations have been performed by use of the B3LYP global hybrid functional,5,6 as
imple-mented in the Crystal17 rogram.13 An all electron Gaussian type basis set (derived from
Pople’s standard 6-31G14) as described in D’Arco et al.15 has been adopted for silicon: the
contraction is 6-5111G* (22 atomic orbitals, AOs), where the first shell is of s type, followed by 4 sp and one d shell; the exponents of the two outermost sp shells have been set to 0.45 Bohr−2 and 0.15 Bohr−2 , respectively. For the carbon atom, the 6-31G*16 contraction has
been adopted without modifications (14 AOs both).
The truncation of the Coulomb and exchange infinite lattice series is controlled by five thresholds Ti (see Crystal manual, Ref. 17, for more details), which have been set to 8
(T1-T4) and 16 (T5). The convergence threshold on energy for the self-consistent-field (SCF)
procedure has been set to 10−8 and 10−11 Eh for the structural and frequency calculations,
respectively.
The DFT exchange-correlation contribution to the Fock matrix has been evaluated by nu-merical integration over the unit cell volume. Radial and angular points for the integration grid are generated through Gauss-Legendre radial quadrature and Lebedev two-dimensional angular point distributions. The default pruned grid with 74 radial and 974 angular points has been used.
super-cells containing 64 and 216 atoms have been considered (to be referred to in the fol-lowing as Sn, with n= 64 or 216). They correspond to the expansion of the bulk silicon
conventional cell, containing 8 atoms, by a factor 2 and 3 along the three lattice parameters. The defects reduce the symmetry; the deformation of the cell from the cubic shape is how-ever negligible. Overall, the size of the basis set (number of AOs) is (about) 1400 in S64 and
(about) 4744 in S216. Reciprocal space has been sampled by using a regular sub-lattice with
a shrinking factor 4 for S64 and 2 for S216; this corresponds to a number of k-points ranging
from 4 to 36, according to the point symmetry of the defective system.
The experimental Raman spectrum of pristine silicon18 is characterized by a single, three
fold degenerate, peak at 521 cm−1. The calculated peak with the present functional and basis set is at 533 cm−1, 12 cm−1 above. So any observed IR signal or any Raman peak other than the one at 521 cm−1 must be attributed to defects.
As the mass of carbon is less than half the one of silicon (12.01 vs 28.09 u), we can anticipate that many of the modes to which C contributes will appear well above the phonon band of pristine silicon, that has a calculated higher limit at 533 cm−1. Besides that, the C-Si bonds are polar (typical electronegativity values are 1.9 for Si and 2.6 for C); as a consequence, the IR defect peaks are expected to be very intense, and to dominate the spectrum.
The identification of the nature of the modes (which atom is contributing? what kind of movement is described by the mode?) can easily be performed through two tools imple-mented in the CRYSTAL code:
a) the isotopic shift (see the note following eq. 1 in the Supplementary Material Section ); at negligible cost the mass of a subset of atoms can be altered arbitrarily. Note that at variance with respect to experiment, i) only very particular atoms of the cell can be involved in the isotopic substitution; ii) it is not necessary that the attributed mass corresponds to an existing isotope. Very large masses can be attributed to atoms in order to magnify the mass effect.
b) the graphical animation of the modes. This permits to have a direct and clear evidence of the atoms and groups providing important contributions to the eigenvectors; it is available at www.crystal.unito.it in the Defects in Silicon section.
RESULTS
In this section we consider eight defects containing substitutional carbon, organized in three series.
The first series contains the isolated substitutional carbon, Cs, and the combination of Cs
with a vacancy V: CsSiV, when C is a second neighbor of V, and CsV, when Cs is sitting on
the border of V. The ground state of Cs is a singlet closed shell, whereas in the two other
cases the four first neighbors of the vacancy carry a uncoupled electron, so that a quintuplet q (Sz=2), a triplet t (Sz=1) and a singlet s (Sz=0) spin states are possible. The singlet is
more stable than the triplet by 0.10 (CsSiV) and 0.72 eV (CsV), respectively. The q state
is less stable than the triplet (see Table 2).
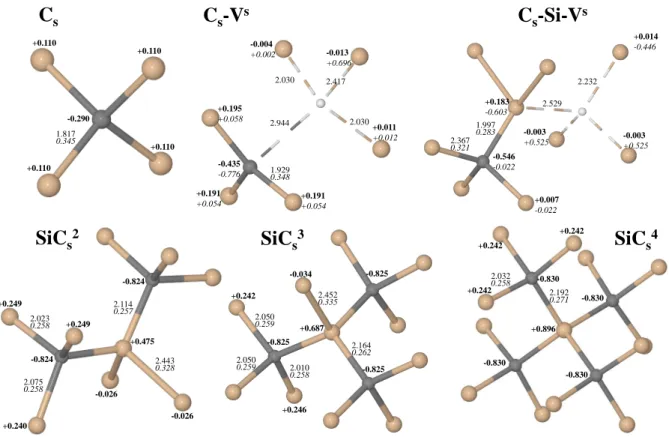
In Figure 1, top, these three defects are schematically represented, with atom-atom distances R and Mulliken charges q and bond populations b. The electronegativity of C is larger than the Si one (2.6 vs 1.9), so that the Mulliken net charge q of C is −0.29 |e| in Cs; it increases
(in absolute value) to −0.44 and −0.55 |e| in the two defects including the vacancy. The R distances, that are 1.56 ˚A in pristine diamond and 2.57 ˚A in silicon, are in between these values for the various C-Si distances. The bond populations b are intermediate between the ones of diamond and silicon.
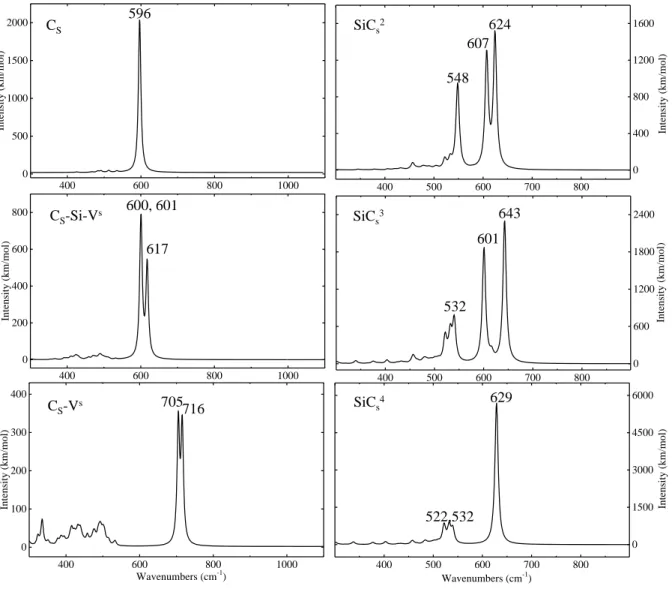
The IR spectrum of Cs is very simple (see Figure 3, left). It is dominated by a single peak
at 596 cm−1, whose intensity is 2015 km/mol. In CsSiV the peak splits in three, and blue
shifts by a few cm−1 (600, 601 and 617 cm−1); the sum of the intensities of the three peaks is about the same as the one of Cs. When carbon is on the border of the vacancy, the shift is
larger (more than 100 cm−1). The lower symmetry splits the single peak of Cs in two peaks
at close wavenumbers, 705 and 716 cm−1, with a much smaller intensity.
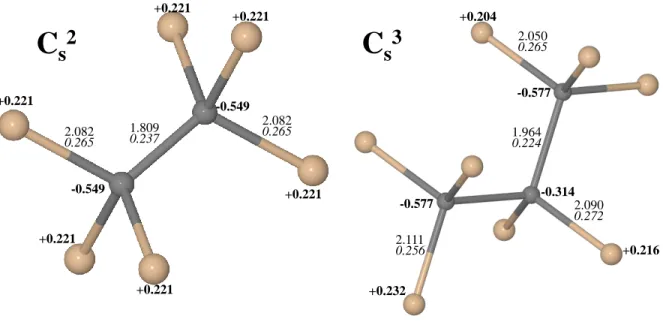
The second series includes Cs, C2s and C3s, a chain of 1 to 3 adjacent substitutional carbon
atoms. The ground state is always a closed shell; charges and distances are shown in Figure 1, second row. The carbon net charge is as high as −0.55 and −0.58 |e| in C2
s, and in C3s
larger than in diamond (1.81 and 1.97 ˚A in the double and triple substitutional case), due to the rigidity of the bulk Si lattice.
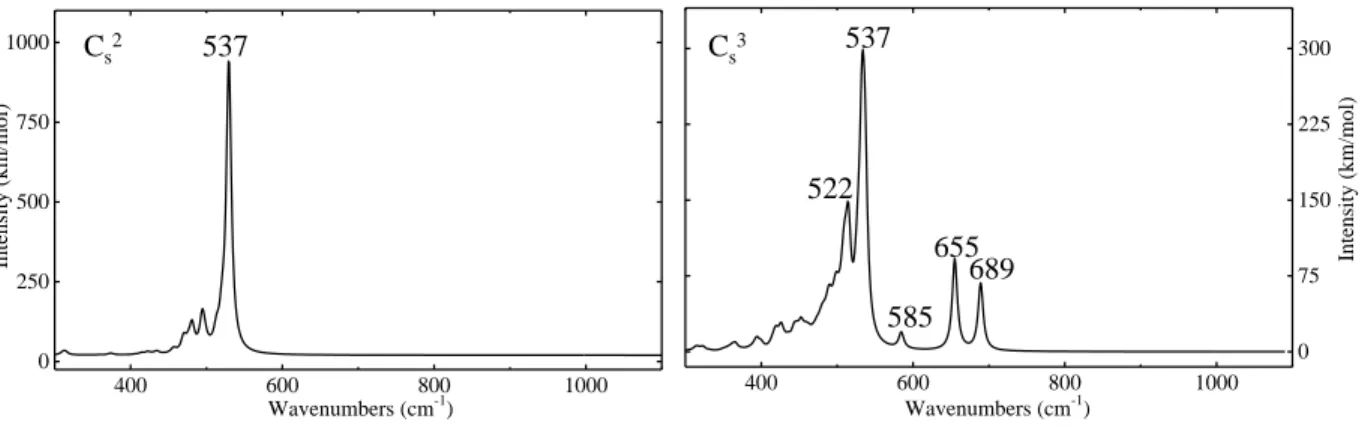
As regards the IR spectrum, in C2s and C3s the 596 cm−1 Cs peak red shifts by 60 cm−1 to
537 cm−1. In C3
s, three additional peaks of lower intensity appear at 585 (11 cm
−1 below the
Cs peak), 655 and 689 cm−1.
The former corresponds to a C-C stretching, the latter to the C-Si stretching of the cen-tral carbon atom, as the graphical animation of teh modes confirms. The 585 cm−1 mode corresponds to C-Si stretching of two outer carbon atoms. The C-Si peak is absent in C2 s
for symmetry reasons. It appears on the contrary in the Raman spectrum, see the Supple-mentary Material, Figure S1). The mode at 651 cm−1 corresponds to the asymmetric C-Si stretching.
The third series includes SiC1
s ≡ Cs, SiC2s, SiC3s and SiC4s (second row in Figure 1),
corre-sponding to substitute one, two, three and four neighbors of a central silicon atom. The carbon net charge, that in Cs is -0.290 |e|, and is more than compensated by the four Si
atoms (+0.110 |e|), jumps to -0.824, -0.825 and -0.896 |e| in the three other cases, whereas the central Si atom has a net charge of +0.475, +0.687 and +0.896 |e|. The net charge of the ”external” Si atoms is constant at about +0.240 |e| for the three cases. The Si-C bond population reduces from +0.34 |e| for Cs to about +0.26 |e| for the three other cases, as a
consequence of the increased distance between the central Si atom and its neighbors from 1.82 to 2.11, 2.16 and 2.19 ˚A along the series.
The IR spectrum of the three SiCxs defects, with x =2 to 4, is shown in Figure 3, right column. The peak at 596 cm−1 of Cs splits in two peaks at 607 and 624 cm−1 (SiC2s), and
at 601 and 643 cm−1 (SiC3s), by effect of the reduced symmetry (C2v and C3v, respectively).
In SiC4
s a single peak (symmetry is Td) at 629 cm−1 dominates the spectrum, intermediate
between the two peaks of SiC2s and SiC3s. The isotopic substitution 12C → 13C red shifts these peaks by 18-20 cm−1, confirming that they are related to carbon. Less intense peaks in the range 520-548 cm−1 appear in the 3 cases. Their isotopic shift is only 3-5 cm−1 large, indicating that they are due to the perturbation of the Si lattice around the defect, rather than being directly connected to C.
The defect formation energies Ef were calculated according to the following equation:
Ef = (ED− n ∗ EC) − (EP − m ∗ ESi) (1)
where ED and EP are the total energies of the defective (D) and pristine (P ) silicon supercells
(S64 or S216), n and m are the numbers of carbon atoms added to, or silicon atoms removed
from, the defective supercells. Formation energies for all studied defects are reported in Table 2. ESi is the total energy of the silicon atom in the pristine silicon structure (that is, half the
electronic total energy of the primitive cell, that with the present basis set and functional is −289.46807 Eh per atom). As regards the definition of EC, we have followed two different
approaches, denoted by superscripts 1 and 2. In the first one (E1f), EC is obtained in a
similar way from pristine diamond (−38.08851046 Eh per atom). In the second definition,
E2f is the energy of an isolated carbon atom. The difference between the two is obviously nothing else than the binding energy of the diamond crystal.
E1f for Cs is 1.5 eV. The one of C2s is not twice the one of Cs, but about three times, and
three more eV are necessary to create C3
s. This discontinuity is confirmed by a parallel
discontinuity in the CsSi distances, and Cs net charges.
If we compare the two systems with two or three C atoms, the table shows that localizing the perturbation around a single Si atom is strongly favoured: 3.11 (SiC2s) vs 4.57 (C2s) eV, and 4.84 (SiC3
s) vs 7.71 (C3s) eV. Looking at the SiCis series, the progressive insertion of one,
two, three and four C atoms requires 1.5, 1.61, 1.73 and 1.68 eV. We considered also the formation energy of C-Si-Si-C, when the two carbon atoms are linked to two first neighbors silicon atoms. The E1f formation energy is 3.88 eV, much lower than the C2s one (4.57 eV) but much higher that the SiC2
s one (3.11 eV). It is clear that if n carbon atoms are present
in bulk silicon, they will tend to aggregate.
The formation energy of a single silicon vacancy obtained from our model is about 4.7 eV (the experimental estimated value is 4.0 eV19). E1f for CsSiV is 6.52 eV, slightly larger (0.32
eV) than the sum of the formation energy of the two defects (4.7 +1.5 =6.2 eV). E1
f of CsV
DISCUSSION
Associating an experimental IR, Raman or EPR signal to a specific defect is challenging and, very often, controversial. In this section we try to connect the microscopic structure of defects to experiments comparing calculated and measured IR spectra.
In 1965 Newman2 published the IR spectrum of carbon doped monocrystalline silicon. The spectra collected at 290 K were characterized by a single peak at 608 cm−1. For a sample containing both 12C and an increased percentage of 13C, two peaks at 604 and 586 cm−1 were observed; the second one was attributed to 13C, with an isotopic shift of 18 cm−1.
The dominant peak in our simulated spectrum of Cs is at 596 cm−1, that downshifts by 18
cm−1 to 578 cm−1 when13C is used instead of12C (see Table 1). The present scheme (B3LYP
plus the basis set described in the computational section) underestimates the dominant Raman peak of perfect bulk silicon by 12 cm−1 (from 533 to 521 cm−1). It is reasonable to suppose that a similar underestimation is affecting the spectra of the defective systems. Taking into account this red shift, it can be concluded that the peaks observed by Newman can be attributed to a single carbon substitutional defect, Cs.
In the same experiment two more modes were observed when collecting spectra at 63 K. For
12C plus 13C doped samples, absorption bands at 1217 and 1175 cm−1 with much smaller
intensities were attributed to possible second harmonics of the local mode vibrations. We are collecting some evidences that interstitial carbon defects could be, alternatively, responsible for these peaks4.
In 1970 Bean et al.20 reported a large list of modes that could be associated to oxygen and carbon defects or their complexes. For samples containing only carbon, four low intensity modes in the range from 528 cm−1 to 552 cm−1were reported, without attribution to specific local structures.
Our calculated IR spectrum of the C2s defect (two vicinal substitutional carbon atoms, see figure 4), is dominated by a single peak at 537 cm−1, well within the range of the peaks reported by Bean et al.. Other C substitutional defects show peaks in the 528-552 cm−1 range: C3
s, with the two dominant peaks at 537 (as for C2s) and 527 cm
−1; SiC3
s and SiC4s
SiC3s and SiC4s also the dominant peaks at 601 and 643 cm−1 for the first, and at 629 cm−1 for the second, should appear in the experimental spectrum. So the C2
s and C3s defects are
the best candidates for the attribution of these experimental peaks.
Bean et al.20 reports also about a broad band in the range 704-735 cm−1. The authors
suggest that this band could be related to C-V centers. Inspection of figures 3 and 4 shows that all C substitutional defects present peaks below 690 cm−1, the exception being CsV,
a carbon first neighbor of a vacancy, that in its singlet state (the most stable), has two dominant peaks at 705 and 716 cm−1. We can then confirm the attribution by Bean et al..
CONCLUSIONS
The IR and Raman spectra, as well as the local geometry, the charge and spin (when applies) distribution of eight substitutional carbon defects are produced. The Raman spectrum is in all cases dominated by a peak at 530 cm−1, corresponding to the only peak of pristine bulk silicon. The landscape of the IR spectra is much more varied, and allows in most of the cases a clear identification of the specific defect. Cs has a single very intense peak at 596 cm−1,
whereas CsV is the only one with peaks above 700 cm−1 (705 and 716 cm−1).
With respect to Cs, the SiCis defects blue shift to 607 and 624 cm
−1, and red shift to 548
cm−1 (SiC2
s), blue shift to 601 and 643 cm
−1 (SiC3 s), or to 629 cm −1 (SiC4 s), whereas C2s) and C3 s) red shift to 523-533 cm
−1. The IR spectrum is then able to characterize all these defects.
The most relevant experimental peaks have been attributed to some of these defects. Peaks above 720 cm−1 are most probably attributable to interstitial C defects that will be the object of a forthcoming investigation.
The present study confirms that modern, high quality quantum-mechanical computer codes are extremely useful tools for the analysis of the properties of defects in crystalline com-pounds. They can be considered as standard tools, that complement in many cases, and substitute in others, experimental investigations, when the latter are difficult, or very ex-pensive, or unable to discriminate between different hypotheses.
ACKNOWLEDGMENTS
Access to the HPC resources of CINES/IDRIS/TGCC obtained thanks to the grant 2018-[A0050810537] (Ph. D’Arco) made by GENCI is warmly acknowledged.
References
1. P. Stolk, H.-J. Gossmann, D. Eaglesham, D. Jacobson, C. Rafferty, G. Gilmer, M. Jaraiz, J. Poate, H. Luftman, and T. Haynes, Journal of Applied Physics 81, 6031 (1997).
2. R. Newman and J. Willis, Journal of physics and chemistry of solids 26, 373 (1965).
3. R. a. Pinacho, P. Castrillo, M. Jaraiz, I. Martin-Bragado, J. Barbolla, H.-J. Gossmann, G.-H. Gilmer, and J.-L. Benton, Journal of Applied Physics 92, 1582 (2002).
4. F. S. Gentile, A. Platonenko, and R. Dovesi, in preparation (2020).
5. A. D. Becke, J. Chem. Phys. 98, 5648 (1993).
6. C. Lee, W. Yang, and R. Parr, Phys. Rev. B 37, 785 (1988).
7. L. Bjaalie, A. Janotti, K. Krishnaswamy, and C. G. Van de Walle, Phys. Rev. B 93, 115316 (2016).
8. M. Gerosa, C. Di Valentin, C. E. Bottani, G. Onida, and G. Pacchioni, J. Chem. Phys. 143, 111103 (2015).
9. M. Gerosa, C. E. Bottani, L. Caramella, G. Onida, C. Di Valentin, and G. Pacchioni, J. Chem. Phys. 143, 134702 (2015).
10. I. d. P. R. Moreira and R. Dovesi, Int. J. Quantum Chem. 99, 805 (2004).
11. D. Munoz, N. M. Harrison, and F. Illas, Phys. Rev. B 69, 085115 1 (2004).
12. J. C. Wojde l, I. de P. R. de Moreira, S. T. Bromley, and F. Illas, J. Chem. Phys. 128, 044713 1 (2008).
13. R. Dovesi, R. Orlando, A. Erba, C. M. Zicovich-Wilson, B. Civalleri, S. Casassa, L. Mas-chio, M. Ferrabone, M. D. L. Pierre, P. D’Arco, et al., Int. J. Quantum Chem. 114, 1287 (2014).
14. M. M. Francl, W. J. Pietro, W. J. Hehre, J. S. Binkley, M. S. Gordon, D. J. DeFrees, and J. A. Pople, The Journal of Chemical Physics 77, 3654 (1982).
15. P. D’Arco, G. Sandrone, R. Dovesi, R. Orlando, and V. Saunders, Physics and Chemistry of Minerals 20, 407 (1993).
16. M. M. Francl, W. J. Petro, W. J. Hehre, J. S. Binkley, M. S. Gordon, D. J. DeFrees, and J. A. Pople, J. Chem. Phys. 77, 3654 (1982).
17. R. Dovesi, V. R. Saunders, C. Roetti, R. Orlando, C. M. Zicovich-Wilson, F. Pascale, B. Civalleri, K. Doll, N. M. Harrison, I. J. Bush, et al., CRYSTAL 2014 User’s Manual, (University of Torino, Torino, 2013).
18. J. H. Parker, D. W. Feldman, and M. Ashkin, Phys. Rev. 155, 712 (1967), URL https://link.aps.org/doi/10.1103/PhysRev.155.712.
19. N. Fukata, A. Kasuya, and M. Suezawa, Japanese Journal of Applied Physics 40, L854 (2001).
20. A. Bean, R. Newman, and R. Smith, Journal of Physics and Chemistry of Solids 31, 739 (1970).
1.817 0.345 -0.290 +0.110 +0.110 +0.110 +0.110
C
s -0.549 -0.549 1.809 0.237 2.082 0.265 2.082 0.265 +0.221 +0.221 +0.221 +0.221 +0.221 +0.221C
s2 -0.314 -0.577 -0.577 2.090 0.272 1.964 0.224 +0.216 2.050 0.265 2.111 0.256 +0.204 +0.232C
s3 2.944 1.929 0.348 2.030 +0.191 +0.054 -0.435 -0.776 -0.004 +0.002 -0.013 +0.696 2.030 2.417 +0.011 +0.012 +0.191 +0.054 +0.195 +0.058 2.529 2.232 -0.546 -0.022 1.997 0.283 2.367 0.321 +0.007 -0.022 +0.183 -0.603 -0.003 +0.525 -0.003+0.525 +0.014 -0.446C
s-V
sC
s-Si-V
sSiC
s2SiC
s3SiC
s4 -0.034 2.050 0.259 2.164 0.262 2.452 0.335 2.010 0.258 -0.825 +0.687 +0.896 2.050 0.259 +0.242 +0.246 -0.825 -0.825 +0.475 -0.026 -0.026 +0.249 +0.249 +0.240 -0.824 -0.824 2.114 0.257 2.443 0.328 2.023 0.258 2.075 0.258 2.192 0.271 2.032 0.258 +0.242 +0.242 +0.242 -0.830 -0.830 -0.830 -0.830Figure 1: The local cluster around the substitutional carbon and vacancy defects here con-sidered. Bond lengths (in ˚A), Mulliken net charges (in |e| and bold) and bond populations (in |e| and italic) are reported for nearest non equivalent atoms. Superscript s indicates an open shell singlet. Carbon atoms are in grey, the vacancy position is identified by the white circle.
1.817 0.345 -0.290 +0.110 +0.110 +0.110 +0.110
C
s
-0.549 -0.549 1.809 0.237 2.082 0.265 2.082 0.265 +0.221 +0.221 +0.221 +0.221 +0.221 +0.221C
s
2
-0.314 -0.577 -0.577 2.090 0.272 1.964 0.224 +0.216 2.050 0.265 2.111 0.256 +0.204 +0.232C
s
3
2.944 1.929 0.348 2.030 +0.191 +0.054 -0.435 -0.776 -0.004 +0.002 -0.013 +0.696 2.030 2.417 +0.011 +0.012 +0.191 +0.054 +0.195 +0.058 2.529 2.232 -0.546 -0.022 1.997 0.283 2.367 0.321 +0.007 -0.022 +0.183 -0.603 -0.003 +0.525 -0.003+0.525 +0.014 -0.446C
s
-V
s
C
s
-Si-V
s
SiC
s
2
SiC
s
3
SiC
s
4
-0.034 2.050 0.259 2.164 0.262 2.452 0.335 2.010 0.258 -0.825 +0.687 +0.896 2.050 0.259 +0.242 +0.246 -0.825 -0.825 +0.475 -0.026 -0.026 +0.249 +0.249 +0.240 -0.824 -0.824 2.114 0.257 2.443 0.328 2.023 0.258 2.075 0.258 2.192 0.271 2.032 0.258 +0.242 +0.242 +0.242 -0.830 -0.830 -0.830 -0.830Figure 2: The local cluster around the Cx
s defects here considered. Bond lengths (in ˚A),
Mulliken net charges (in |e| and bold) and bond populations (in |e| and italic) are reported for nearest non equivalent atoms. Carbon atoms are in grey.
400 600 800 1000 0 500 1000 1500 2000 Intensit y (km/m ol) CS 596 400 600 800 1000 0 100 200 300 400 Wavenumbers (cm-1 ) Intensit y (km/m ol) 716 705 400 600 800 1000 0 200 400 600 800 Intensit y (km/m ol) 617 600, 601 CS-Vs CS-Si-Vs 400 500 600 700 800 0 400 800 1200 1600 Intensit y (km/m ol) 400 500 600 700 800 0 600 1200 1800 2400 Intensit y (km/m ol) 400 500 600 700 800 0 1500 3000 4500 6000 Intensit y (km/m ol) Wavenumbers (cm-1) SiCs2 SiCs3 SiCs4 629 522,532 643 601 532 624 607 548
Figure 3: Simulated IR spectra of carbon substitutional defects. s superscript correspond to the singlet solution. In all other cases the solution is a closed shell.
400 600 800 1000 0 250 500 750 1000 Intensit y (km/m ol) Wavenumbers (cm-1) 400 600 800 1000 0 250 500 750 1000 Intensit y (km/m ol) Cs2 75 150 225 300 Intensit y (km/m ol) 537 400 600 800 1000 0 75 150 225 300 Wavenumbers (cm-1) Intensit y (km/m ol) 689 655 585 537 522 Cs3
Figure 4: Simulated IR spectra of Cx
s carbon substitutional defects.
Defect Sym ν(12C) →ν (13C), δ; (intensity) Cs Td 596→578, 18 (2015) (Cs-Si-V)s Cs 617→598, 19 (791); 601→583, 18 (632); 600→582, 18 (615) (Cs-V)s Cs 716→693, 23 (344); 705→683, 22 (355) C2 s C3v 651→628, 23 (R); 544→543, 1 (R); 537→537 0(941) C3 s C2v 689→664, 25 (144); 655→631, 24 (196); 612→592, 20 (R); 585→567, 8 (25); 537→536, 1 (299) SiC2 s C2v 624→605,19 (1522); 612→592, 20 (R); 1294, 548→540, 8 (943) SiC3 s C3v 642→623,19 (2298); 601→582, 19 (1850); 540→535, 5 (653) SiC4 s Td 629→609,20 (5692); 540→537, 3 (559)
Table 1: Wavenumber shift δ (in cm−1 due to the 12C → 13C isotopic substitution) of the
most intense IR modes. The absolute intensities (in km/mol) are also reported. A semicolon separates the information concerning one mode from the one of another mode.
Method ED E1f (eV) E2f (eV)
(Ha) s t Q s t Q Cs −18274.52383 1.50 −6.55 Cs-Si-V −17984.83849 6.52 6.61 7.42 −1.54 −1.44 −0.64 Cs-V −17984.85291 6.19 6.92 7.02 −1.86 −1.14 −1.03 C2 s −18023.03141 4.57 −11.53 C3s(S216) −61770.68856 7.71 −16.45 SiC2 s (S216) −62022.23700 3.11 −12.99 SiC3s (S216) −61770.79382 4.84 −19.31 SiC4s (S216) −61519.35278 6.52 −25.69
Table 2: Total (ED, in Eh) and formation E1f (in eV) energy of the substitutional defects in
silicon (see equation 1), computed with reference to pristine diamond and silicon bulk, and to the isolated carbon atom. The S64 supercell has been used for the first four defects, S216
for the more extended defects, as indicated.