HAL Id: hal-00296770
https://hal.archives-ouvertes.fr/hal-00296770
Submitted on 6 Jun 2006
HAL is a multi-disciplinary open access
archive for the deposit and dissemination of
sci-entific research documents, whether they are
pub-lished or not. The documents may come from
teaching and research institutions in France or
abroad, or from public or private research centers.
L’archive ouverte pluridisciplinaire HAL, est
destinée au dépôt et à la diffusion de documents
scientifiques de niveau recherche, publiés ou non,
émanant des établissements d’enseignement et de
recherche français ou étrangers, des laboratoires
publics ou privés.
Data access and analysis with distributed federated data
servers in climateprediction.net
N. Massey, T. Aina, M. Allen, C. Christensen, D. Frame, D. Goodman, J.
Kettleborough, A. Martin, S. Pascoe, D. Stainforth
To cite this version:
N. Massey, T. Aina, M. Allen, C. Christensen, D. Frame, et al.. Data access and analysis with
distributed federated data servers in climateprediction.net. Advances in Geosciences, European
Geo-sciences Union, 2006, 8, pp.49-56. �hal-00296770�
www.adv-geosci.net/8/49/2006/
© Author(s) 2006. This work is licensed under a Creative Commons License.
Advances in
Geosciences
Data access and analysis with distributed federated data servers in
climateprediction.net
N. Massey1,2, T. Aina2, M. Allen2, C. Christensen2, D. Frame2, D. Goodman1, J. Kettleborough3,4, A. Martin1, S. Pascoe3, and D. Stainforth2
1Oxford University Computing Laboratory, Wolfson Building, Parks Road, Oxford, OX1 3QD, UK
2Atmospheric, Oceanic and Planetary Physics, Oxford University Clarendon Laboratory, Parks Road, Oxford, OX1 3PU, UK 3The British Atmospheric Data Centre, Space Science and Technology Department, CCLRC Rutherford Appleton
Laboratory, Fermi Avenue, Chilton, Didcot, Oxon, OX11 0QX, UK
4The Met Office, Fitzroy Road, Exeter, Devon, EX1 3PB, UK
Received: 15 November 2005 – Revised: 26 January 2006 – Accepted: 5 March 2006 – Published: 6 June 2006
Abstract. climateprediction.net is a large public resource
distributed scientific computing project. Members of the public download and run a full-scale climate model, donate their computing time to a large perturbed physics ensemble experiment to forecast the climate in the 21st century and submit their results back to the project. The amount of data generated is large, consisting of tens of thousands of individ-ual runs each in the order of tens of megabytes. The overall dataset is, therefore, in the order of terabytes. Access and analysis of the data is further complicated by the reliance on donated, distributed, federated data servers. This paper will discuss the problems encountered when the data required for even a simple analysis is spread across several servers and how webservice technology can be used; how different user interfaces with varying levels of complexity and flexibility can be presented to the application scientists, how using ex-isting web technologies such as HTTP, SOAP, XML, HTML and CGI can engender the reuse of code across interfaces; and how application scientists can be notified of their analy-sis’ progress and results in an asynchronous architecture.
1 Introduction
The models used to predict 21st century climate change in-herently possess uncertainty (Allen et al., 2002). Causes can be that a certain model does not accurately represent a phys-ical process or the parameterization schemes used to repre-sent small-scale processes are not accurately constrained. By varying model parameter values across a large ensemble of Correspondence to: N. Massey
climate simulations, the uncertainty due to the parameteriza-tion schemes can be investigated. climatepredicparameteriza-tion.net is a large public resource distributed scientific computing project in the vein of SETI@home (http://setiathome.berkeley.edu). Donated home PC computing time is used to explore the ef-fect of varying model parameters on a full-resolution, state-of-the-art general circulation model (GCM). This type of dis-tributed computing allows the scanning range of model pa-rameters to be much larger than that possible with traditional computing or supercomputing. This reduces the risk of over fitting models to observations and increases the predictive skill when using the model for simulations that cannot be constrained by observation. By analysing many members of the ensemble, a probabilistic view of the response of the cli-mate system to external forcing can be obtained (Stainforth et al., 2005).
1.1 The model
The model used in the climateprediction.net project is a ver-sion of the Met Office Unified Model. It consists of an atmo-spheric model, HADAM3, at standard resolution (3.75 longi-tude, 2.75 latilongi-tude, 19 vertical levels) but with increased nu-merical stability. This is coupled to a mixed-layer ocean con-sisting of a single thermodynamic layer with heat transport facilitated by a heat flux convergence field which changes with position and season but has no inter-annual variability. 1.2 Public resource computing
Members of the public are invited to participate in the project by donating their idle computing time. They download an executable version of the model and are then allocated a par-ticular set of parameter perturbations and initial conditions.
50 N. Massey et al.: Federated data servers in climate prediction.net Their PC then computes the simulation and uploads the result
to one of the project’s file servers. They can then be allocated another set of parameters to compute, uploading the results when that simulation is complete and so on.
There are currently around 40 000 simulations running on members PCs. To date, over 140 000 individual simulations have been downloaded, computed and the results uploaded. This equates to over 10 million simulated years of climate. 1.3 Experimental strategy
Each simulation (model + parameter perturbations and initial conditions) downloaded by a user is one member of the en-semble. Each simulation is run in three phases, each phase lasting 15 model years:
The first phase is the calibration phase where the simula-tion attains numerical stability and the heat flux convergence field is calculated while the sea surface temperatures (SSTs) are fixed.
The second phase is the control phase. The SSTs are al-lowed to vary due to changes in the atmosphere-ocean flux. The level of CO2 is held constant at pre-industrial levels
(282 ppm).
In the third phase, the level of CO2 is doubled and the
SSTs are allowed to vary. 1.4 Public outreach
The project needs vast computing resources to carry out the parameter perturbations. The only way to do this is to use public resource distributed computing, therefore the project is dependant on the public. Each simulation can take up to four weeks, even on a modern PC. To encourage and main-tain interest in the project, several incentives are offered. The first of these is the graphical visualisation of the earth that the user can see while their model is running. A more advanced visualisation is also available, allowing the user to retrospec-tively view the state of their model through its entire run and plot graphs of model output such as temperature or precipi-tation. Secondly, users are allocated “credits” for their com-puting time. This encourages friendly rivalry between users and teams. There is also a well developed web site offering educational material and forums.
Thirdly, a short course in climate prediction will be start-ing shortly, run by the Open University in the UK.
Finally, there is a school’s programme for teaching climate prediction, risk and uncertainty to primary and secondary school children, also available from the website.
2 The client
In order to participate in the project, members of the public must download and install client software. cli-mateprediction.net originally launched with a custom
de-signed and programmed client but has since moved to using the BOINC middleware platform (http://boinc.berkeley.edu). 2.1 BOINC middleware
Using the expertise gained developing and operating the SETI@home project, BOINC (Berkeley Open Infrastructure for Network Computing) is being developed at U.C. Berkeley Space Sciences Laboratory. It aims to encourage scientists to use public resource distributed computing by lowering the barrier of entry, in terms of time spent developing software, to a research scientist with moderate computer skills (Ander-son, 2004). It does this by providing a common client for all BOINC projects along with an API that the scientist can use to wrapper their existing scientific application and server side software. The scientific application and BOINC client can then communicate with each other, with the BOINC client communicating with the server software in turn. The techni-cal aspects of distributed computing such as network access, security, redundant computing, server failure strategy, distri-bution of work and scientific applications and collection of results are all handled by the BOINC middleware, allowing the scientist to concentrate on their application (Anderson, 2004).
BOINC also provides participant oriented web site fea-tures to maintain user interest including awarding credit for computation, the ability to form teams, creating and main-taining users and their preferences, message boards and fo-rums (Anderson, 2004).
Finally, BOINC provides, as part of its API, methods to allow the scientist to provide client graphics either in a stand alone window or as a screensaver.
2.2 Client/Server communication
BOINC has several different server components. These are the website server, database server, scheduling server, down-load server and updown-load servers. They may all be contained on the same physical machine but may also be distributed. There are one only of the database and scheduling servers but there may be one or many download and upload servers. When a user joins a project they first have to sign up via the website server. An account key is then sent to the email address they supplied. They then download the BOINC core client software.
Upon executing the client software, the user is prompted for their account key and the URL of the scheduling server, which is typically given via the website server. The client then contacts the scheduling server to see if any work is available, the scheduling server replies with the address of a download server where the work data (termed a worku-nit) is located and the client downloads it. Each workunit has a particular application associated with it which is used to carry out the actual computation. If the client does not have this application then it is also downloaded. The client
automatically invokes execution of the application using the data contained in the workunit.
Periodically, during the computation, the client communi-cates back to the scheduling server via a mechanism known as a “trickle”. This notifies the server that the client is still active, to award credit and also of some partial results.
When the computation is complete, the client uploads the results back to an upload server. In climateprediction.net’s case, the UM produces approximately 600 MB of data. This is post-processed into approximately 12 MB which is then uploaded. The upload servers are distributed and federated, there is no complete data set residing on any one server.
The server side software records details of the users, the workunits that are being computed, the trickles and the re-sults on the database server.
2.3 Security
BOINC provides mechanisms to ensure against malicious code distribution, result falsification, credit falsification and denial of service attacks against servers (http://boinc. berkeley.edu/security.php).
To prevent the case of a hacker gaining access to a down-load server and distributing malicious code as a BOINC ap-plication, BOINC uses public/private key digital signing to sign the application executables. This signing is carried out on a stand alone, non-network attached computer, therefore the private key cannot be accessed via a network.
A similar mechanism is used to prevent denial of ser-vice attacks against upload servers. Each project has a pub-lic/private key pair for upload authentication. The client signs the result with the public key and then uploads this to the upload server which checks the signature using the pri-vate key. It also checks the file size.
2.4 Separation of compute grid and data grid
BOINC has provided climateprediction.net with the network infrastructure needed to carry out distributed computing. However, the upload servers are distributed and, to access and analyse the results, the data on these servers must be accessed. There are, therefore, two grids: a large, compu-tational grid and a data only grid, much smaller in terms of number of machines but containing in the order of terabytes of data.
2.5 Contrast with GRID computing
GRID computing can also provide high volume computing for processor and data intensive tasks. The major constrast with BOINC is that GRID computing is performed on com-puters owned and run by institutions, that are likely to be powered on permanently, are trusted and have system admin-istrators. More of the differences are discussed in Anderson, 2004.
3 Data nodes
Each upload server in the data grid also functions as a data node, serving data to data users. These data users may also wish to do some transformation of the data, which may pro-duce a result smaller than the sum of the input data, e.g. av-eraging of a region over a number of runs in an ensemble. Therefore, there is an advantage in processing data on the data node and producing the result there, rather than passing all of the data back to the data user. Data nodes should offer services to transform the data as well as services to access the data.
At the core of the grid is a database server containing meta-data, including the location of result data and the parameters involved in generating the result.
The implementation of these services is complicated by several factors:
– climateprediction.net relies on donated data nodes.
Sev-eral academic institutions host data node servers, which the core climateprediction.net team do not have root ac-cess to.
– The data set is federated across these data nodes, that is,
there is only one copy of the data and it is spread across potentially many data nodes.
– It is either not possible or not desirable to have FTP
access to these data nodes.
– The data is to be made available to different classes of
end user, including school children and university re-searchers.
– The data is stored in netCDF (http://my.unidata.ucar.
edu/content/software.html) format, with meta data available in a centralized database. At the moment, this meta data is in a proprietary format but there are future plans to incorporate it into the NERC Data Grid. The design of an infrastructure to access this data must have these desirable features:
– be secure, robust, efficient and scalable across the
num-ber of data nodes.
– transparently provide access to both the meta-data and
the data, independent of the data node it is residing on.
– support multiple interfaces to the data to facilitate the
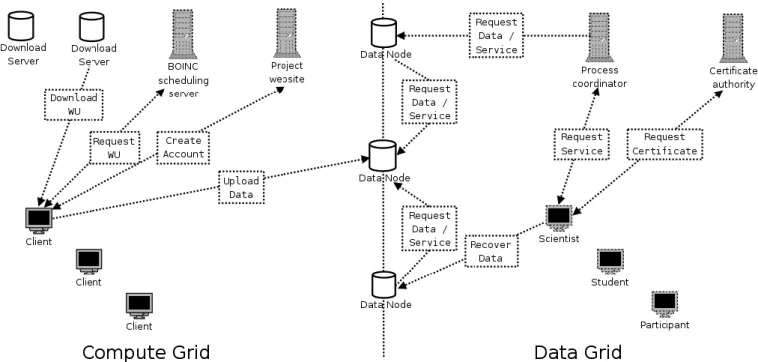
use of the services by different classes of data user. Figure 1 shows the structure of the client nodes, data nodes and supporting servers.
52 N. Massey et al.: Federated data servers in climate prediction.net
Fig. 1. structure of the computing resources involved in climateprediction.net, the separation between data and computation and the
commu-nication between them.
3.1 Distributed analysis
One service that the project aims to provide is analysis of the entire data set, independent of the data nodes that it resides on. Even a simple analysis, such as averaging a region over a number of simulations, results in the execution of many operations:
1. Query the database to determine the location of the sim-ulation results
2. On each data node containing the simulation results, av-erage the data, producing an intermediate result. 3. Copy the intermediate results to temporary storage on a
data node
4. Average the intermediate results to obtain the final result 5. Make the result available to the data user. The analysis may be very computationally complex and take several days to complete.
To enable such a system to be produced, the following de-sign decisions were taken:
– The user will be presented with a service oriented
ar-chitecture with a unified application programming inter-face (API). This will allow different interinter-faces to have access to the same underlying functionality
– Data will be copied rather than moved. This will
pro-tect the persistence of the data and remove the complex-ity involved in tracking the location of the data when moved.
– The data will be accessed just in time, that is, only data
that is needed for an analysis will be accessed and only at the point it is needed. This will prevent unnecessary data movement and bandwidth usage.
– Analysis will be distributed. Naturally, because the data
is federated, but also to distribute the computational load across the data nodes.
– The request to the service and the receiving of the
cor-responding result will occur asynchronously. A syn-chronous operation would tie up the user’s machine and also the data nodes.
– Web services will be used to provide the infrastructure.
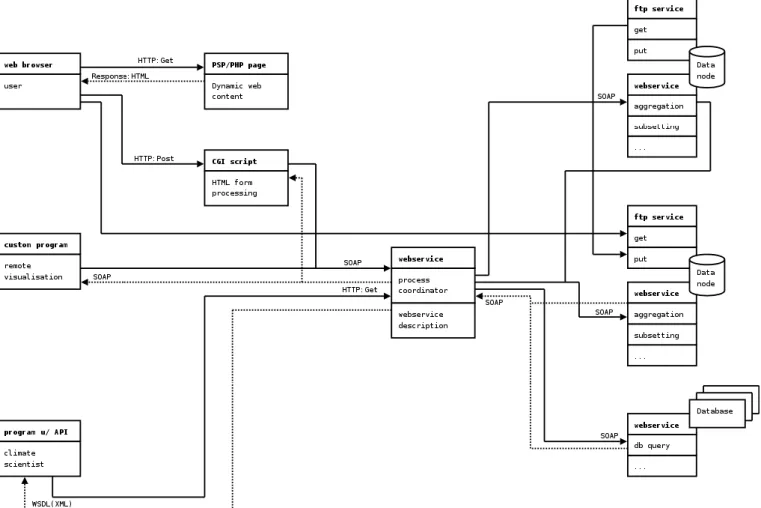
Figure 2 shows the communication between the various components of the system, including the message protocols the communication will use.
3.2 Using middleware
Due to the complexity and man hours involved in creating a network stack to implement a grid like infrastructure (Foster and Kesselmann, 1998), the decision was taken very early on to use middleware. A set of requirements were identified and the available middlewares were evaluated against it:
Fig. 2. Illustrative example of a webservice in climateprediction.net with the corresponding message passing formats.
3.2.1 Network transparent resource referencing
A means of referring to resources and services across data nodes in a unified manner is needed. In particular, data nodes will store source data, may provide services and cache inter-mediate results. A service should refer to local data and data on separate nodes through the same interface.
3.2.2 Mediated, efficient point to point data transfer
Data must be copied from one node to another for processing, mediated by a third party which doesn’t need to receive the data directly to facilitate workflow control.
3.2.3 Authentication, authorisation and security
Users will have different privilege levels, allowing them ac-cess to different services. Services must be able to confirm a user’s identity and privilege level to protect against malicious attack.
3.2.4 Resource management
Caching and storage of intermediate results will require en-forcement of resource limits on a per data node basis to pre-vent resource exhaustion. More advanced processing ser-vices may require memory and processing time limits.
3.2.5 Client side interoperability
Data users will access the service through different inter-faces. These may include a web portal, command line tools, scripting language interfaces and GUI applications. To facil-itate this middleware tools should interoperate easily.
3.2.6 Lightweight server
Servers should be relatively lightweight to encourage feder-ation. Root access on the server cannot be assumed. The server should be as easy to configure as possible.
54 N. Massey et al.: Federated data servers in climate prediction.net 3.3 Webservice technology
SOAP (Simple Object Access Protocol) is an XML based document specification which allows the exchange of infor-mation in a decentralised, distributed system (Box et al., 2000). It enables exchange of application-defined datatypes and remote procedure calls and responses. WSDL (Web Ser-vices Description Language) (http://www.w3.org/TR/wsdl) is an XML document format for describing network re-sources as a set of endpoints. It can be used to describe the location and expected inputs of a SOAP based service, allowing data users to discover the details of the service be-fore binding to it. Apache Axis (http://ws.apache.org/axis) is an implementation of SOAP from the Apache foundation, available in Java and C++ implementations. It also facili-tates the automatic writing of WSDL from Java class defini-tions. Apache Tomcat (http://jakarta.apache.org/tomcat) is a servlet container, allowing Java programs to be invoked via the HTTP protocol. It integrates well with Axis, allowing SOAP based services to be called via HTTP, in conjunction with a HTTPD server or as a standalone server.
SOAP and WSDL via Apache Axis and Tomcat have been chosen to implement the data grid, due to this group of technology evaluating well against the criteria in Sect. 3.2. In particular, the use of URIs, XML and namespacing provide transport neutral resource referencing; there are efforts to integrate security within the stack of SOAP derived technologies (http://docs.oasis-open.org/wss/2004/ 01/oasis-200401-wss-soap-message-security-1.0.pdf); the availability of SOAP implementations in other programming languages, coupled with its use of open standard protocols encourages client side interoperability. The server (Axis + Tomcat) is also relatively lightweight, occupying around 10 MB on disk, has the ability to install into a user direc-tory, therefore does not need root access privileges and is reasonably efficient: the operation overhead of the server is negligible when compared to the operations that are to be run within the server. There is support from industry, in-cluding IBM, Sun and Microsoft http://www.w3.org/2000/ xp/Group/\#membership and from the academic community in the UK through the Open Middleware Infrastructure Insti-tute (http://www.omii.ac.uk).
However, SOAP does have some drawbacks. Raw data can only be encoded within the XML document in base-64, ef-fectively quadrupling the size of the data. With the amount of data involved in a analysis of the climateprediction.net data, this is not a viable transport mechanism. Some other trans-port protocol must be used, such as FTP or gridFTP. 3.4 Composing analysis
When undertaking the use case analysis for scientists work-ing with the data (see Sect. 4.1) it became apparent that the analysis that they wish to perform can be broken down into smaller components. climateprediction.net aims to provide
a system where each analysis component is available as a webservice, complete with WSDL description. The scien-tists will then be able to construct complex analysis from chaining together analysis components. This chain will be submitted to a process controller, possibly in a workflow lan-guage. The process controller will marshal data and call the services for each component in the chain. Each component will produce intermediate results which will need to be stored and passed to the process controller to marshal to subsequent components in the chain. Each analysis component will be referenced by a URI which will allow passing a function as an argument, enabling the chaining together of analysis.
Such a system will allow the analysis to be distributed by passing different components, along with a reference to the required data, to separate data nodes. If there is no linear dependence on results between components in the chain then the analysis has the potential to be parallelised.
3.5 Transfer and persistence of data
As noted in Sect. 3.3, SOAP cannot be used as a transport mechanism for large datasets. Fast and reliable data ex-change can be facilitated by using another transport mech-anism, such as FTP or gridFTP. Data is referred to by ref-erence, through a URI, and can be obtained by passing the reference to a data transfer service, which copies the data via the transport mechanism. An asynchronous call is then made to the calling service to notify it that the data has been trans-ferred.
Such a system requires transitionary storage consisting of a table to contain URIs and a cache area to contain the actual data. When an analysis service requests data from a node, it is copied from the storage node to the calling node and made available as via URI. If the storage node and calling node are the same then a URI reference can be placed in the transi-tionary storage without any copying to the cache. Analysis will produce intermediate results which will also be made available in the transitionary storage and can then be refer-enced by further analysis via their URIs.
Transitionary storage requires a garbage collection strat-egy. The length of time to complete analysis and the ex-pected size of the results requires a novel implementation. After considering the use case in Sect. 4.1.1 the following strategy has been proposed:
– Data is available for 1 month after generation, then it is
deleted, even if it hasn’t been accessed
– Data is deleted 2 weeks after it has been accessed, if the
access was successful.
This should ensure that users with complex analysis require-ments have enough time to copy their results to their local storage, that their data will not disappear if they go on vaca-tion and that the transivaca-tionary storage does not fill too rapidly with analysis that halted half way through.
Data in the system is made available by copying from the main data repository to transitionary storage, it is never moved. The most compelling reason for this is that it is de-sirable to have only one definitive copy of the dataset, the copies in the transitionary storage are only temporary. If moving were to be allowed, keeping track of the location of a particular returned simulation would involve extensive modification of the meta-data in the database. Referencing by URI also allows the forwarding of data by creating a URI referencing another URI.
3.6 Notification of results
A complex analysis of the data may take several days. The services to provide the analysis are designed to be imple-mented asynchronously, i.e. an end user will make a request to the process controller and the result will be returned at a URI some time later. The end user will need to be informed that their analysis is finished and the result is available. There are numerous ways to do this, the following are being con-sidered:
1. email: the end user will receive an email telling them of the location of the result. This is an easy to implement solution but does not allow the user to check upon the completion status of their analysis.
2. a dynamically changing website: the end user will be supplied with a web site address when submitting their analysis. This will allow them to view a web page with a completion percentage and any error messages. When the analysis is complete the URI of the result will be published here.
3. a RSS feed: the end user will be supplied with the ad-dress of an RSS news feed. This news feed will supply RSS formatted XML documents notifying the user of the progress, any errors and, eventually, the URI of the results.
4 Connecting interfaces to webservices
One of the design goals of the data access service is to pro-vide different interfaces to different levels of users. Use case analysis was carried out to determine what these interfaces may look like.
4.1 Use cases
4.1.1 The climate scientist
Climate scientists are likely to have a repository of analy-sis code or a favourite visualisation package. The system should produce an interface that can be accessed by many programming languages. A climate scientist’s analysis may
take many days, the results may not be accessed immediately due to vacation or conference commitments.
The scientists may also wish to search the meta-data to identify runs with certain parameter combinations. Such a search may be carried out via an advanced web interface, with the results available to download in a format readable by a programming language, for example, XML.
4.1.2 The school child
climateprediction.net has material available for school teachers to use (http://www.climateprediction.net/schools/ resources.php). The teaching may also involve the students running their own simulation via the climateprediction.net client. Students should then be able to compare their run with other runs, to determine the effect of certain perturba-tions upon the model, e.g. doubling CO2. This should be done via an interface familiar to them, a web browser being the obvious choice. The interface should be easy to navigate, related to the teaching material and present the results in an easy to read manner, e.g. graph plots.
4.2 Software reuse
The design of the system is hierarchical and separates out the interfaces at several levels. Firstly, at the lowest level, the ap-plication programming interface (API) is separated from the implementation of the services. This allows different APIs to share a common implementation code base, for example a SOAP interface to the services or a purely XML-RPC in-terface. At the next level are interfaces that use these APIs, for example a CGI script or a custom client. Still further up the hierarchy are interfaces such as a HTML, web browser accessible one, such as mentioned in Sect. 4.1.2, which will call the CGI.
The calling of a certain interface may imply a certain priv-ilege, or request a password to determine whether a user can access a particular service, regardless of the interface.
Constructing the system in such a way is good software engineering practice, it:
– Reduces replication at the implementation level – Fulfils the requirements of the use case analysis – Increases maintainability by having one common
code-base
– Increases the flexibility of the APIs by considering more
user scenarios
Many languages can now connect via SOAP (Python, PHP, C/C++, Perl, etc.), enabling many interfaces to be coded without reimplementing the base functionality.
56 N. Massey et al.: Federated data servers in climate prediction.net
5 Conclusions
climateprediction.net is a public resource distributed computing project which has the capability of producing terabytes of data. This data will be analysed by a wide range of end users from school children to scientists. This paper has detailed some of the problems involved with analysing a large, federated dataset and presented technology that can be used to implement a system to perform the analysis. Producing such a system is a long and complex task. At the time of writing, example services have been implemented using SOAP in both Java and Python and a rudimentary security solution has also been implemented. It is hoped that with continual development, the system will evolve to offer remote access and analysis of the data set to end users.
Edited by: E. Cutrim, M. Ramamurthy, S. Nativi, and L. Miller Reviewed by: anonymous referees
References
Myles, A., Kettleborough, J., and Stainforth, D.: Model Error in Weather and Climate Forecasting, in: Proceedings of the ECMWF Predictability Seminar, European Centre for Medium Range Weather Forecasting, Reading, UK, 275–294, 2002. Anderson, D. P.: BOINC: A System for Public-Resource
Comput-ing and Storage, 5th IEEE/ACM International Workshop on Grid Computing, 4–10, 2004.
Box, D., Ehnebuske, D., Kakivaya, G., Layman, A., Mendelsohn, N., Nielsen, H. F., Thatte, S., and Winer, D.: Simple Ob-ject Access Protocol (SOAP) 1.1, http://www.w3.org/TR/2000/ NOTE-SOAP-20000508/, 2000.
Foster, I. and Kesselman, C.: The Grid: Blueprint for a New Com-puting Infrastructure, Morgan Kaufmann, 29–34, 1998. Lawrence, B. Boyd, D., Kleese van Dam, K., Lowry, R., Williams,
D., Fiorino, M., and Drach, B.: The NERC Data Grid, http://ndg. badc.rl.ac.uk/public docs/NDG01 Proposal Public.pdf, 2002. Stainforth, D. A., Aina, T., Christensen, C., Collins, M., Faull, N.,
Frame, D. J., Kettleborough, J. A., Knight, S., Martin, A., Mur-phy, J. M., Piani, C., Sexton, D., Smith, L. A., Spicer, R. A., Thorpe, A. J., and Allen, M. R.: Uncertainty in predictions of the climate response to rising levels of greenhouse gases, Nature, 433, 403–406, January 2005.