HAL Id: hal-00299088
https://hal.archives-ouvertes.fr/hal-00299088
Submitted on 1 Jan 2003
HAL is a multi-disciplinary open access
archive for the deposit and dissemination of
sci-entific research documents, whether they are
pub-lished or not. The documents may come from
teaching and research institutions in France or
abroad, or from public or private research centers.
L’archive ouverte pluridisciplinaire HAL, est
destinée au dépôt et à la diffusion de documents
scientifiques de niveau recherche, publiés ou non,
émanant des établissements d’enseignement et de
recherche français ou étrangers, des laboratoires
publics ou privés.
Debris flow characteristics and relationships in the
Central Spanish Pyrenees
A. Lorente, S. Beguería, J. C. Bathurst, J. M. García-Ruiz
To cite this version:
A. Lorente, S. Beguería, J. C. Bathurst, J. M. García-Ruiz. Debris flow characteristics and
rela-tionships in the Central Spanish Pyrenees. Natural Hazards and Earth System Science, Copernicus
Publications on behalf of the European Geosciences Union, 2003, 3 (6), pp.683-691. �hal-00299088�
System Sciences
Debris flow characteristics and relationships in the Central Spanish
Pyrenees
A. Lorente1, S. Beguer´ıa1, J. C. Bathurst2, and J. M. Garc´ıa-Ruiz1
1Instituto Pirenaico de Ecolog´ia, CSIC, Campus de Aula Dei, Apartado 202, 50080-Zaragoza, Spain
2Water Resource System Research Laboratory, School of Civil Engineering and Geosciences, University of Newcastle upon Tyne, NE1 7RU, UK
Received: 21 January 2003 – Revised: 14 April 2003 – Accepted: 14 May 2003
Abstract. Unconfined debris flows (i.e. not in incised
chan-nels) are one of the most active geomorphic processes in mountainous areas. Since they can threaten settlements and infrastructure, statistical and physically based procedures have been developed to assess the potential for landslide ero-sion. In this study, information on debris flow characteris-tics was obtained in the field to define the debris flow runout distance and to establish relationships between debris flow parameters. Such relationships are needed for building mod-els which allow us to improve the spatial prediction of debris flow hazards. In general, unconfined debris flows triggered in the Flysch Sector of the Central Spanish Pyrenees are of the same order of magnitude as others reported in the literature. The deposition of sediment started at 17.8◦, and the runout
distance represented 60% of the difference in height between the head of the landslide and the point at which deposition started. The runout distance was relatively well correlated with the volume of sediment.
1 Introduction
In terms of volume moved in a short space of time, debris flows are one of the most powerful mechanisms for transport-ing material downslope (Johnson and Rodine, 1984; Taka-hashi, 1991; Bathurst et al., 1997). They occur under a crit-ical combination of sediment availability, water input, and slope gradient (Takahashi, 1981; Rickenmann and Zimmer-mann, 1993). This is especially true in the Pyrenees, as in other alpine areas, due above all to the steep slopes, the high availability of debris in both channels and hillslopes, the presence of metamorphic and Flysch rock outcrops and the relatively frequent occurrence of high intensity rainstorms.
Confined and unconfined debris flows can be distinguished by the characteristics of the channel and sedimentation area. Confined debris flows develop within incised channels that
Correspondence to: J. M. Garc´ıa-Ruiz
(humberto@ipe.csic.es)
can occasionally become torrents or avalanche channels. Un-confined debris flows occur in previously non incised hill-slopes, typically triggered on slopes with abundant non-consolidated sediments, steep gradients, scarce plant cover and no previous rills or incised channels (Brunsden, 1979). Scars develop at the rupture area of a shallow landslide that evolves into a debris flow (Bathurst et al., 1997), and termi-nates in a tongue with lateral levees ending in a frontal lobe with imbricated, non-sorted clasts. A flow track or channel develops between the source of the shallow landslide and the lobe (Varnes, 1978; Rapp and Nyberg, 1981; Johnson and Rodine, 1984; Clark, 1987). They are usually linked with intense, relatively infrequent rainstorms (Caine, 1980; Ko-tarba, 1989; Van Steijn, 1996; Blijenberg, 1998).
Debris flows are the most active geomorphic hazards in mountainous areas, affecting infrastructures, human settle-ments and tourist resorts (Takahashi et al., 1981). They can also play a very important role in determining basin sedi-ment yield (Bathurst et al., 1997), sometimes contributing to channel aggradation (Mart´ınez-Castroviejo and Garc´ıa-Ruiz, 1990), flooding and reservoir siltation (Burton et al., 1998). For this reason, many studies have tried to assess where de-bris flows occur and rank the factors that trigger them, as well as to improve management strategies that minimise the potential for landslide erosion and related off-site impacts (Wieczorek, 1987; Burton et al., 1998; Morgan et al., 1999). In this paper the characteristics of debris flow parame-ters are studied to establish statistical relationships between them. Special emphasis has been put on the distance trav-elled by debris flows (especially the runout distance) as in-fluenced by the volume of material carried by debris flows. This information is very relevant for debris flow modelling and to predict areas subject to debris flow hazards. Thus, the findings lay the groundwork for assessing the debris flow hazard for infrastructure and settlements, as well as for the fluvial network where debris flows can deliver large volumes of sediment (Mart´ınez-Castroviejo and Garc´ıa-Ruiz, 1990).
A previous paper (Lorente et al., 2002) considered the lo-cation of almost 1 000 debris flows distributed in the Upper
684 A. Lorente et al.: Debris flow characteristics and relationships in the Central Spanish Pyrenees
SPAI N Debris flow scar
Lithology:
Conglomerates Marls Flysch Limestones
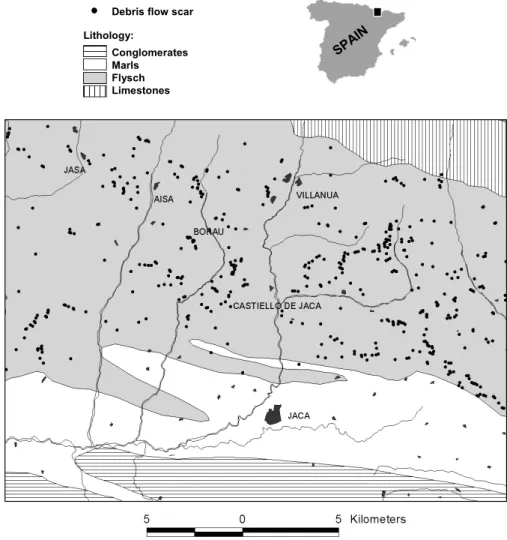
Fig. 1. Location of the study area and
distribution of debris flows in the Fly-sch Sector.
Arag´on and G´allego basins, Central Spanish Pyrenees. With this information the distribution of debris flows was corre-lated with the lithology, gradient, aspect, altitude, distance to the divide, plant cover, evolution of land use and other envi-ronmental, microtopographical factors. Most debris flows in the Spanish Pyrenees are found in disturbed areas, on steep slopes cultivated some decades ago and affected by overgraz-ing and recurrent wildfires (Gonz´alez et al., 1995). The high-est density of debris flows occurs on the Flysch Sector, espe-cially in those areas affected by intense tectonic activity, as has been reported in other mountain regions (i.e. Tishchenko, 2000; Corominas, 1996).
2 The study area
The study area includes the upper basins of the Arag´on and G´allego rivers, in the Central Spanish Pyrenees. The Fly-sch Sector (867 km2) was selected for this study since it con-tains most of the debris flows in the study area (Fig. 1). It is geomorphologically active with relatively steep gradients and alternating thin sandstone and marl beds which promote the triggering of shallow (as well as deep) landslides. The
gradients are smoother and more homogeneous than in the rest of the Central Pyrenees, in spite of intense tectonization and complex faults and folds. The divides reach 2200 m, de-creasing southward. Contact with the marls of the Inner De-pression is at about 800 m by means of an overthrusting fault (Puigdef´abregas et al., 1992).
The mean annual precipitation in the study area exceeds 800 mm, increasing to 2000 mm above 2000 m (Garc´ıa-Ruiz et al., 1985). The wet season lasts from October to May, with very little rain in January and February. The whole area is occasionally subject to very intense rainstorms (Garc´ıa-Ruiz et al., 2000), which can cause serious damage by flash floods (White et al., 1997) and mass movements.
Human disturbance is intense below 1600 m. Most sunny hillslopes in the Flysch Sector have been cultivated (even steep sections) using shifting agriculture systems (Lasanta, 1989). Old fields outside the Inner Depression are often abandoned and revegetated by dense shrubs (Molinillo et al., 1997) and reforested pines. Crops (meadows) only persist at the valley bottoms. Above 1600 m, the landscape is domi-nated by dense forests and subalpine and alpine grasslands, occasionally affected by intense erosion (Garc´ıa-Ruiz et al., 1990).
1 12 2 4 10 9 11 7 13 14 15 16 3 8 6 5
Fig. 2. Parameters measured in the debris flows.
Debris flows are especially dense in areas that have been intensively utilized agriculturally for centuries, mainly in the most tectonized parts and where very old slumps have been identified. They affect to a colluvium covered by poorly de-veloped, shallow carbonate-rich regosols in the south facing slopes and Kastanozems in the north facing slopes. The col-luvium is a matrix-supported deposit with sandstone gravels and blocks. The matrix (around 70% of the mixture) is com-posed, in average, of 50% of sand, 30% of silt and 30% of clay.
Debris flows occur with a relatively high frequency in the study area Garc´ıa-Ruiz et al., 2003). The mean rate of occur-rence is 0.06 debris flows km−2yr−1. The triggering of shal-low landslides is related to relatively frequent intense rain-storms, having a recurrence of no more than 2 to 5 years. The mapped and measured debris flows have been triggered in the last 30 years.
3 Methods
A total of 961 unconfined debris flows were identified in the Upper Arag´on and G´allego basins (Lorente et al., 2002). Ninety-eight were selected in the most geomorphologically active areas of the Flysch Sector, close to the contact with the marls of the Inner Depression (Ijuez and Aur´ın valleys and southern aspects between Jaca and Sabi˜n´anigo; Fig. 1).
The following variables were defined and measured in the field (numbers are referred to in Fig. 2):
1. ALTSCAR: The altitude of the top of the debris flow scar above sea level (m).
2. ALTBASE: The altitude where debris flow deposition begins (m).
3. ALTDEP: The altitude where the runout deposit ends (m).
4. 1h: Difference in height (m) between ALTSCAR and ALTBASE.
5. 1hTOT: Difference in height (m) between ALTSCAR and ALTDEP.
6. LENGTH: Total length (m) of the debris flow between the upper part of the scar and the beginning of the de-posit.
7. RUNOUT: Length (m) of the debris flow deposit from end of channel to toe or front of debris. Also defined as the distance travelled downslope from the onset of large scale deposition (Fannin and Wise, 2001).
8. TOTLENGTH: The total length of the landform, from the upper part of the scar to the end of the deposit (m). 9. SCAR◦: Average gradient (degrees) at the debris flow
scar, by measuring the natural unfailed slope along the sides of the landslide scar.
10. CANAL◦: Average gradient (degrees) of the debris flow
channel.
11. BASE◦: Average gradient (degrees) of the debris flow
deposit.
12. SCAR2: Average width of the debris flow scar (m). 13. CANAL2: Average width of the debris flow
chan-nel (m).
14. BASE2: Average width of the debris flow deposit (m). 15. VOLUME: Estimated volume of the material mobilized
by the debris flow (m3). It has been obtained from the debris flow scar.
16. SOILM: Average depth (m) of the failure surface in the shallow landslide.
According to the histograms, the variables were dis-tributed normally with some outliers. The latter were elimi-nated, leaving a total 85 cases. Finally, a new selection was made to avoid cases that were doubtful or unsatisfactory (i.e. uncertain runout distances), leaving 64 cases.
Descriptive statistics (average, median, standard deviation, maximum and minimum values, etc.) and Pearson correla-tion coefficients were calculated for the variables measured. Linear and power regressions were performed to predict their variables RUNOUT and TOTLENGTH, to compare with the empirical relations proposed by several authors (Vandre, 1985; Rickenmann,1999). A multiple linear regression was also carried out upon the variable RUNOUT. A stepwise pro-cedure was used to identify the most relevant variables for its prediction.
4 Results
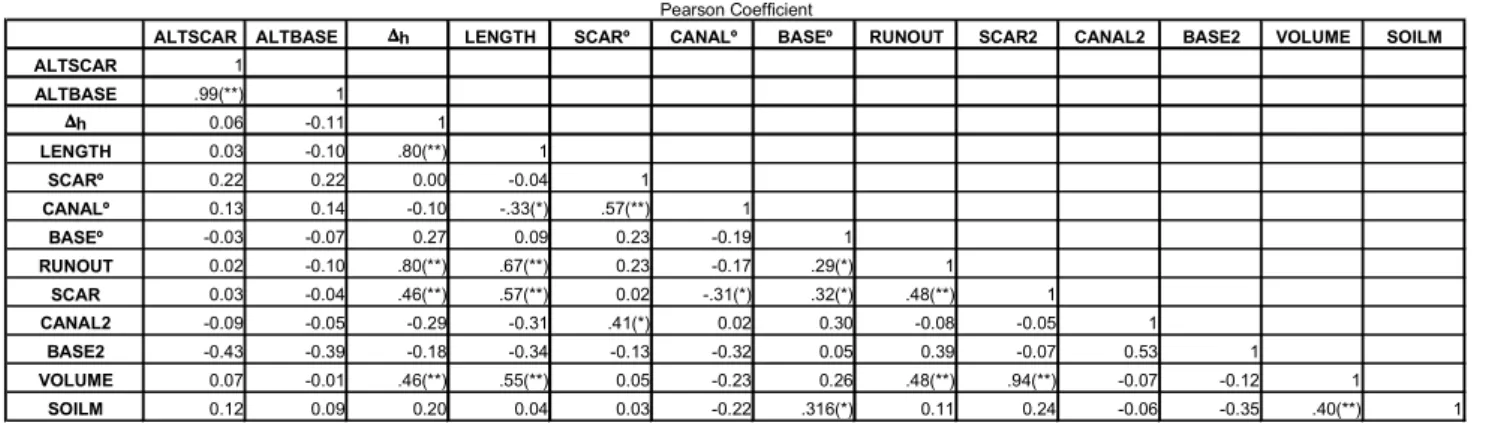
Table 1 shows the main features of the debris flows mea-sured in the field, and Table 2 the correlation matrix between the different debris flow parameters. Only the most relevant characteristics of the debris flows (i.e. size parameters, vol-ume, gradient) are described, as well as the most important relationships between parameters. Some irrelevant, though
686 A. Lorente et al.: Debris flow characteristics and relationships in the Central Spanish Pyrenees
Table 1. Descriptive statistics for different debris flow parameters
Table 1. Descriptive statistics for different debris flow parameters
ALTSCAR ALTBASE ∆∆∆∆h LENGTH SCARº CANALº BASEº RUNOUT SCAR2 CANAL2 BASE2 VOLUME SOILM
Valid 64 64 64 61 64 47 51 53 61 28 8 63 63 Missing 0 0 0 3 0 17 13 11 3 36 56 0 1 1157.4 1120.8 36.6 51.4 33.9 33.7 17.8 22.1 15.4 5.2 9.3 179.9 0.7 1175.0 1140.0 35.0 49.5 33.0 33.0 18.0 20.0 14.5 4.8 8.8 135.7 0.6 1245.0 1095.0 35.0 55.0 31.0 32.0 15.0 20.0 13.4 4.5 8.0 103.0 0.6 108.8 109.3 17.9 21.0 5.0 4.2 4.9 11.1 5.3 1.7 4.5 131.9 0.1 11843.8 11944.2 318.7 441.6 25.2 17.5 23.6 123.5 27.9 3.0 20.2 17391.7 0.0 -0.351 -0.372 0.906 0.415 0.050 0.552 -0.138 1.048 0.628 1.057 -0.010 1.166 1.021 0.299 0.299 0.299 0.306 0.299 0.347 0.333 0.327 0.306 0.441 0.752 0.299 0.302 -0.800 -0.786 0.472 -0.371 0.639 0.207 -0.298 0.938 -0.139 1.227 -1.116 0.804 1.184 0.590 0.590 0.590 0.604 0.590 0.681 0.656 0.644 0.604 0.858 1.481 0.590 0.595 425.0 445.0 78.0 94.8 26.5 19.0 19.0 49.8 22.6 7.5 12.0 562.5 0.7 930.0 890.0 7.0 10.2 18.5 25.0 8.0 5.8 7.4 2.5 3.0 32.9 0.5 1355.0 1335.0 85.0 105.0 45.0 44.0 27.0 55.6 30.0 10.0 15.0 562.5 1.1 10 989.5 955.0 18.5 25.3 29.0 29.0 10.0 10.1 8.6 3.0 3.0 41.9 0.6 20 1030.0 990.0 20.0 33.2 30.0 30.0 15.0 12.5 11.1 3.9 3.8 70.0 0.6 25 1071.3 1038.8 22.8 35.9 31.0 32.0 15.0 14.0 12.1 4.1 5.0 88.6 0.6 30 1117.0 1067.5 25.0 37.2 31.0 32.0 15.0 15.4 12.6 4.4 6.8 103.0 0.6 40 1145.0 1105.0 30.0 44.5 32.0 32.0 16.0 16.2 13.4 4.5 8.0 115.2 0.6 50 1175.0 1140.0 35.0 49.5 33.0 33.0 18.0 20.0 14.5 4.8 8.8 135.7 0.6 60 1205.0 1170.0 35.0 55.1 35.0 33.8 18.5 23.4 15.6 5.2 10.3 179.1 0.7 70 1237.5 1192.5 42.5 60.5 35.0 35.0 21.0 26.2 17.4 5.6 12.6 215.5 0.7 75 1245.0 1203.8 45.0 67.0 36.0 36.0 21.0 28.0 18.7 5.6 14.2 241.7 0.8 80 1250.0 1210.0 50.0 70.2 38.0 37.4 22.0 29.8 21.2 6.0 15.0 270.8 0.8 90 1287.5 1262.5 65.0 83.6 42.0 41.0 25.0 38.7 23.1 8.0 15.0 407.0 0.8 N Mean Median Mode Std. Deviation Variance Skewness Std. Error of Skewness Kurtosis Std. Error of Kurtosis Percentiles Range Minimum Maximum
statistically significant correlations are not considered in the presentation of the results. All the parameters try to inform on the basic characteristics of debris flows (in the scar, chan-nel and deposition area), which can be compared to those triggered in other areas of the world. Different relationships can be used to predict the length of the debris flow and its runout distance, once a shallow landslide susceptibility map is obtained by means of different field and statistical proce-dures (i.e. Guzzetti et al., 1999).
1. The characteristic landslide scar widths (SCAR2) aver-aged 15.4 m (standard deviation: 5.3 m) and the median was 14.5 m. The largest scar was 30 m wide and the minimum was 7.4 m.
2. The mean altitude (ALTSCAR) at which the landslides were triggered was 1157.4 m, coinciding very well with the results obtained from the general distribution of debris flows in the Flysch Sector (Lorente et al., 2002), where debris flows are especially frequent between 950 and 1200 m. This alti-tude is very well related to the area affected most intensively by cultivation of steep slopes, and confirms the influence of past land uses on the triggering of debris flows (Lorente et al., 2002).
3. Most landslide scars developed around 30◦ (mean 33.9◦; median: 33◦; standard deviation: 5.0◦; maximum value: 45◦; minimum value: 18.5◦). This is consistent with other studies where most debris flows occur between 25 and 38◦(Takahashi et al., 1981), between 18 and 50◦ (Coromi-nas, 1996), between 32 and 42◦ (Innes, 1983), around 38◦, with 33◦as minimum value (Blijenberg, 1998), or between 27◦for poorly drained soils and 40◦for rapidly drained soils
(Fannin and Rollerson, 1993). A good example of debris flow event was studied by Wieczorek et al. (1997) during the 27 June 1995 storm in the Blue Ridge mountains of Central Virginia, which triggered about 1000 debris flows ranging in the source area between 17 and 41◦, with both a mean and median value of 30◦. More generally, the gradient of the ini-tiation point is established between 15 and 60◦ (Moser and Hohensinn, 1983; Sidle et al., 1985; Reneau and Dietrich, 1987; Rickenmann and Zimmermann, 1993; Bathurst et al., 1997).
4. The difference in height between the upper part of the scar and the beginning of deposition (1h) was 36.6 m (stan-dard deviation: 17.9 m) and the median was 35 m. The max-imum difference was 85 m and the minmax-imum was 7 m. This reveals that in the study area few of the debris flows that oc-cur in the upper and middle part of the slopes are able to reach the fluvial channels.
5. The mean length of the deposit (RUNOUT) was 22.1 m (standard deviation: 11.1) and the median was 20 m. The maximum length was 55.6 m, and the minimum was 5.8 m. Relatively large differences in the length of the deposit are expected due to the influence of local topography. Thus, for example, those debris flows triggered in the upper part of a hillslope can develop a longer runout distance, whilst those triggered in the lower part stop when they arrive to the toe of the versant.
6. The value of the gradient where deposition started (BASE◦) was 17.8◦, with a large range from 8 to 27◦. This variance can be explained by the conditions under which de-bris flows occur in the Flysch Sector. The angle of
depo-Table 2. Correlation matrix between the different debris flow parametersTable 2. Correlation matrix between the diferrent debris flow parameters
ALTSCAR ALTBASE ∆∆∆∆h LENGTH SCARº CANALº BASEº RUNOUT SCAR2 CANAL2 BASE2 VOLUME SOILM
ALTSCAR 1 ALTBASE .99(**) 1 ∆ ∆∆ ∆h 0.06 -0.11 1 LENGTH 0.03 -0.10 .80(**) 1 SCARº 0.22 0.22 0.00 -0.04 1 CANALº 0.13 0.14 -0.10 -.33(*) .57(**) 1 BASEº -0.03 -0.07 0.27 0.09 0.23 -0.19 1 RUNOUT 0.02 -0.10 .80(**) .67(**) 0.23 -0.17 .29(*) 1 SCAR 0.03 -0.04 .46(**) .57(**) 0.02 -.31(*) .32(*) .48(**) 1 CANAL2 -0.09 -0.05 -0.29 -0.31 .41(*) 0.02 0.30 -0.08 -0.05 1 BASE2 -0.43 -0.39 -0.18 -0.34 -0.13 -0.32 0.05 0.39 -0.07 0.53 1 VOLUME 0.07 -0.01 .46(**) .55(**) 0.05 -0.23 0.26 .48(**) .94(**) -0.07 -0.12 1 SOILM 0.12 0.09 0.20 0.04 0.03 -0.22 .316(*) 0.11 0.24 -0.06 -0.35 .40(**) 1
** Correlation is significant at the 0.01 level (2-tailed). * Correlation is significant at the 0.05 level (2-tailed).
Pearson Coefficient
sition can be strongly influenced by the presence of bench terraced fields or forest patches and by variations in water content. The value obtained is appropriate for unconfined debris flows, that is, shallow landslides that evolve into de-bris flows.
7. One of the most interesting problems when determining debris flow hazard is to devise a simple formula for runout distance using other parameters. One of these formulas, con-sidering the best compromise between simplicity and relia-bility, is from Vandre (1985), who found that runout distance is about 35–45% of the difference in height between the head of the landslide and the point at which deposition starts. The formula derived from his data (Bathurst et al., 1997) is:
RUNOUT = α1h (1)
where α is an an empirically derived fraction parameter ex-pressing the ratio of RUNOUT to 1h.
According to Vandre’s (1985) data, the α value is 0.4 (that is, runout distance is 40% of the parameter 1h).
In the case of debris flows measured in the Flysch Sector of the Spanish Pyrenees, the α value is 0.605.
8. The volume of material mobilized by the landslides (VOLUME) averaged 179.9 m3(standard deviation: 131.9). The median was 135.7 m3 and the maximum value was 562 m3. Thus, the studied debris flows can be included among those defined as “small scale debris flows” as defined by Innes (1983). These values are of the same order of mag-nitude as most debris flows cited in the literature (Blijenberg, 1998). Nevertheless, a large variability of volumes can be expected even in the same area (see, for example, the study of Rickenmann and Zimmermann, 1993, on debris flows in the Swiss Alps).
9. The depth of the failure surface (SOILM) occurred at 0.6 m (standard deviation, 0.12, median, 0.6, and extreme values 1.1 and 0.45 m), confirming that debris flow scars affect only the soil and superficial colluvium. No debris flows affecting the unweathered Flysch substratum have been found.
10. 1h was very well correlated with LENGTH
(r = 0.80) and with the distance travelled by the deposit (RUNOUT) (r = 0.80). Good relations were also obtained with the width of the scar (SCAR2) (r = 0.46) and the VOLUME (r = 0.46). These results confirm that a larger dif-ference in height can explain the runout distance, due to the potential energy of the landslide. The volume of the deposit was also larger as 1h increased, probably due to erosion along the channel. In fact, Wieczorek et al. (1997) underline that erosion along the channel is a very important process to explain the final volume of the debris flow deposit, and that the erosive volume from channels is often many times greater than from source landslide areas. Nevertheless, channel ero-sion do not seem to be very relevant in the study area and is, at least in part, compensated by the development of lateral levees. Similar relationships were obtained for the variable LENGTH.
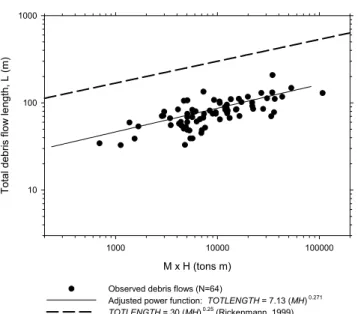
Figure 3 plots the total length of debris flows (L) (that is, TOTLENGTH) vs. potential energy, represented by the MH factor, obtained by the multiplication of the derbis flow vol-ume (VOLUME) and the difference in height between the highest point of the debris flow scar and the lowest end of the debris flow lobe (1hTOT). Fig. 3 also includes Rick-enmann’s (1999) relationship, obtained from valley-confined debris flows in the Alps.
For the Pyrenean debris flows the relationship is expressed by
L =7.13(MH )0.271 (2)
For the Alpine debris flows (Rickenmann, 1999) the relation-ship is
L =30(MH )0.25 (3)
The differences are obvious since the adjusted power func-tion for the Pyrenean debris flows is clearly lower than for the Alpine ones. That is, with the same volume of debris, the valley-confined debris flows develop a larger displacement
688 A. Lorente et al.: Debris flow characteristics and relationships in the Central Spanish Pyrenees M x H (tons m) 1000 10000 100000 Tot al deb ris f low le ngt h, L (m ) 10 100 1000
Observed debris flows (N=64)
Adjusted power function: TOTLENGTH = 7.13 (MH) 0.271
TOTLENGTH = 30 (MH) 0.25
(Rickenmann, 1999)
Fig. 3. Total length of debris flows vs. the available potential energy,
represented by the MH factor. The adjusted power function is also represented, along with the Rickenmann (1999) relationships (bold dashed line).
than unconfined, Pyrenean debris flows. This is probably a logical or expectable result, as the displacement of a debris flow (and its runout) is highly sensible to the water content (Chau et al., 2000), and it is obvious that, in general, the valley-confined debris flows are likely to have higher water discharges than the hillslope debris flows.
11. The gradient of the debris flow scar (SCAR◦) was well related with the gradient of the channel (CANAL◦) (r = 0.57) and the width of the channel (CANAL2) (r = 0.41).
12. The runout distance (RUNOUT) mainly depended on the difference in height (1h) (r = 0.80), the LENGTH (r = 0.67), the gradient at which deposition started (BASE◦) (r =
0.39), the width of the scar (SCAR2) (r = 0.48), and the volume of the deposit (VOLUME) (r = 0.48).
13. Finally, the volume of the deposit was correlated with the difference in height (1h) (r = 0.46), the length of the debris flow (LENGTH) (r = 0.55), runout distance (r = 0.48), soil depth (r = 0.40) and the width of the debris flow scar (SCAR2) (r = 0.94), that is, most of the factors that characterize the size of the debris flow. It is important to note that many of the correlations are only significant at the 0.01 level (Table 2).
A stepwise multiple linear regression was performed to predict the length of the runout distance (RUNOUT) us-ing the variables that presented the highest correlation and a physical meaning: 1h, LENGTH, SCAR◦AND BASE◦,
SCAR2 and VOLUME. The variables selected by the model were 1h and SCAR◦, with r2=0.696. The equation relat-ing the runout distance to these two variables is:
RUNOUT = −12.609 + 0.5681h + 0.412SCAR◦ (4) 0 10 20 30 40 50 60 0 10 20 30 40 50 60 Observed (m) Pr ed ic te d ( m )
Fig. 4. Relationships between observed and predicted values of the
runout area, according to the regression model with four variables (Eq. 4).
Due to the negative intercept, this equation is valid only in the case that SCAR◦>30.6, or
1h > (12.609 − 0.412SCAR◦)/0.568
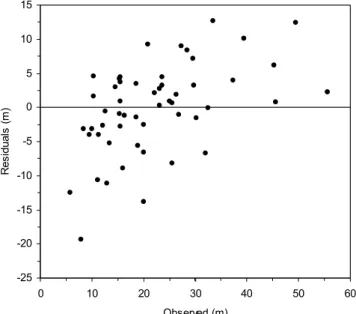
Figure 4 depicts the observed and the predicted values of the runout distance. Predicted values were obtained from the multiple linear regression with two variables. In general, ob-served and predicted values were scattered about a straight line, confirming that the runout distance can be predicted quite well using Eq. (4), but the model slightly underesti-mates the largest values and overestiunderesti-mates the lowest values. This is confirmed in Fig. 5, which relates the observed val-ues of the runout distance and the residuals (predicted minus observed values) from the regression in Fig. 4. Figure 5 il-lustrates the distribution of the residuals in relation to the observed runout distance, showing that the highest values of runout distance correspond to positive residuals, whilst the lowest values correspond to negative residuals.
5 Discussion and conclusions
Two basic problems when studying landslide hazards are pre-dicting whether the landslide material arrives directly to flu-vial channels (and in what percentage it is delivered) and whether it affects infrastructures or human settlements. Thus, two lines of work are necessary to solve both questions: (i) a debris flow susceptibility map including the areas with the highest probability of debris flow occurrence (Guzzetti et al., 1999), and (ii) the assessment of relationships between dif-ferent debris flow parameters to predict the distance travelled by the deposit according to the gradient along the hillslope
-25 -20 -15 -10 -5 0 5 10 15 0 10 20 30 40 50 60 Observed (m) R es idua ls ( m )
Fig. 5. Relationships between the observed values of the runout
deposit and the residuals from the regression in Fig. 4.
and the volume of sediment (Scheidegger, 1973; Burton et al., 1998). This paper provides information on these rela-tionships.
In general, the width and depth values for debris flow scar and sediment volume were of the same order of magnitude as in other studies, such as in central California (Reneau and Dietrich, 1987), central Nepal (Caine and Mool, 1982; Ram-sey, 1987) or central Austria (Moser and Hohensinn, 1983). However, the relationships between some major parameters were slightly different:
– The deposition of the sediment carried by the debris
flows started at 17.8◦, much higher than other reports. Bathurst et al. (1997) found that deposition begins once the slope falls below 6–10◦, Ikeya (1981) suggested that deposition should begin at 10◦, and Fannin and Roller-son (1993) conclude that the mean slope angle of the depositional area is 5–13◦for debris flows deposited on fans of the Queen Charlotte Islands, British Columbia. A range of 10–12◦ is reported by Hungr et al. (1984) for debris flow sedimentation in the south coastal re-gion of British Columbia. It is unclear why sedimenta-tion begins at steeper slopes in the Flysch Sector. Fur-ther analysis is needed to assess the role of the volume of sediment involved as well as microtopography and vegetation. In any case, one reason for such difference could be that this paper deals only with unconfined de-bris flows.
– The α value calculated using Vandre’s formula (1985)
for the study area was 0.6. Thus, the runout distance represents 60% of the difference in height between the debris flow scar and the point at which sedimentation
starts which is longer than the 0.4 in Vandre (1985). The difference can be due to two factors:
(i) The material involved in the landslide, a matrix-supported colluvium, containing less stones than in other studies on debris flows. Most probably the mixture of stones, water and fine material is fluid enough to promote a longer debris flow runout. (ii) The gradient at which deposition started (17.8◦)
was higher than other areas which probably helps to maintain high energy levels.
Equation (4) can be used to predict the runout distance according to two factors, that is, the difference in height be-tween the head of the landslide and the point at which de-position starts (1h), and the gradient of the debris flow scar (SCAR◦).
Finally, good correlations were obtained between differ-ent parameters. Special attdiffer-ention must be paid to the re-lation between sediment volume and runout distance, as in other experimental or simulated studies (Scheidegger, 1973; Benda and Cundy, 1990; Okura et al., 2000). Kilburn and Sorensen (1998) note that, in sturtzstroms, the distance of runout lengths are proportional to the square root of their volume. This is mainly due to the fact that there is a neg-ative correlation between the friction coefficient of the mass movement and its volume (Straub, 1997). Hs¨u (1975) con-cludes that there is a minimum volume of 50 000 m3for long runout distances, what explains the short distances travelled by debris flows in the Flysch Sector where they do not exceed 500 m3.
Acknowledgements. This paper has been supported by the project
“Debrisfall assessment in mountain catchments for local end-users” – DAMOCLES (EVG1–1999–00027P) funded by the European Comission. The authors gratefully thank Prof. Wieczorek and an anonymous referee for their useful comments.
References
Bathurst, J. C., Burton, A., and Ward, T. J.: Debris flow run-out and landslide sediment delivery model tests, Journal of Hydraulic Engineering, 123, 410–419, 1997.
Benda, L. E. and Cundy, T. W.: Predicting deposition of debris flows in mountain channels, Can. Geotech. J., 27, 409–417, 1990. Blijenberg, H.: Rolling stones? Triggering and frequency of
hills-lope debris flows in the Bachelard Valley, southern French Alps, Univ, Utrecht, Utrecht, 1998.
Brunsden, D.: Mass movements, in: Process in Geomorphology, edited by Embleton, C. and Thornes, J., E. Arnold, London, 131– 186, 1979.
Burton, A., Arkell, T. J., and Bathurst, J. C.: Field variability of landslide model parameters, Environmental Geology, 35, 100– 114, 1998.
Caine, N.: The rainfall intensity-duration control of shallow land-slides and debris flows, Geografiska Annaler, 62A, 23–27, 1980. Caine, N. and Mool, P. K.: Landslides in the Kolpu Khola drainage, middle mountains, Nepal, Mountain Research and Development, 2, 157–173, 1982.
690 A. Lorente et al.: Debris flow characteristics and relationships in the Central Spanish Pyrenees Chau, K. T., Chan, L. C. P., Luk, S. T., and Wai, W. H.: Shape
of deposition fan and runout distance of debris flow, in: Effects of granular and water contents, in: Debris-flow hazard mitiga-tion: Mechanics, prediction and assessment, edited by Wiec-zorek, G. F. and Naeser, N. D., Balkema, Rotterdam, 2000.
Clark, G. M.: Debris slide and debris flow historical events
in the Appalachians south of the glacial border, in: Debris flows/avalanches: Process, recognition and mitigation, edited by Costa, J. E. and Wieczorek, G. F., Geological Society of Amer-ica, Reviews in Engineering Geology, 7, 125–138, 1987. Corominas, J.: Debris slide, in: Landslide recognition,
Identifica-tion, movement and causes edited by Dikau, R., Brunsden, D., Schrott, L., and Ibsen, M. L., Wiley, Chichester, 97–102, 1996. Fannin, R. J. and Rollerson, T. P.: Debris flows: Some physical
characteristics and behaviour, Can. Geotech. J., 30, 71–81, 1993. Fannin, R. J. and Wise, M. P.: An empirical-statistical model for debris flow travel distance, Can. Geotech. J., 38, 982–994, 2001. Garc´ıa-Ruiz, J. M., Puigdef´abregas, J., and Creus, J.: Los recursos hidricos superficiales del Alto Aragon Occidental, Instituto de Estudios Altoaragoneses, Huesca, 1985.
Garc´ıa-Ruiz, J. M., Alvera, B., Del Barrio, G., and
Puigdef´abregas, J.: Geomorphic processes above timberline in the Spanish Pyrenees, Mountain Research and Development, 10, 201–214, 1990.
Garc´ıa-Ruiz, J. M., Arn´aez, J., White, S., Lorente, A., and Be-guer´ıa, S.: Uncertainty assessment in the prediction of extreme rainfall events: an example from the Central Spanish Pyrenees, Hydrological Processes, 14, 887–898, 2000.
Gonz´alez, C., Ortigosa, L., Mart´ı, C., and Garc´ıa-Ruiz, J. M.: The study of spatial organization of geomorphic processes in moun-tain areas using GIS, Mounmoun-tain Research and Development, 15, 241–249, 1995.
Guzzetti, F., Carrara, A., Cardinali, M., and Reichenbach, P.: Land-slide hazard evaluation: a review of current techniques and their application in a multi-scale study, central Italy, Geomorphology, 31, 181–216, 1999.
Hs¨u, K. J.: On sturzstroms-catastrophic debris streams generated by rockfalls, Geol. Soc. Am. Bull., 86, 129–140, 1975.
Hungr, O., Morgan, G. C., and Kellerhalls, R.: Quantitative analysis of debris torrent hazards for design of remedial measures, Can. Geotech. J., 21, 663–677, 1984.
Ikeya, H.: A method of designation for area in danger of debris flow, in: Erosion and sediment transport in the Pacific Rim Steeplands, IAHS Publ., 132, 576–588, 1981.
Innes, J. L.: Debris flows, Progress in Physical Geography, 7, 469– 501, 1983.
Johnson, A. M. and Rodine, J. R.: Debris flow, in: Slope Instability, edited by Brunsden, D. and Prior, D. B., Wiley, Chichester, 257– 362, 1984.
Kilburn, Ch. R. J. and Sorensen, S. A.: Runout lengths of
sturzstroms: The control of initial conditions and of fragment dy-namics, Journal of Geophysical Research, 103, 17 877–17 884, 1998.
Kotarba, A.: On the age of debris flows in the Tatra Mountains, Stu-dia Geomorphologica Carpatho-Balcanica, 23, 139–152, 1989. Lasanta, T.: Evoluci´on reciente de la agricultura de monta˜na, El
Pirineo aragon´es, Geoforma Ediciones, Logro˜no, 1989. Lorente, A., Garc´ıa-Ruiz, J. M., Beguer´ıa, S., and Arn´aez, J.:
Fac-tors explaining the spatial distribution of hillslope debris flows, A case study in the Flysch Sector of the Central Spanish Pyrenees, Mountain Research and Development, 22, 32–39, 2002.
Mart´ınez-Castroviejo, R. and Garc´ıa-Ruiz, J. M.: Coladas de
piedras (debris flows) y din´amica fluvial en r´ıos torrenciales del Pirineo Central: el caso del r´ıo Ijuez, Cuadernos de Investigaci´on Geogr´afica, 16, 55–72, 1990.
Molinillo, M., Lasanta, T., and Garc´ıa-Ruiz, J. M.: Managing mountainous degraded landscapes after farmland abandonment in the Central Spanish Pyrenees, Environmental Management, 21, 687–598, 1997.
Morgan, B. A., Wieczorek, G. F., and Campbell, R. H.: Historical and potential debris-flow hazard map of area affected by June 27, 1995 storm in Madison County, Virginia, U.S. Geological Survey, Geologic Investigation Series Map I-2623B, 1:24 000, 1999.
Moser, M. and Hohensinn, F.: Geotechnical aspects of soil slips in Alpine regions, Engineering Geology, 19, 185–211, 1983. Okura, Y., Kitahara, H., Sammori, T., and Kawanami, A.: The effect
of rockfall volume on runout distance, Engineering Geology, 58, 109–124, 2000.
Puigdef´abregas, C., Mu˜noz, J. A., and Verg´es, J.: Thusting and fore-land basin evolution in the Southern Pyrenees, in: Thrst tecton-ics, edited by McClay, K., Chapman and Hall, London, 247–254, 1992.
Ramsey, W. J. H.: Sediment production and transport in the Phewa Valley, Nepal, in: Erosion and Sedimentation in the Pacific Rim, edited by R. L. Beschta, Blinn, T., Grant, G. E., Ice, G. G., and Swanson, F. J., IAHS Publ., 165, 461–472, 1987.
Rapp, A. and Nyberg, R.: Alpine debris flows in Northern Scandi-navia, Geografiska Annaler, 63A, 183–196, 1981.
Reneau, S. L. and Dietrich, W. E.: Size and location of colluvial landslides in a steep forested landscape, in: Erosion and Sedi-mentation in the Pacific Rim, edited by Beschta, R. L., Blinn, T., Grant, G. E., Ice, G. G., and Swanson, F. J., IAHS Publ., 165, 39–48, 1987.
Rickenmann, D.: Empirical relationships for debris flows, Natural Hazards, 19, 47–77, 1999.
Rickenmann, D. and Zimmermann, M.: The 1987 debris flows in the Switzerland: documentation analysis. Geomorphology, 8, 175–189, 1993.
Scheidegger, A. F.: On the prediction of the reach and velocity of catastrophic landslides, Rock Mechanics, 5, 231–236, 1973. Sidle, R. C., Pearce, A. J., and O’Loughlin, C. L.: Hillslope stability
and land use, Water Resources Monograph Series 11, American Geophysical Union, Washington D.C., 1985.
Straub, S.: Predictability of long runout landslide motion: implica-tions for granular flow mechanics, Geol. Rundsch., 86, 415–425, 1997.
Takahashi, T.: Estimation of potential debris flows and their haz-ardous zones; soft countermeasures for a disaster, J. Nat. Disaster Sci., 3, 57–89, 1981.
Takahashi, T.: Debris flows, Balkema, Rotterdam, 1991.
Takahashi, T., Ashida, K., and Savai, K.: Delineation of debris flow hazard areas: Erosion and sediment transport in Pacific Rim steeplands, IAHS Publ., 132, 589–603, 1981.
Tishchenko, A. S.: Debris-flow activity in Transcarpathia due to heavy rains in autumn 1998, in: Debris-flow hazards mitigation: Mechanics, prediction and assessment edited by Wieczoreck, G. F., and Naeser, N. D., Balkema, Rotterdam, 2000.
Vandre, B. C.: Rudd Creek debris flow, in: Delineation of landslide, flash flood and debris flow hazards in Utah, edited by Bowles, D. S., Utah Water Res. Lab., Logan, Utah, 1985.
Van Steijn, H.: Debris flow magnitude-frequency relationships for mountainous regions of Central and Northwest Europe, Geomor-phology, 15, 259–273, 1996.
Varnes, D. J.: Slope movements, type and processes, in: Landslide analysis and control, edited by Schuster, R. L. and Krizek, R. J., Transportation Research Board, National Academy of Sciences, Special Report 176, Washington D.C., 1978.
Wieczorek, G. F.: Effect of rainfall intensity and duration on debris flows in central Santa Cruz Mountains, California, in: Debris flows/avalanches: Process, recognition and mitigation, edited by Costa, J. E. and Wieczorek, G. F., Geological Society of Amer-ica, Reviews in Engineering Geology, 7, 93–104, 1987.
Wieczorek, G. F., Mandrone, G., and DeCola, L.: The influence of hillslope shape on debris flow initiation, in: Debris-flow haz-ards mitigation, mechanics, prediction and assessment edited by Cheng-lung, Ch., Proceedings of First International Conference, ASCE, San Francisco, 21–31, 1997.
White, S., Garc´ıa-Ruiz, J. M., Marti-Bono, C., Valero, B., Er-rea, M. P., and G´omez-Villar, A.: The 1996 Biescas campsite disaster in the Central Spanish Pyrenees and its spatial and tem-poral context, Hydrological Processes 11, 1797–1812, 1997.