HAL Id: hal-01893912
https://hal.archives-ouvertes.fr/hal-01893912
Submitted on 9 Apr 2021
HAL is a multi-disciplinary open access
archive for the deposit and dissemination of
sci-entific research documents, whether they are
pub-lished or not. The documents may come from
teaching and research institutions in France or
abroad, or from public or private research centers.
L’archive ouverte pluridisciplinaire HAL, est
destinée au dépôt et à la diffusion de documents
scientifiques de niveau recherche, publiés ou non,
émanant des établissements d’enseignement et de
recherche français ou étrangers, des laboratoires
publics ou privés.
Effects of nitrogen limitation on growth and nitrite
excretion rates of the dinoflagellate Prorocentrum
minimum
A. Sciandra, R. Amara
To cite this version:
A. Sciandra, R. Amara. Effects of nitrogen limitation on growth and nitrite excretion rates of the
dinoflagellate Prorocentrum minimum. Marine Ecology Progress Series, Inter Research, 1994, 105,
pp.301 - 309. �10.3354/meps105301�. �hal-01893912�
Effects of nitrogen limitation on growth and
nitrite excretion rates of the dinoflagellate
Prorocen trum minim um
Antoine Sciandra, Rachid Amara
Observatoire des Sciences de l'univers, Station Zoologique URA CNRS 716, Universite Paris VIIINSUICNRS, BP 28, F-06230 Villefranche-sur-Mer, France
ABSTRACT: Continuous nitrate-limited cultures of the dinoflagellate Prorocentrum minimum were grown under saturating photon flux densities to study the effects of nitrate pulses on the time variations of nitrate uptake, nitrite excretion, and cell division rate. In the first experiment, 5 chemostats were sta- bilized at the same dilution rate and, after stopping of the renewal supplies, received successively 1 pulse of nitrate at 24 h intervals. In the second, nitrate pulses were added about every 12 h in 1 chemostat. In the third experiment, 4 chemostats stabilized at different growth rates received 1 pulse of nitrate. Nitrate uptake process showed decreasing initial rates and lower maximum rates in cultures subjected to longer starvation times. In all cases, the amount of nitrite excreted before reabsorption represented an important proportion of the initially supplied nitrate (up to 45 %). This suggested that for nitrogen-deprived cells of L? minimum reduction of nitrite by the nitrite reductase is the more limit- ing step in the nitrateassimilatory pathway. The proportion of pulsed nitrate which is excreted as nitrite increased for decreasing growth rates. For 1 and 2 d of nitrate deprivation, the ratio nitrite excretion ratehitrate uptake rate integrated during each perturbation experiment increased, but decreased after longer times of starvation. This suggests that the processes of nitrate uptake and nitrite reduction are affected at different rates during nitrogen deprivation. The implications of nitrite excretion in N-limited cells on the determination of new production are discussed.
KEY WORDS: Prorocentrum minimum . Nitrite excretion . Assimilation . Nitrite pulses
INTRODUCTION
Among the different forms of dissolved inorganic nitrogen which are assimilated by phytoplankton (ammonia, nitrate and nitrite), nitrite has been the least investigated. Simultaneous measurements of nitrate and nitrite (Carlucci et al. 1970, Kiefer et al. 1976, Har- rison & Davis 1977, Laws & Wong 1978, Serra et al. 1978a, b, Olson et al. 1980, Collos 1982, Martinez 1991) have shown that nitrite excretion is a phenomenon of importance for the following 2 reasons. Firstly, the pro- portion of absorbed nitrate which is excreted as nitrite can be important; secondly, nitrite excretion is an indi- cation of the uncoupling which can exist between the transport and assimilation of nitrate.
Nitrite excretion is a phenomenon which, parallel to studies on bacteria, was evoked to explain the pro-
longed presence of a nitrite peak frequently associated with the nitracline and with the chlorophyll maximum found in certain oceanic regions: north and south of the equator in the Pacific (Hattori & Wada 1971, Wada &
Hattori 1971) and on the North Atlantic coast (Vaccaro
& Ryther 1960). A simple box model was adapted and calibrated experimentally by Kiefer et al. (1976) for a central North Pacific region. Their results suggested that nitrate reduction by phytoplankton was sufficient to explain the peak of nitrite associated with the chlorophyll maximum. Generally, there are several conditions which are necessary for the establishment of a nitrite peak; sufficient algal biomass, a reduced illumination found below the compensation depth, and a substantial nitrate supply.
The nitrate and nitrite reductases involved in the conversions nitrate+nitrite and nitritejammonia 0 Inter-Research 1994
302 Mar. Ecol. Prog. Ser. 105: 301-309, 1994
have been well characterized in phytoplankton (Grant 1970, Syrett 1981) but their regulation is not well known. If the excreted nitrite originates directly from absorbed nitrate, then the rate of nitrate reductase activity is greater than that of nitrite reductase. This means that nitrite reduction is the most limiting factor in the transport and reduction processes.
The first steps in the assimilation of nitrate involve reductive enzymatic reactions. In photosynthetic or- ganisms, all ATP and reducing power ultimately come from photosynthesis. This can occur directly through the photosynthetic phosphorylation of ADP a n d reduced ferredoxin or indirectly through the res- piration of previously fixed carbon compounds. Turpin (1991) has clearly presented the complex rela- tions between photosynthetic production of carbon skeletons and reductants and their employment in the assimilation of inorganic nitrogen. Since photo- synthesis and inorganic nitrogen absorption are closely coupled (Grant 1968, Grant & Turner 1969, Turpin et al. 1988, Smith et al. 1992), it is difficult to explain the regulations imposed upon assimilation when growth is nitrogen limited. Under stable condi- tions, photosynthetic activity is defined by the degree of nitrogen limitation (Li & Goldman 1981), but it is not clearly known how the availability of nitrogen affects photosynthesis.
We looked for the relationships existing between nitrite excretion and nitrogen limitation under constant a n d saturating light conditions for the dinoflagellate Prorocentrum minimum. These experiments are based on those reported in a n earlier study where it was found that the uncoupling between the inorganic nitrogen uptake rate and the growth rate increased when the nitrogen deprivation was prolonged (Scian- dra 1991). Since the sum of nitrate a n d nitrite concen- trations was dosed, it was impossible to judge whether only the uptake was affected or whether assimilation was also involved. By simultaneously monitoring pro- longed and continuous time series of nitrate uptake a n d nitrite excretion during the present study, it has been possible to follow the temporal effects of nitrogen deprivation on the uptake and assimilation processes, and to dscriminate their respective importance from a dynamic point of view.
MATERIALS AND METHODS
The chemostats were cylindrical, double-walled glass containers with a capacity of 1.8 1. In all experi- ments the temperature was controlled by a thermostat set at 18 "C. Reversible magnetic stirrers were used to ensure homogeneous cultures (80 rpm and reversals every minute). Aeration was provided via filtration
through activated charcoal and a Whatman filter (0.1 pm). Continuous illumination was provided by 2 mercury lamps, and the intensity was measured by a probe (Biospherical Instrument, Inc., model QSL100) placed at the center of the containers. A Gilson peri- staltic pump supplied the cultures with medium. Vol- ume accuracy was controlled with a debit meter (Cole- Parmer Instruments). The nutritive medium was prepared using seawater obtained at 600 m depth and 3 miles from the Station Zoologique. The seawater was stored in the dark at 15'C until neither nitrite nor nitrate residues were detectable using a Technicon Analyser I1 (Treguer & Le Corre 1975). Before use, the seawater was filtered through Whatman GF/F, and autoclaved a t 105 'C for 30 min. After cooling to room temperature, the seawater was enriched with f/4 medium (Guillard & Ryther 1962) which had been sterilized and nitrate- and phosphate-depleted. Final nitrate concentration was adjusted to 45 yg-at. N-NO3 f 3 % I-'. Phosphate was added to obtain a final N : P ratio of 14. The supply medium was replaced every 4 d. Although precautions were employed to ensure sterile conditions, the cultures were not axenic d u e to inher- ent problems with long-term culturing. Bacterial growth was, however, checked using DAPI, and found to be negligible.
The culture system used (Malara & Sciandra 1991) permits the automatic sampling of nitrate and nitrite. Samples were also analyzed for the presence of am- monia, but results were negative. A HIAC particle counter (Pacific Scientific) was part of the culture sys- tem and established a spectrum of particles distrib- uted into 12 size classes. Cell number and volume were calculated from the means of 3 consecutive mea- surements, and the maximum variation was 2 %. Mea- surements were taken every 8 h during all of the experiments.
Expt A. Five chemostats (Cultures A1 to A5) were aliquoted with 1.4 1 of Prorocentrum minimum (Culture Collection UTEX, Austin, TX, USA) containing 2.3 X 10⁷ cells I-' in an exponential growth phase. The pho- ton flux density (PFD) varied from 235 to 250 pm01 m-2 S-' in the different experiments. With the introduction of additional medium to each chemostat, the maximal volume of 1.8 1 was attained a n d the dilution rate became 0.12 d-l. When equilibrium was established in the 5 chemostats, supply medium renewal was stopped (to). A pulse of 9 pg-at. N-NO3 1-' was then injected successively to the 5 cultures a t ca 24 h intervals. The first sampling for nitrate and nitrite measurements was made 1 min after the pulse to allow for efficient mixing. Expt B. A chemostat culture was stabilized at a growth rate of 0.052 d - l . PFD was 190 pm01 m - 2 S - ' , a n d temperature was 18°C. At to, the renewal supply medium was replaced with the same medium but lack-
ing nitrate. Pulsing with nitrate then took place every 12 h. The mean concentration of pulsed nitrate was equivalent to that supplied in continuous culturing.
Expt C. Lighting conditions were as in Expt B. Four chemostats (Cultures C1 to C4) were supplied with renewal medium a t different dilution rates. When equilibrium was reached in each chemostat (i.e. p = 0.05, 0.13, 0.18 or 0.29 d - l ) , 1 nitrate pulse was deliv- ered to each culture.
RESULTS Expt A
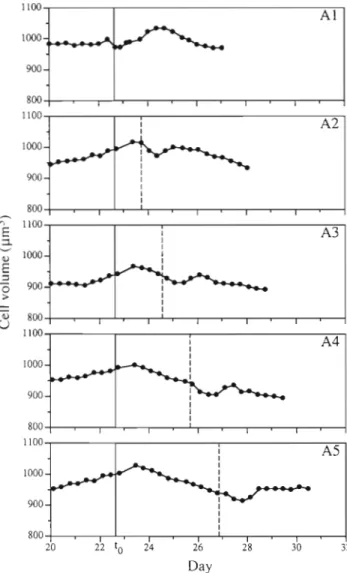
After Day 21, algal densities varied by only 15% among cultures. On Day 22, biomass was stable and equilibrium was attained with growth being limited by the nitrogen supply (p = 0.12 d - l ) . At this time (t,), the medium supply was stopped, and Cultures A1 to A5 were successively supplied with a nitrate pulse at 1 d intervals. Fig. 1 shows that the cell volume varied within a small range (5 % ) . Consequently, cell number can be used to estimate the population biomass and to calculate the growth rate from:
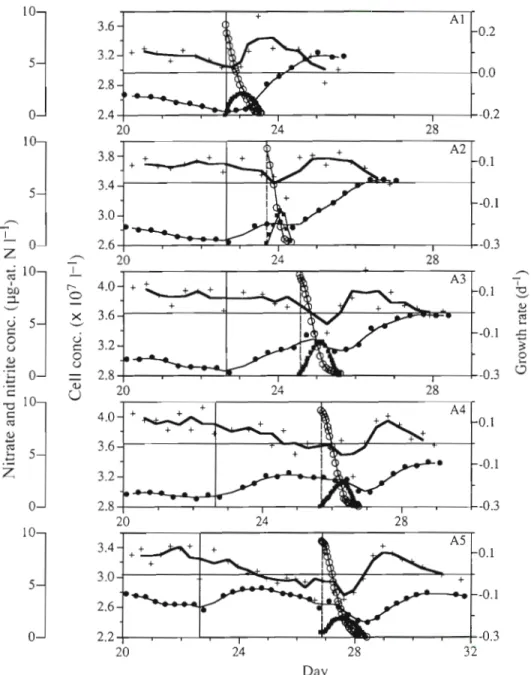
where n, and n, = algal density at time t , and t2, respectively, and d = dilution rate. In all cases, algal density increased when dilution was arrested (Fig. 2). The growth rate became negative in Cultures A2 to A5 within 2 d after to. In Culture A l , the growth rate remained positive due to the nitrate pulse at to. In all cultures, the nitrate pulses induced a positive growth rate after varying lengths of time. In Culture A l , the growth rate was even superior to that obtained during continuous culturing conditions. The essential differ- ence between the experiments was due to the increase in lapsed time between the nitrate pulse and the growth rate maximum, which occurred in Cultures A1 through A5.
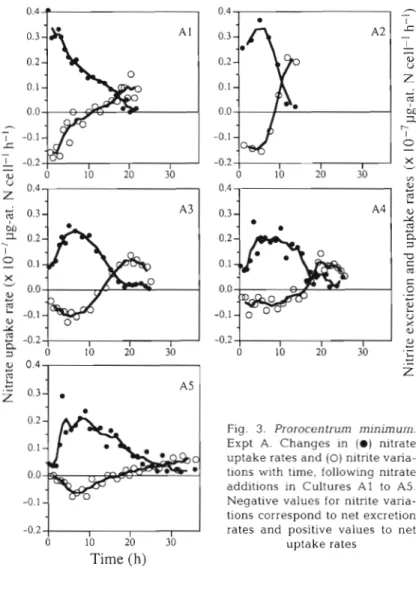
Fig. 2 shows the uncoupling between nitrate con- sumption and cell division. In Cultures A2 to AS, al- gal density did not increase until the pulsed nitrogen was completely consumed. The nitrate uptake was accompanied by nitrite excretion, which amounted to a s much a s 35% of the injected nitrate. A reabsorp- tion of nitrite occurs when the concentration of nitrate drops below 1 pg-at. N 1-l. The rates of absorption and excretion were not the same in the chemostats (Fig. 3) but a common characteristic was noted in all; i.e. initial rates and maxima recorded during each pulse diminished in Cultures A1 to A5. For Cultures A3 to A5, the maximum rates measured for each per-
Fig. 1. Prorocentrum minimum. Expt A. Cell volume over time as affected by cessation of supply medium renewal (to: verti- cal solid line) and after nitrate pulses (vertical dashed line). In A l , cessation and nitrate pulse took place simultaneously
turbation were less than 7 3 the maximum rates found in Culture A l . In Culture A1 ( p = 0.12 d - l ) , the maxi- mum nitrate uptake rate was 0.41 X 1 0 - ~ pg-at. N cell-' h-' which is the same order of magnitude re- ported earlier for nitrate and nitrite absorption (0.40 X lO-? pg-at. N cell-' h-') with a growth rate of 0.17 d - ' (Sciandra 1991). One also sees in Fig. 3 a symmetry in absorption and excretion for all cultures; high initial absorption rates correspond to high initial nitrite excretion rates and vice versa. Finally, the maxima of nitrite excretion and nitrate absorption oc- cur at the same time. The series of data obtained from Culture A3, which are most complete and show the least amount of background noise, illustrates in detail the non-linearity of the processes. The rates of excretion and absorption are low at the beginning of
304 Mar. Ecol. Prog. Ser. 105: 301-309, 1994
the perturbation. In the first phase, a n induction phase greater than 5 h was necessary before the rates attained their maximum. In the second phase, the de- cline in nitrate absorption was concomitant to that of nitrite excretion. In the third phase, nitrite reabsorp- tion became important, whereas nitrate uptake was maintained a t a low level.
Expt B
Fig. 4 shows nitrite excretion and nitrate absorption in a continuous culture supplied with nitrate pulses at
Fig. 2. Prorocentrum mini- mum. Expt A. Details of cell concentrations (O), growth rates (+), nitrate (0) and nitrite (W) concentrations after the cessation of supply medium (vertical solid llne), and after nitrate pulses (vertical dashed line). Time changes of cell con- centrations and growth rates are respectively smoothed by 2nd (thin lines) and 3rd order (thick lines) moving averages
short intervals. Up to the 6th pulse, the decrease in algal density was the consequence of a n increasing dilution rate; the renewal rate of the culture did not compensate the sampling used for nitrate, nitrite, and algal density measurements. The chemostat volume decreased from 1.8 to 1.5 1 between t o and t = 3.4 d , when the medium renewal was discontinued. As in Expt A, an important proportion of injected nitrate was transformed to nitrite during the first 2 pulses. As of the 3rd pulse, the nitrate continued to be absorbed, but less rapidly, while the net nitrite excretion approached zero since the external concentration ceased to change after Day 2.
Expt C 0.4
A l The evolution of nitrate and nitrite after
the pulses (data not shown) showed quali- tatively the same 3 phases a s in Expt A: (1) absorption of nitrate and nitrite excretion; (2) nitrate uptake reduced as reabsorption of
-
nitrite commenced; and (3) simultaneous -0.1- absorption of residual nitrate and nitrite.Fig. 5 shows that the proportion of the nitrate o 10 20 30 I
"
0.4supplied which was excreted as nitrite was
inversely related to the growth rate. 0.3 A3
served, which proves that nitrate is rapidly reduced to nitrite. The results from Expt A1 can thus be interpreted by the following: cells which have been subjected to a small
M 1 0.2
.
I DISCUSSION0
0.1 X V 0.0 In Culture A 1 (Fig. 3), the absorption rate , continuously decreased, although the added5
-0.1 pulse of nitrate was well above the half-2 -0.2
saturation constant. This was probably due 0 10 20 30 to negative internal feedbacks. The products 2 0.4
of reduction steps such as ammonia (Serra et
,S
A50 2 3 4 5 6 2
Time (d)
al. 1978b, Tischner & Lorenzen 1979, Dortch
z
0.3-Fig. 4. Prorocentrum minimum. Expt B. Variations in con- centration of ( 0 ) cells, (@) nitrate and ).( nitrite, following repeated additions of nitrate (vertical lines) into Culture B
m m
Time (h)
Fig. 3. Prorocentrum minimum. Expt A. Changes in ( 0 ) nitrate uptake rates and (0) nitrite varia- tions wlth time, following nitrate additions in Cultures A1 to A5. Negative values for nitrite varia- tions correspond to net excretion rates and positive values to net
uptake rates et al. 1991) and nitrite (Eppley & Coatsworth 0.2
-
1968) can inhibit permeases, as well as the
0.1- products arising from the assimilation of
inorganic pools (Guerrero e t al. 1981). Direct 0.0- inhibition by internal nitrate, comparable to
-0.1
-
Growth rate (d-l) the reversible kinetics shown by ammonia
(La Roche & Harrison 1989), is not probable -0.2
Fig. 5. Prorocentrum minimum. Expt C. Ratio of the maximum nitrite and initial nitrate concentrations (R) compared with the growth rate measured for each perturbation experiment. R values are also reported for the flrst perturbations of Expts A and B for which the steady-state growth rates were equal to
the dilution rates
I I
306 Mar. Ecol. Prog. Ser. 105: 301-309, 1994
degree of nitrate limitation retain a substantial capac- ity to transport nitrate compared with their ability to assimilate it. Transport inhibition occurs through pro- gressive accumulation of factors issuing from reduction processes. The rest of Fig. 3 demonstrates that pro- longed nitrogen deprivation has a negative effect on nitrate uptake. Relationships have been established between the degree of deficiency and nitrate uptake (Dortch et al. 1982, Parslow et al. 1984, Cochlan & Har- rison 1991), but the regulations are complex and not well defined. The permeases might be degraded dur- ing the periods of deficiency a n d resynthesized d e novo upon reintroduction of nitrate in the medium (Neyra & Hageman 1975). It follows that the induction time required for d e novo synthesis of permease depends on the degree of nitrate deficiency and could explain why both initial transport of nitrate and excre- tion of nitrite are increasingly affected by longer times of starvation.
The term 'nitrite excretion' corresponds to an out- ward passive or active flux superior to a n inward flux, which can be simultaneous. Nitrite excretion in Proro- centrum minimum is a non-negligible process which depends upon the degree of nitrogen limitation (Fig. 5). In view of the kinetic symmetries shown in
Fig. 3, the excreted nitrite derives from the absorbed nitrate. The nitrite reduction step can thus be more limiting than uptake and reduction of nitrate, contrary to conclusions advanced for other species. The release of nitrite by phytoplankton has been observed experimentally for diatoms and flagellates, and for natural communities (see references cited in the 'Introduction'). Our data conform to what is typically observed; (1) nitrite ex- cretion occurs when an excess amount of nitrate is provided to nitrate-limited cells;
(2) nitrite accumulates in the milieu during nitrate absorption, and (3) as the nitrate con- centration decreases to critical levels rang- ing from 0.5 to 3 pg-at. 1-', the uptake of nitrate slows down and the nitrite is reab- sorbed. At the end of the incubation, nitrate 1 U
Time ( h ) and nitrite are taken up simultaneously until exhaustion.
0.5
In view of the literature, the rate of nitrite
0.0 excretion shows considerable amplitude dif-
~ i6, Prorocentrum ~ , ferences among species. It is not easy to state
0.2
0-3m
Expt A. Time change of the if these variations are species specific; firstly 0.1 ass1rni1ation rate (9) and Of the the nitrite dynamics by phytoplankton haveratio nitrite excretion rate with not received extensive analysis and the 0.0 nitrate uptake rate ( 0 ) during
o 10 20 30 the perturbation Expts to existing studies have mostly been carried out
Time ( h ) with diatoms. Secondly, strong differences
are observed for the same species. This intraspecific variability can be explained by assuming that nitrite dynamic results from the combi- nation of the uptake and reduction processes which a r e each regulated by the interdependent C and N metabolisms. Under light-limited conditions, the de-
gree of nitrogen deprivation influences the release of nitrite. Laws & Wong (1978) argued that the release of nitrite by phytoplankton during nitrate spike experi- ments occurs commonly when cells have not been pre-
viously conditioned to assimilate nitrate rapidly. Nitrite excretion is a transient response resulting from a sud- d e n increase in uptake rate. Serra et al. (1978a) equally observed that when N-deficient cells of Skeletonema costatum were preincubated for 4 h with nitrate, the
release of nitrite was less (although the nitrate uptake
was higher) than without preincubation. Highest excretion rates in cells of S. costatum have been measured after 36 h of N starvation (Martinez 1991);
shorter and longer periods of starvation lead to less
important release of nitrite. Fig. 4 shows that when N- limited cells have been preconditioned by 2 daily addi- tions of nitrate, the release of nitrite does not occur if further additions are performed. This can be explained by the fact that the assimilation rate is enhanced when the cells are conditioned by previous nitrate additions. On the other hand, Fig. 4 could support the hypothesis
that the accun~ulation of external nitrite inhibits fur- ther nitrite excretion as suggested by Kiefer et al. (1976). Our data shows that an accumulation of exter- nal nitrite is accompanied by an important decrease in nitrate absorption after the 3rd pulse. As a n explana- tion, one could consider a competition of nitrate and nitnte for the same enzymatic sites (Eppley & Coatsworth 1968, Bilbao et al. 1981, Olson et al. 1980). However, one can equally suggest the aforemen- tioned, that internal nitrite accumulates and subse- quently inhibits the nitrate permeases. One cannot exclude the possibility that both mechanisms coexist.
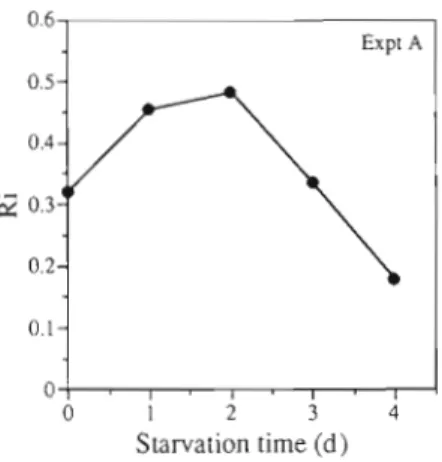
The assimilation rate, calculated as the difference between nitrate uptake and net nitrite excretion rates (Fig. 6 ) , attains a maximum identical value in Cultures A3, A4 & A5. This suggests that 2 d of nitrogen depri- vation is sufficient to significantly reduce the level of nitrite reductase activity in N-limited cells, and that more prolonged deprivation does not lead to increased reduction. Fig. 6 shows that the net release of nitrite decreases more rapidly than the nitrate uptake, sug- gesting a readjustment of the nitrite reductase activity due to nitrate addition. Fig. 7 shows the combined data from Expt A. The change in the ratio of these processes integrated for each experiment is not uniform during the increasing periods of deprivation in Cultures A1 to A5. This suggests that transport and reduction limit the assimilation at different times after the onset of N star- vation. When the ratio increased, the nitrite reduction became more limiting than nitrate uptake, and vice versa.
The nitrite maximum, often observed just below the nitracline where photosynthesis can be limited, has been interpreted principally a s a cellular incapacity to reduce nitnte to ammonia d u e to a deficit of photo-
0.6 Expt A 0.5- 0.4- 0.2- Starvation time (d)
Fig. 7. Prorocentrum minmum Expt A . Effect of nitrogen deprivation on Ri, calculated as the integral of the ratio excre- tionhptake rates shown in Fig. 6 during each perturbation
experiment
generated reductants (Tischner & Lorenzen 1979). Low levels of irradiance have usually been shown as a major condition for nitrite excretion. Using Skeletonema costa- tum, Vaccaro & Ryther (1960) showed that the highest concentrations of nitrite were produced in the dark a n d that the amount decreased progressively as the PFD increased. For cultures of the same species starved for 36 h and grown at low PFD (50 pm01 m - 2 S ' ) , Martinez (1991) found that 35% of the nitrate consumed was excreted as nitrite. For N-starved cultures of Monochry- sis lutheri, Dunaliella tertiolecta and Thalassiosira al- lenii, Laws & Wong (1978) observed a more rapid nitrite release during the night than the day. Collos (1982) reported the same tendency with nitrate-growing cells of Phaeodactylum tricornutum.
As internal carbon and nitrogen were not measured in our experiments, we have no real index of growth limitation, even if it is reasonable to consider that the degree of nitrogen limitation increased with the time of N starvation. Nevertheless, since cell carbon a n d cell volume are generally well correlated (Thompson et al. 1991), Fig. 1 can be considered as appropriately repre- senting the time variation of cell carbon in Expt A . In all cultures except Culture A l , the cell volume decreased 24 h after the beginning of the starvation period. Nitrate pulses led to a small, transient but sig- nificant increase of the cell volume approximately 24 h later, which probably corresponded to a parallel in- crease in cell carbon.
Our data show that nitrite excretion may reach high rates although the irradiance level is potentially satu- rating for photosynthesis (Harding et al. 1987). Due to a reciprocal coupling of nitrogen assimilation a n d carbon incorporation pathways (Turpin 1991), any deficiency in one or the other pathway induces a readjustment of the other. It is probable that nitrogen starvation placed the cells in a physiological state were they could not actually use the light. Either or both the light or dark systems are likely to be operat- ing less efficiently after N deprivation (Falkowski e t al. 1989). When inorganic nitrogen was resupplied after starvation, the cells readjusted not only their nitrogen pathways for d e novo enzyme synthesis, but also their photosynthetic apparatus to provide neces- sary reductants. These results underline the difficulty of defining a real index of growth limitation. Times of nitrogen deprivation used in this study cannot be used in comparing works by others because the past his- tory of carbon metabolism modulates the effects of deprivation. Since carbon and nitrogen metabolisms are not separable, the definition of 1 limiting factor (the factor that enhances growth if it is supplied in the medium) is ambiguous. When Prorocentrum minimum is resupplied with nitrate after nitrogen starvation, the assimilation and consequently the growth is limited
Mar. Ecol. Prog. Ser. 105: 301-309, 1994
LITERATURE CITED
by factors provided by the carbon pathways, and dur- Ackno*vledgernents. We thank Gilbert Malara for his techni-
ing a transient phase the carbon becomes the limiting cal assistance and Patnck Chang for the English. We also
factor. thank the anonymous reviewers for their valuable comments.
This re search was supported by funds from the Programme
A major consequence of the release of external National Environnement 'ModBles, Methodes et ThBories' nitrite by N-limited cells may lead to biased estima- and by CNRS (Ddpartement TOAE; UA716: Ecologie du
tions of the new production and the f ratio (Dugdale & Plancton Marin).
Goering 1967). In stratified situations, nitrate arising
from deep waters is principally absorbed at depths where growth is light and/or nitrate h i t e d . At the onset of the incubations on the deck, cells are gener- ally submitted to an increase of nutrients large enough
to obtain accurate kinetics, and are then exposed to nitrite excretion. When using the 15N isotope tech- nique, or if nitrate is not monitored separately from nitrite with a colorirnetric method, the true transport
rate of nitrate may be underestimated during the time
where nitrite is excreted, and overestimated when NO2 is reabsorbed (Collos 1982). The bias may be important because the amount of excreted nitrite may reach a
great proportion of the added nitrate (about 50 % in our
experiments), and also because the 12 to 24 h tradi- tionally used for deck incubations are of the same mag- nitude required for the cells to recover a steady state.
Our results show that the nitrite excretion is related to
the degree of nitrogen limitation. Estimations of new production may be more biased in well-stratified regions than in young upwelling areas.
Another implication of this work is to emphasize the difficulty in providing a theoretical framework of phytoplankton dynamics in a changing nutrient envi- ronment. A deterministic approach utilized in many types of models has resulted in a phenomenological
representation of the processes. Unfortunately, the level of complexity of the models employed does not
take the dynamics of interacting cellular components fully into account, due to modeling constraints. This
would be less of a problem if the qualitative aspect of the dynamics did not play such an important, if indeed not more important, role compared to the quantitative exchanges of material. The aforementioned mathe-
matical insufficiency is paradoxical, because biological models are now coupled with physical models which
allow one to take the diverse nitrate supplies ifito
account. The paradox Lies essentially in the theoretical
representation of biological processes which still employ equations (for example Michaelis-Menten relationship) which describe experimental processes under stationary conditions. These equations do not
adequately describe situations where the external variability stimulates adaptive processes of the species. Another bias, inherent to a phenomenological concept of modeling, is equally introduced when independent formulations are given to model nitrogen assimilation
and carbon fixation separately, which, in reality, are
intrinsically associated.
Bilbao, M . , Gabas, J . M . , Serra, J. L. (1981). Inhibition of nitrite uptake in the &atom Phaeodactylurn tricornuturn by nitrate, ammonium ions and some L-amino acids. Biochem. Soc. Trans. 9: 476-477
Carlucci, A. F., Hartwing, E. O., Bowes, P. M. (1970). Bio- logical production of nitrite in sea water. Mar. Biol. 7:
161-166
Cochlan, W. P., Harrison, P. .I. (1991). Uptake of nitrate, ammonium, and urea by nitrogen-starved cultures of Micromonas pus~Ua (Prasinophyceae): transient re- sponses. J. Phycol. 27: 673-679
Collos, Y. (1982). Transient situations in nitrate assimilation by marine diatoms. 11. Changes in nitrate and nitrite following a nitrate perturbation. Limnol. Oceanogr. 27: 528-535
Dortch, Q., Clayton, J. R., Thoresen, S. S., Bressler, S. L., Ahmed, S. I. (1982). Response of marlne phytoplankton to nitrogen deficiency: decreased nitrate uptake vs. enhanced ammonium uptake. Mar. Biol. 70: 13-19 Dortch, Q., Thompson, P. A., Harrison, P. J. (1991). Short-term
interaction between nitrate and ammonium uptake in Thalassiosira pseudonana: effect of preconditioning nitro- gen source and growth rate. Mar. Biol. 110: 183-193 Dugdale, R. C., Goering, J. J (1967). Uptake of new and
regenerated forms of nitrogen in primary productivity. Limnol. Oceanogr. 12: 196-206
Eppley, R. W., Coatsworth, J. L. (1968). Uptake of nitrate and nitrite in Ditylurn brightwelh, lunetics and mechanisms. J. Phycol. 4: 151-156
Falkowslu, P. G., Sukenik, A., Herzig, R. (1989). Nitrogen lim- itation in Isochrysis galbana (Haptophyceae). 11. Relative abundance of chloroplast proteins. J. Phycol. 25: 471-478 Grant, B. R. (1968). The effect of carbon dioxide concentration and buffer system on nitrate and nitrite a s s i d a t i o n by Dunaliella tertiolecta. J . gen. Microbiol. 54: 327-336 Grant, B. R. (1970). N~trate reductase in Dunaliella tertiolecta:
isolation and properties. Plant Cell Physiol. 11. 55-64 Grant, B. R., Turner, I. M. (1969). Light-stimulated nitrate and
nitrite assimilation in several species of algae. Comp. Biochem. Physiol. 29: 995-1004
Guerrero, M. G . , Vega, J. M., Losada, M. (1981). The assimi- latory nitrate-reducing system and ~ t s regulation. A. Rev Plant Physiol. 32: 169-204
Guillard, R. R., Ryther, J , H. (1962). Studies of marine plank- tonic diatoms. 1. Cyclotella nana Hustedt and Detonula confervacea (Cleve.) Gran. Can. J. Microbiol. 8: 229-239 Harding, L. W., Fisher, T. R., Tyler, M. A. (1987). Photo-
synthetic physiology of Prorocentrurn rnariae-lebouriae (Dinophyceae) during its subpycnocline transport in Chesapeake Bay J. Phycol. 24: 77-89
Harrison, P. J . , Davls, C. 0. (1977). Use of the perturbation technique to measure nutrient uptake rates of natural phytoplankton populations. Deep Sea Res. 24: 247-255 Hattori, A., Wada, E. (1971). Nitrite reduction and its regulat-
ing processes in the equatorial Pacific Ocean. Deep Sea Res. 18: 557-568
Kiefer, D. A., Olson, J. R., Holm-Hansen, 0. (1976). Another look a t the nitrite a n d chlorophyll maxima in the central North Pacific. Deep S e a Res. 23. 1199-1208
La Roche, J . , Harrison, W. G . (1989) Reversible kinetic model for the short-term regulation of methylanunonium u p t a k e in two phytoplankton species Dunaliella tertiolecta (Chlorophyceae) a n d Phaeodactylum tncornutum (Bacil- lanophyceae) J Phycol 25: 36-48
Laws, E W., Wong, D C . L. (1978) Studies of carbon and nitrogen metabolism by three m a n n e phytoplankton s p e - cies in nitrate-limted continuous culture. J. Phycol. 14: 406-416
Li, W. K. W., Goldman, J. C . (1981). Problems in estimating growth rates of marine phytoplankton from short term I4C assays. Microbiol. Ecol. 7: 113-121
Malara, G., Sciandra, A. (1991) A multiparameter phyto- planktonic culture system driven by microcomputer. J. appl. Phycol. 3: 235-241
Martinez, R. (1991). Transient nitrate u p t a k e a n d assimilation in Skeletonerna costaturn cultures subject to nitrate star- vation under low irradiance. J. Plankton Res. 13: 499-512 Neyra, C A., Hagenian, R. H. (1975). Nitrate uptake a n d
induction of nitrate reductase in excised corn roots. Plant Physiol. 56. 692-695
Olson, R. J . , SooHoo, J B., G e f e r , D. A. (1980). Steady-state growth of the marine diatom Thalassiosira p s e u d o n a n a . Uncoupled kinetics of nitrate uptake a n d nitrite produc- tion. Plant Physiol. 66: 383-389
Parslow, J. S . , Harnson, P. J , Thompson, P. A. (1984). Satu- rated u p t a k e kinetics: transient response of marine diatom Thalassiosira p s e u d o n a n a to ammonium, sllicate or phos- p h a t e starvahon. Mar. Biol 8 3 51-59
Sciandra, A. (1991). Coupling a n d u n c o u p l ~ n g between nitrate u p t a k e a n d growth rate In Prorocentrum minimum (Dinophyceae) under different frequencies of pulsed nitrate supply. Mar. Ecol Prog Ser 72: 261-269
T h s article was submitted to the e d t o r
Serra, J. L , Llama, M. J , C a d e n a s , E. (1978a). Nitrate utiliza- tion by the diatom Skeletonema costatum. I. K ~ n e t i c s of nitrate uptake. Plant Physiol 62: 987-990
Serra. J L , Llama, M. J., Cadenas, E (1978b) Nitrate utiliza- tion by the diatom Skeletonema costatum. 11 Regulation of nitrate uptake. Plant Physiol. 62: 991-994
Smith, G . J., Zunmerman, R C , Alberte, R S (1992). Molec- ular a n d physiological responses of diatoms to variable levels of irradiance a n d nitrogen availability: growth of Skeletonema costatum in simulated upwelling conditions. Lininol. Oceanogr. 37. 989-1007
Syrett, P J (1981). Nitrogen metabolsm in microalgae. In- Platt, T. ( e d . ) Physiological bases of phytoplankton ecol- ogy. C a n Bull. Fish Aquat. Sci. 210: 182-210
Thompson, P. A., Harrison, P. J., Parslow, J . S . (1991). Influ- e n c e of irradiance on cell volume a n d carbon quota for 10 species of marine phytoplankton. J . Phycol. 27: 351-360 Tischner, R., Lorenzen, H. (1979). Nitrate u p t a k e a n d nitrate
reduction in synchronous Chlorella. Planta 146: 287-292 Treguer, P., Le Corre, P. (1975). Manuel d ' a n a l y s e d e s sels
nutntifs d a n s l ' e a u d e mer. Laboratoire d'Oceanologie e t d e C h m i e , Universite d e Bretagne Occidentale, Brest, p . 110
Turpin, D. H. (1991). Effects of inorganic N availability on algal photosynthesis a n d carbon metabolism. J. Phycol. 27: 14-20
Turpin, D. H.. Elrifi, I R., Blrk, D. G . , Weger, H. G., Holmes,
J J. (1988). Interactions between photosynthesis, respira- tion, a n d nitrogen assimilation in m c r o a l g a e . C a n . J. Bot. 66: 2083-2097
Vaccaro. R. F , Ryther, J. H. (1960). Marine phytoplankton a n d the distribution of nitrite in t h e s e a . J. Cons. perm int. Explor. Mer 25. 260-271
Wada, E., Hattori, A. (1971). Nitrite metabolism in the euphotic zone of the Central Pacific O c e a n . Lininol. Oceanogr. 16. 766-772
Manuscript first received: M a y 24, 1993 Revised version accepted. D e c e m b e r 9, 1993