HAL Id: hal-00304220
https://hal.archives-ouvertes.fr/hal-00304220
Submitted on 3 Jun 2008HAL is a multi-disciplinary open access
archive for the deposit and dissemination of sci-entific research documents, whether they are pub-lished or not. The documents may come from teaching and research institutions in France or abroad, or from public or private research centers.
L’archive ouverte pluridisciplinaire HAL, est destinée au dépôt et à la diffusion de documents scientifiques de niveau recherche, publiés ou non, émanant des établissements d’enseignement et de recherche français ou étrangers, des laboratoires publics ou privés.
Variations of O3 and CO in summertime at a rural site
near Beijing
Y. Wang, M. B. Mcelroy, J. W. Munger, J. Hao, H. Ma, C. P. Nielsen, Y. Chen
To cite this version:
Y. Wang, M. B. Mcelroy, J. W. Munger, J. Hao, H. Ma, et al.. Variations of O3 and CO in summertime at a rural site near Beijing. Atmospheric Chemistry and Physics Discussions, European Geosciences Union, 2008, 8 (3), pp.10397-10414. �10.5194/acp-8-6355-2008�. �hal-00304220�
ACPD
8, 10397–10414, 2008 Summertime O3over Beijing Y. Wang et al. Title Page Abstract Introduction Conclusions References Tables Figures ◭ ◮ ◭ ◮ Back CloseFull Screen / Esc
Printer-friendly Version
Interactive Discussion
Atmos. Chem. Phys. Discuss., 8, 10397–10414, 2008 www.atmos-chem-phys-discuss.net/8/10397/2008/ © Author(s) 2008. This work is distributed under the Creative Commons Attribution 3.0 License.
Atmospheric Chemistry and Physics Discussions
Variations of O
3
and CO in summertime at
a rural site near Beijing
Y. Wang1,2, M. B. McElroy1, J. W. Munger1, J. Hao2, H. Ma2, C. P. Nielsen3, and Y. Chen2
1
Department of Earth and Planetary Sciences and School of Engineering and Applied Sciences. Harvard University, Cambridge, Massachusetts, USA
2
Department of Environmental Science and Engineering, Tsinghua Univeristy, Beijing, China
3
Harvard China Project and School of Engineering and Applied Sciences. Harvard University, Cambridge, Massachusetts, USA
Received: 11 April 2008 – Accepted: 6 May 2008 – Published: 3 June 2008 Correspondence to: Y. Wang ([email protected])
ACPD
8, 10397–10414, 2008 Summertime O3over Beijing Y. Wang et al. Title Page Abstract Introduction Conclusions References Tables Figures ◭ ◮ ◭ ◮ Back CloseFull Screen / Esc
Printer-friendly Version
Interactive Discussion Abstract
Large intra-season differences in concentrations of CO and O3 ([CO], [O3]) were
de-tected at Miyun, a rural site north of Beijing, in summer 2006. Despite an increase in mean daytime [CO] from 500 ppbv in June to 700 ppbv in July, mean daytime [O3] dropped from 67 ppbv in June to 50 ppbv in July and August. The observed changes 5
in CO and O3are attributed to the influence of the summer monsoonal circulation that
develops over the North China Plain in July. Photochemical production of O3 is re-duced as a consequence of increased cloudiness during July and August, as indicated by the strong negative correlation observed between [O3] and satellite observations of
cloud optical depth, with cloudiness having little effect on CO. The analysis suggests 10
a strategy for emission controls that could be implemented in an economically efficient manner to minimize the frequency of high levels of O3during summer in Beijing.
1 Introduction
A long standing challenge for scientists and policy makers has been to develop techni-cally and economitechni-cally efficient strategies to regulate emissions of precursors impact-15
ing concentrations of surface O3. Difficulties in addressing this goal relate to uncertain-ties in understanding of factors influencing production and loss of O3 compounded by
the intrinsically non-local and non-linear nature of the problem. The present study is motivated by a desire to obtain high-quality, near-source, long-term, observations of O3 and relevant chemical species in China and to use these data to evaluate atmospheric 20
models.
The paper describes the initial results of such an effort using observations from a surface station at Miyun, a rural site 100 km northeast of Beijing. Variations of O3and CO at Miyun in summer (June, July, and August; JJA) 2006 will be examined and in-terpreted using a three-dimensional global chemical transport model (CTM) validated 25
ACPD
8, 10397–10414, 2008 Summertime O3over Beijing Y. Wang et al. Title Page Abstract Introduction Conclusions References Tables Figures ◭ ◮ ◭ ◮ Back CloseFull Screen / Esc
Printer-friendly Version
Interactive Discussion
2007b). Data for O3 and CTM simulations will be used to develop a understanding of the meteorological factors influencing summertime variations of O3 over Beijing.
Limiting O3to acceptable levels poses a difficult challenge for regulators. Better
under-standing of the relevant physics and chemistry of O3 formation can play an important role in the introduction of cost effective measures to mitigate what has proved to be 5
a difficult problem not only for China but also for other regions of the developed and developing world.
2 Site description
The Miyun site (40◦29′N, 116◦46.45′E) is located at an elevation of about 152 m in
Miyun County (population of about 420 000), about 100 km northeast of the Beijing 10
urban area (Fig. 1a). The terrain to the south of the site falls off gradually to about 90 m in a region characterized by a mix of agriculture and small villages. Mountains rise steeply to the north. The prevailing monsoonal winds switch direction annually from cold, dry, northwesterly in winter to warm, moist, southwesterly in summer. The location was selected to capture the dichotomy between clean continental air and the 15
Beijing urban plume.
The station was established through a collaboration between the Harvard China Project and Tsinghua University. The latter assumed operational responsibility for the station in 2007. The measurements began in November 2004 and included a suite of gases (CO, CO2, O3) complemented by basic meteorological data (temperature,
rela-20
tive humidity, wind speed and direction). The present study focuses on measurements of CO and O3for the summer of 2006.
The instruments are configured to allow precise, high accuracy measurements of the selected gases and are calibrated ultimately to NOAA/GMD primary standards al-lowing the new results to be merged with global trace-gas data sets. Ozone concen-25
trations are measured by UV absorption (Thermo Environmental Instruments Model 49c). Sample air is drawn from an inlet above the roof on an instrument shed 5 m
ACPD
8, 10397–10414, 2008 Summertime O3over Beijing Y. Wang et al. Title Page Abstract Introduction Conclusions References Tables Figures ◭ ◮ ◭ ◮ Back CloseFull Screen / Esc
Printer-friendly Version
Interactive Discussion
above ground level. CO concentrations are measured by infrared absorption (Thermo Environmental Instruments 48 CTL). Sample air is drawn from the same inlet as the O3 sample and pressurized to 10 psi with excess air vented through a backpressure
regulator. The sample is dried by a cold trap held at 2◦C and Nafion drier in series. A
flow controller upstream of the analyzer and a pressure controller downstream maintain 5
constant pressure in the cell and regulate flow. Exhaust air from the analyzer is used to purge the Nafion dryer before venting to the room. Instrument zero is determined by diverting sample air through an oxidizing catalyst to remove CO (Foulger and Sim-monds, 1993) for 3 min every 15 min. Twice daily the instrument gain is determined by supplying NIST traceable standards (Scott-Marrin). In 2005 two standards were used 10
at nominal concentrations of roughly 100 and 500 ppb. In 2006 a third standard at 2500 ppb was added to the system. Concentrations are determined by subtracting the zero value from measured voltage and computing concentration from a quadratic fit to the calibration data. Details of the instruments are described in more detail elsewhere (Munger et al., in preparation).
15
3 Model description
The GEOS-Chem global 3-D model for tropospheric chemistry is employed in the present study to simulate surface concentrations of O3 and CO at the Miyun site. The
model is driven by meteorological data assimilated by the Goddard Earth Observing System (GEOS-4) at the NASA Global Modeling and Assimilation Office (GMAO). The 20
meteorological data include 3-D fields updated every 3 hours for surface fluxes and mixing depths, and every 6 hours for other variables. We use version 7-04-09 of GEOS-Chem (www-as.harvard.edu/chemistry/trop/geos) with a horizontal resolution of 2◦ latitude by 2.5◦ longitude and 30 vertical hybrid eta levels, extending from the
surface to 0.01 hPa. The lowest 2 km is resolved using five layers with midpoints at 60, 25
250, 620, 1200, and 1990 m altitude for a column based at sea level.
-hydrocarbon-ACPD
8, 10397–10414, 2008 Summertime O3over Beijing Y. Wang et al. Title Page Abstract Introduction Conclusions References Tables Figures ◭ ◮ ◭ ◮ Back CloseFull Screen / Esc
Printer-friendly Version
Interactive Discussion
aerosl simulation. The aerosol and oxidant chemistry are coupled through the forma-tion of sulfate and nitrate, heterogeneous chemistry, and aerosol effects on photolysis rates. Photolysis frequencies are computed using the Fast-J radiative transfer algo-rithm (Wild et al., 2000) which allows for Rayleigh scattering as well as for Mie scatter-ing by clouds and aerosols. Simulation of wet and dry deposition follows the schemes 5
developed by Bey et al. (2001). Application and evaluation of the model over China has been described by Wang et al. (2004a; 2004c). The model was spun-up for a 12-month period beginning 1 January 2005 and ran through 2006. Hourly model outputs sampled at the grid box that includes Miyun are used for comparison with observations. Combustion sources of NOx over China were taken from a recent bottom-up
inven-10
tory developed by Zhang et al. (2007) for 2004. The annual total is 17.8 TgNO2 in 2004. This inventory was based on the work of Streets et al. (2001) and included many improvements on both emission factors and energy statistics. The model in-cludes seasonally resolved microbial sources of NOx for China (3.3 TgNO2/yr), which were derived based on multi-year satellite observations of tropospheric NO2columns
15
up to 2000 (Wang et al., 2007a). Combustion sources of CO over China were adopted from the inventory of Streets et al. (2006). This inventory represents annual emissions of CO for 2001 (146 TgCO/yr; Fig. 1b). Anthropogenic emissions of other species (e.g. NMVOCs) over China were taken from the work of Streets et al. (2001). The biomass burning inventory is based on satellite observations of fires by van der Werf 20
et al. (2006), and emission factors from Andreae and Merlet (2001).
4 Variability of O3and CO in summer
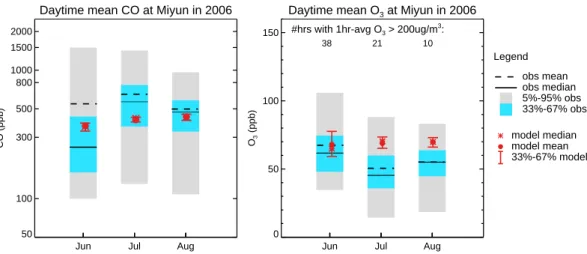
Figure 2 presents monthly means and selected cumulative probability percentiles for daytime (9 a.m.–6 p.m.) mean concentrations of CO (2a) and O3 (2b) observed at
Miyun in JJA 2006. CO is included as a tracer indicating the frequency and magni-25
tude of influences from vehicle emissions and other combustion sources relating to urban pollution plumes, which contribute also to concentrations of O3 precursors,
no-ACPD
8, 10397–10414, 2008 Summertime O3over Beijing Y. Wang et al. Title Page Abstract Introduction Conclusions References Tables Figures ◭ ◮ ◭ ◮ Back CloseFull Screen / Esc
Printer-friendly Version
Interactive Discussion
tably NOx and hydrocarbons. While median CO levels increase by about 300 ppbv (ppbv=nmol mole−1) from June to July, monthly mean concentrations of O
3([O3])
de-crease by 17 ppbv, from 67 ppbv in June to around 50 ppbv in July. The reduction in [O3]
is observed both in peak values and minima. Concentrations of O3and CO observed
in August are similar to values detected in July. In contrast to the maximum in O3 ob-5
served in springtime at Lin An in central-east China (Wang et al., 2002), O3 exhibits
a clear peak in June at Miyun (daytime mean [O3] is 55 ppbv in May, not shown). O3
concentrations were found to peak also in June at a mountain site in the North China Plain (Mt. Tai) (Li et al., 2007). The number of hours in each month with 1-hr average [O3] exceeding 200 µg/m
3
(Chinese air quality standard, corresponding to 102 ppbv) 10
decreases from 36 h in June, to 21 in July, to 10 in August at Miyun. Wang et al. (2006) reported higher [O3] in the summer of 2005 at a site slightly closer to the Beijing urban
center. The correlation between O3and CO used in previous studies to examine the
influences of anthropogenic precursors on O3 (Chin et al., 1994; Parrish et al., 1998) is moderately positive in June (r=0.6), insignificant in July (r=0.1), and weak in August 15
(r=0.4). Although the Figures present only summertime data for 2006, measurements in 2005 and 2007 exhibit similar decreases of [O3] from June to July and August.
Model results sampled at the time of measurements (red) are compared with obser-vations of CO and O3in Fig. 2. Although the model is limited in resolution (2◦×2.5◦) and
restricted by the accuracy of emission inventories, it succeeds in capturing the increas-20
ing trend in CO from June to July (Fig. 2a) (although the magnitude is underestimated, as is often the case with comparisons of point measurements with grid-averaged model predictions). The model fails, however, to account for the decrease in O3from June to July and August. It tends to overestimate concentrations for the latter months (Fig. 2b). 4.1 Changes in meteorological conditions from June to July
25
Tropical Rainfall Measuring Mission (TRMM) data (http://disc.sci.gsfc.nasa.gov/data/
datapool/TRMM/) indicate that 85% of annual precipitation for the Beijing region dur-ing 2006 occurred in July and August. Monthly rainfall for July and August 2006 was
ACPD
8, 10397–10414, 2008 Summertime O3over Beijing Y. Wang et al. Title Page Abstract Introduction Conclusions References Tables Figures ◭ ◮ ◭ ◮ Back CloseFull Screen / Esc
Printer-friendly Version
Interactive Discussion
130 mm and 110 mm respectively, as compared to 10 mm for June, suggesting an on-set for rainfall associated with the East Asian monsoonal for the region in July.
Wind directions measured at the site exhibit distinctly different behavior between June and July. Although the prevailing winds were generally southwesterly during both months, northwesterly flows were observed frequently in June but not in July. The 5
decrease in the frequency of northerly flow in July is associated with the full develop-ment of the summer monsoonal circulation which at this time brings moist, southerly, air to the region. In June, 40% of observations sampled at the site included less than 200 ppbv of CO, characteristic of clean continental air masses from the north. This clean air was encountered only during 15% of the time in July, while the majority of 10
the data indicated concentrations of CO exceeding 500 ppbv reflecting the influence of polluted air masses from the Beijing urban area to the south [cf. spatial distribution of CO sources in Figure 1b]. The increase in [CO] observed at Miyun from June to July can be attributed to more frequent transport of urban pollution to the site, consistent with the change in mean wind direction. The observed changes in mean flow pattern 15
are reproduced by the GEOS-4 assimilated meteorology employed by the model. Despite the increasing influence of urban pollution as indicated by [CO], [O3] de-creases in July. Increasing concentrations of CO indicates that dilution of O3 and its
precursors by convective vertical mixing associated with the monsoonal rainfall in July has at most a minor influence. Observed relative humidity (RH) at Miyun was 50% 20
higher in July than in June. For southerly flows, RH was about 50% on average in June, compared with about 80% in July. As expected from the increases in RH and precipitation, cloud optical depth (COD) retrieved from the Moderate Resolution Imag-ing Spectroradiometer (MODIS) instrument abroad the Aqua satellite (Platnick et al., 2003; MYD08 M3, level-3 monthly global product at 1◦
×1◦resolution) over the Beijing-25
Miyun region showed an increase of 83% from an average of 13 in June to 22 in July. Changes in COD, as we shall see, have an important influence on rates for photolysis of key species involved in ozone chemistry.
ACPD
8, 10397–10414, 2008 Summertime O3over Beijing Y. Wang et al. Title Page Abstract Introduction Conclusions References Tables Figures ◭ ◮ ◭ ◮ Back CloseFull Screen / Esc
Printer-friendly Version
Interactive Discussion
4.2 Influences of cloudiness on O3
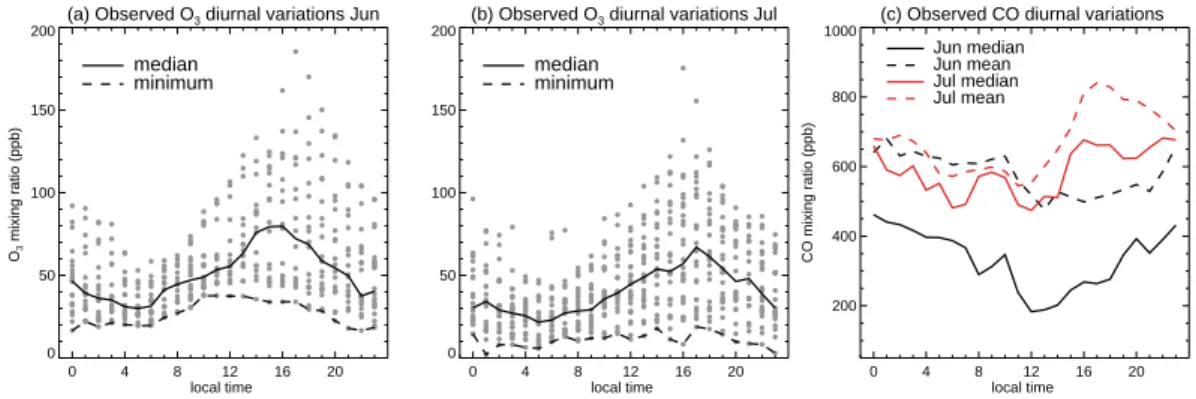
Diurnal variations of O3 measured at Miyun in June and July are presented in Fig. 3a
and b respectively. Highest concentrations of O3 occur typically in the late afternoon. O3 decreases in the evening reaching a minimum around 5am, before sunrise. The
amplitude of the diurnal variation averaged about 50 ppbv in June. The daily O3cycle
5
is driven by net photochemical production of O3 concurrent with transport to the site during the day, offsetting the diluting effect of ventilation. Concentrations of CO in June exhibit a minimum in mid-day associated with the maximum boundary layer height and peak vertical mixing (Fig. 3c). In July, however, concentrations of CO peak in late afternoon (4 p.m.), similar to O3 (Fig. 3c), indicating the arrival of more polluted air,
10
consistent with the change in mean flow pattern. The typical afternoon peak in O3
was not observed during one-third of the measurement days in July. During these days, concentrations of O3were relatively low in the afternoon (below 20 ppbv in many
cases), leading to a flat diurnal pattern with little enhancement in O3 from morning to
afternoon. Days with relatively low afternoon [O3] in July were associated generally with
15
rain or thunderstorm events. RH measured at the site during these days approached 100%.
Photochemical production of O3 is suppressed in the presence of the increased
cloudiness associated with the monsoon rainfall. Transmission of solar radiation be-low cloud level is reduced significantly during these periods with implications for pho-20
tochemical production of O3 near the surface (Lefer et al., 2003; Liu et al., 2006). A
significant negative correlation (r=–0.7, n=29) was found in July between the daily mean COD retrieved from MODIS over the Beijing-Miyun region and mean afternoon [O3] measured at the site (Fig. 4). Relatively low levels of O3were associated usually
with high COD retrieved from MODIS. The temporal correlation between the two inde-25
pendent datasets is impressive, especially since the data were obtained from different platforms and since cloudiness is only one of the factors responsible for regulating lev-els of ozone, supporting the suggestion that the increase in cloudiness in July is
primar-ACPD
8, 10397–10414, 2008 Summertime O3over Beijing Y. Wang et al. Title Page Abstract Introduction Conclusions References Tables Figures ◭ ◮ ◭ ◮ Back CloseFull Screen / Esc
Printer-friendly Version
Interactive Discussion
ily responsible for the decrease in [O3] observed during this month. Since cloudiness has little effect on CO, this can account for the insignificant correlation between CO and O3observed in July.
The model fails to capture the observation of a less pronounced diurnal cycle during periods of precipitation (when afternoon concentrations of O3are comparatively low).
5
COD from the model averages 60% lower than COD retrieved from MODIS in July (Fig. 4), differences extending up to a factor 10 for some low ozone days. The correla-tion between the two datasets is weak (r=0.4). The heterogeneity of COD on the scale of the model grid (2◦
×2.5◦ resolution) is significant, as illustrated in Fig. 4 showing the range of COD retrieved by MODIS over a region of 2◦
×3◦surrounding the Miyun site. In 10
a sensitivity analysis, we scaled model COD at the Miyun grid to match values of COD retrieved from MODIS for the same location, and found a reduction of up to 10 ppbv in afternoon concentrations of O3 simulated by the model during low ozone days. By
comparison, [O3] varied by less than 1 ppbv in conjunction with further sensitivity tests in which we explored other consequences of increased cloudiness, such as increased 15
wet scavenging of soluble O3 precursors (formaldehyde for example). This suggests
that the model underestimate of O3relates primarily to its underestimate of local COD at Miyun, especially during precipitation events. The adjustments in COD implemented in our simple sensitivity test cannot correct for the full extent of the model overestimate. The model, given its relatively coarse resolution, tends to underestimate [NO] and con-20
centrations of other primary pollutants in the urban pollution plume reaching the site, underestimating consequently the titration effect of NO on O3.
The monsoonal cloud system is a more predictable seasonal phenomenon than the scattered cumulus or intermittent frontal passages that control cloudiness in non-monsoonal regions. The model demonstrates the significance of the radiative impact 25
of monsoonal clouds on ozone and explains why observations at other sites in east China do not show a maximum of O3in summer (Wang et al., 2002; Luo et al., 2000).
ACPD
8, 10397–10414, 2008 Summertime O3over Beijing Y. Wang et al. Title Page Abstract Introduction Conclusions References Tables Figures ◭ ◮ ◭ ◮ Back CloseFull Screen / Esc
Printer-friendly Version
Interactive Discussion
4.3 Case study
A two-day period, 18 and 19 July 2006, was selected as a case study of day-to-day variations in O3 and CO as they relate to dynamical and/or chemical factors. Hourly [O3], [CO], and RH observed at the Miyun site during the two days are presented in
Figure 5. Concentrations of O3 were about 35 ppbv on 18 July with little buildup from
5
morning to afternoon. Concentrations of O3 were significantly higher on the following day exhibiting a distinct peak in the afternoon with a maximum of 120 ppbv. RH mea-sured at the site decreased from about 90% on 18 July to 75% on 19 July, consistent with the changes in COD retrieved from MODIS (Fig. 4) indicating a greater influence for rain events on 18 July. [CO] was generally above 600 ppbv throughout the period 10
after a low of 400 ppbv on the morning of 18 July. A modest peak of up to 800 ppbv in the afternoon of 18 July indicates transport of polluted air to the site, but there was no corresponding excursion in [O3]. In contrast, the peak of 1200 ppbv in CO during the
afternoon of 19 July coincided with the peak in O3. The association between changes
in O3, RH and COD suggests that the low O3 levels on July 18 reflected suppression
15
of O3production associated with high COD. Simultaneous peaks in O3and CO around 5 p.m. on 19 July illustrate the significance of O3produced from anthropogenic
precur-sors transported from the Beijing urban area. The shift in the peak of O3 later in the
day (5 p.m.) with respect to the time of maximum sunshine (noon) represents the lag associated with the transport of these precursors.
20
5 Concluding remarks
Large intra-season differences in CO and O3 were detected at Miyun in summer.
De-spite the increases observed in mean daytime [CO], about 200 ppbv from June to July, mean daytime [O3] decreased over the same period by 17 ppbv. Observed changes in CO and O3 are attributed to meteorological influences associated with the summer 25
ACPD
8, 10397–10414, 2008 Summertime O3over Beijing Y. Wang et al. Title Page Abstract Introduction Conclusions References Tables Figures ◭ ◮ ◭ ◮ Back CloseFull Screen / Esc
Printer-friendly Version
Interactive Discussion
in flow pattern associated with onset of the summer monsoonal circulation results in more frequent transport of polluted air from the Beijing urban region to the area of the north represented by Miyun. This change in circulation accounts for the increase [CO] from June to July. The increase in COD associated with the increase in RH and precip-itation in July has an important contrary influence on photochemical production of O3. 5
Transmission of solar radiation to the near surface region is reduced by the presence of optically thick clouds, leading to a decrease in the photochemical production of O3
as reflected in the strong negative correlation of O3with COD observed during July. The analysis suggests that strategies to minimize the incidence of high levels of O3 over Beijing in summer should focus on times when forecast models suggest that
10
upcoming conditions are likely to be relatively cloud-free. Reduction in emissions of O3 precursors during such times are likely to be most effective in limiting the number
of occasions where summertime levels of O3 exceed the existing national Chinese
standard (1-h concentration of 200 µg/m3, or 102 ppbv).
Acknowledgements. This research was supported by the National Science Foundation, grant 15
ATM-0635548, and funds from the Harvard University Smeltzer Fund and an anonymous pri-vate foundation.
References
Andreae, M. O. and Merlet, P.: Emission of trace gases and aerosols from biomass burning, Glob. Biogeochem. Cy., 15, 955–966, 2001.
20
Bey, I., Jacob, D. J., Yantosca, R. M., Logan, J. A., Field, B., Fiore, A. M., Li, Q., Liu, H., Mickley, L. J., and Schultz, M.: Global modeling of tropospheric chemistry with assimilated meteorol-ogy: Model description and evaluation, J. Geophys. Res., 106, 23 073–23 096, 2001. Chin, M., Jacob, D. J., Munger, J .W., Parrish, D. D., and Doddridge, B.G.: Relationship of ozone
and carbon monoxide over North America, J. Geophys. Res., 99, 14 565–14 573, 1994.
25
Foulger, B. E. and Simmonds, P. G.: Ambient temperature gas purifier suitable for the trace analysis of carbon monoxide and hydrogen and the preparation of low-level carbon monoxide calibration standards in the field, Journal of Chromatography A, 630(1–2), 257–263, 1993.
ACPD
8, 10397–10414, 2008 Summertime O3over Beijing Y. Wang et al. Title Page Abstract Introduction Conclusions References Tables Figures ◭ ◮ ◭ ◮ Back CloseFull Screen / Esc
Printer-friendly Version
Interactive Discussion
Lefer, B. L., Shetter, R. E., Hall, S. R., Crawford, J. H., and Olson, J. R.: Impact of clouds and aerosols on photolysis frequencies and photochemistry during TRACE-P: 1. Analysis using radiative transfer and photochemical box models, J. Geophys. Res., 108(D21), 8821, doi:10.1029/2002JD003171, 2003.
Li, J., Wang, Z., Akimoto, H., Gao, C., Pochanart, P., and Wang, X.: Modeling study of
5
ozone seasonal cycle in lower troposphere over east Asia, J. Geophys. Res., 112, D22S25, doi:10.1029/2006JD008209, 2007.
Liu, H., Crawford, J. H., Pierce, R. B., et al.: Radiative effect of clouds on tropospheric chemistry in a global three-dimensional chemical transport model, J. Geophys. Res., 111, D20303, doi:10.1029/2005JD006403, 2006.
10
Luo, C., John, J. C. S., Zhou, X., Lam, K. S., Wang, T., and Chameides, W. L.: A nonur-ban ozone air pollution episode over eastern China: observations and model simulations, J. Geophys. Res., 105(D2), 1889–1908, 2000.
Parrish, D. D., Trainer, M., Holloway, J. S., Yee, L. E., Warshawsky, M. S., Fehsenfeld, F. C., Forbes, G. L., and Moody, J. L.: Relationships between ozone and carbon monoxide at
15
surface sites in the North Atlantic region, J. Geophys. Res., 103, 13 357–13 376, 1998. Platnick, S., King, M. D., Ackerman, S. A., Menzel, W. P., Baum, B. A., Riedi, J. C., and Frey, R.
A.: The MODIS cloud products: Algorithms and examples from Terra, IEEE Trans. Geosci. Remote Sens., 41(2), 459–473, 2003.
Streets D. G., Bond, T. C., Carmichael, G. R., et al.: An inventory of gaseous and
pri-20
mary aerosol emissions in Asia in the year 2000, J. Geophys. Res., 108(D21), 8809, doi:10.1029/2002JD003093, 2003.
Streets, D. G., Zhang, Q., Wang, L., He, K., Hao, J., Wu, Y., Tang, Y., and Carmichael, G. R.: Revisiting China’s CO emissions after TRACE-P: Synthesis of inventories, atmospheric modeling, and observations, J. Geophys. Res., 111, D14306, doi:10.1029/2006JD007118,
25
2006.
van der Werf, G. R., Randerson, J. T., Giglio, L., Collatz, G. J., Kasibhatla, P.S., and Arellano, A. F.: Interannual variability in global biomass burning emissions from 1997 and 2004, Atmos. Chem. Phys., 6, 3423–3441, 2006.
Wang, T., Ding, A., Gao, J., and Wu, W. S.: Strong ozone production in urban plumes from
30
Beijing, China, Geophys. Res. Lett., 33, L21806, doi:10.1029/2006GL027689, 2006
Wang, T., Cheung, T. F., Li, Y. S., Xu, X. M., and Blake, D. R.: Emission characteristics of CO,
ACPD
8, 10397–10414, 2008 Summertime O3over Beijing Y. Wang et al. Title Page Abstract Introduction Conclusions References Tables Figures ◭ ◮ ◭ ◮ Back CloseFull Screen / Esc
Printer-friendly Version
Interactive Discussion
Geophys. Res., 107(D12), 4157, doi:10.1029/2001JD000724, 2002.
Wang, Y. X., McElroy, M. B., Jacob, D. J., and Yantosca, R. M.: A nested grid formulation for chemical transport over Asia: Applications to CO, J. Geophys. Res., 109, D22307, doi:10.1029/2004JD005237, 2004c.
Wang, Y. X., McElroy, M. B., Wang, T., and Palmer, P. I.: Asian emissions of CO and
5
NOx: Constraints from aircraft and Chinese station data, J. Geophys. Res., 109, D24304,
doi:10.1029/2004JD005250, 2004a.
Wang, Y. X., McElroy, M. B., Boersma, K. F., Eskes, H. J., and Veefkind, J. P.: Traffic Restric-tions Associated with the Sino-African Summit: ReducRestric-tions of NOx Detected from Space, Geophys. Res. Lett., 34, L08814, doi:10.1029/2007GL029326, 2007b.
10
Wang, Y.X., McElroy, M. B., Martin, R. V., Streets, D. G., Zhang, Q., and Fu, T. M.:
Seasonal variability of NOx emissions over east China constrained by satellite
observa-tions: Implications for combustion and microbial sources, J. Geophys. Res., 112, D06301, doi:10.1029/2006JD007538, 2007a.
Wild, O., Zhu, X., and Prather, M. J.: Fast-J: Accurate simulation of in- and below cloud
photol-15
ysis in tropospheric chemical models, J. Atmos. Chem., 37, 245–282, 2000.
Zhang, Q.,Streeets, D. G., He, K. B., et al.:, NOx emission trends for China, 1995–2004:
The view from the ground and the view from space, J. Geophys. Res., 112, D22306, doi:10.1029/2007JD008684, 2007.
ACPD
8, 10397–10414, 2008 Summertime O3over Beijing Y. Wang et al. Title Page Abstract Introduction Conclusions References Tables Figures ◭ ◮ ◭ ◮ Back CloseFull Screen / Esc
Printer-friendly Version Interactive Discussion Beijing 50 km site (a) (b)
Fig. 1. (a) A regional map shows the location of the site (white circle) relative to Beijing urban area and other population centers(yellow), major roads (red), airport (magenta), and terrain. The color shading indicates elevation from low (green–near sea level) to high (darkest brown corresponding to 1400 m). Miyun city is indicated by the red dot.
(b) Annual emissions of CO from fossil and bio-fuel combustion (0.5◦
×0.5◦) in North China
ACPD
8, 10397–10414, 2008 Summertime O3over Beijing Y. Wang et al. Title Page Abstract Introduction Conclusions References Tables Figures ◭ ◮ ◭ ◮ Back CloseFull Screen / Esc
Printer-friendly Version
Interactive Discussion Daytime mean CO at Miyun in 2006
50 100 300 500 800 1000 1500 2000 CO (ppb)
Jun Jul Aug
Daytime mean O3 at Miyun in 2006
0 50 100 150 O3 (ppb)
Jun Jul Aug
38 21 10
#hrs with 1hr-avg O3 > 200ug/m3
: Legend obs mean obs median 5%-95% obs 33%-67% obs model median model mean 33%-67% model
Fig. 2. (a) Daytime (9 a.m.–6 p.m.) mean concentrations of CO at the Miyun site in summer (JJA) 2006. Measurements are shown as bars and model simulations are in red.
(b) Same as a, but for O3. The number of hours in each month with measured 1-h mean [O3]
ACPD
8, 10397–10414, 2008 Summertime O3over Beijing Y. Wang et al. Title Page Abstract Introduction Conclusions References Tables Figures ◭ ◮ ◭ ◮ Back CloseFull Screen / Esc
Printer-friendly Version
Interactive Discussion
(a) Observed O3 diurnal variations Jun
0 4 8 12 16 20 local time 0 50 100 150 200 O3 mixing ratio (ppb) median minimum
(b) Observed O3 diurnal variations Jul
0 4 8 12 16 20 local time 0 50 100 150 200 median minimum
(c) Observed CO diurnal variations
0 4 8 12 16 20 local time 200 400 600 800 1000 CO mixing ratio (ppb) Jun median Jun mean Jul median Jul mean
Fig. 3. Diurnal variations of O3(a, b) and CO (c) observed at Miyun in June and July 2006. (a,
b) Each point refers to hourly mean concentrations. Median and minimum [O3] are indicated
in the figures. (c) Median and mean [CO] as a function of local time in June and July. The large difference between mean and median [CO] in June implies a much skewed distribution including both the clean continental flow from the north and urban pollution plume from the south.
ACPD
8, 10397–10414, 2008 Summertime O3over Beijing Y. Wang et al. Title Page Abstract Introduction Conclusions References Tables Figures ◭ ◮ ◭ ◮ Back CloseFull Screen / Esc
Printer-friendly Version
Interactive Discussion
The association between COD and O3 at Miyun (July 2006)
1 2 3 4 5 6 7 8 9 10 11 12 13 14 15 16 17 18 19 20 21 22 23 24 25 26 27 28 29 30 31 date (July 2006) 0 20 40 60 80
Cloud optical depth
0 50 100 150 O3 (ppb) MODIS COD afternoon O3 at Miyun Model COD
R between O3 and MODIS COD = -0.71
Fig. 4. The association between afternoon [O3] measured at Miyun (red) and cloud optical
depth retrieved from MODIS (black) for an area of 1◦
×1◦ including the site (MYD08 D3, level-3
daily global product) in July 2006. The range of COD retrieved from MODIS over a region of 2◦
×3◦ surrounding the Miyun site is indicated as vertical lines. COD from the GEOS-Chem
ACPD
8, 10397–10414, 2008 Summertime O3over Beijing Y. Wang et al. Title Page Abstract Introduction Conclusions References Tables Figures ◭ ◮ ◭ ◮ Back CloseFull Screen / Esc
Printer-friendly Version
Interactive Discussion
Miyun observation July 18-19 2006
Jul 18 Jul 19 0 20 40 60 80 100 120 O3 ppb 0 200 400 600 800 1000 1200 CO (ppb) 0 20 40 60 80 100 RH (%) obs O3 obs CO obs RH
Fig. 5. Hourly measurements of O3(red), CO (black), and RH (blue) at the Miyun site for the

![Fig. 4. The association between afternoon [O 3 ] measured at Miyun (red) and cloud optical depth retrieved from MODIS (black) for an area of 1 ◦ ×1 ◦ including the site (MYD08 D3, level-3 daily global product) in July 2006](https://thumb-eu.123doks.com/thumbv2/123doknet/14775745.593621/18.918.60.650.172.385/association-afternoon-measured-miyun-optical-retrieved-including-product.webp)
