HAL Id: hal-00298359
https://hal.archives-ouvertes.fr/hal-00298359
Submitted on 14 May 2008
HAL is a multi-disciplinary open access
archive for the deposit and dissemination of
sci-entific research documents, whether they are
pub-lished or not. The documents may come from
teaching and research institutions in France or
abroad, or from public or private research centers.
L’archive ouverte pluridisciplinaire HAL, est
destinée au dépôt et à la diffusion de documents
scientifiques de niveau recherche, publiés ou non,
émanant des établissements d’enseignement et de
recherche français ou étrangers, des laboratoires
publics ou privés.
formation using Argo floats 2004?2006
R. O. Smith, H. L. Bryden, K. Stansfield
To cite this version:
R. O. Smith, H. L. Bryden, K. Stansfield. Observations of new western Mediterranean deep water
formation using Argo floats 2004?2006. Ocean Science, European Geosciences Union, 2008, 4 (2),
pp.133-149. �hal-00298359�
www.ocean-sci.net/4/133/2008/
© Author(s) 2008. This work is distributed under the Creative Commons Attribution 3.0 License.
Ocean Science
Observations of new western Mediterranean deep water formation
using Argo floats 2004–2006
R. O. Smith, H. L. Bryden, and K. Stansfield
National Oceanography Centre, Empress Dock, Southampton, SO14 3ZH, Hampshire, UK Received: 13 September 2007 – Published in Ocean Sci. Discuss.: 21 September 2007 Revised: 2 April 2008 – Accepted: 16 April 2008 – Published: 14 May 2008
Abstract. The deep convection that occurs in the western
basin of the Mediterranean Sea was investigated using Argo float data over two consecutive winters in 2004–2005 and 2005–2006. The results showed deep mixed layers reach-ing 2000 m in surprisreach-ing locations, namely the eastern Cata-lan subbasin (39.785◦N, 4.845◦E) and the western Ligurian subbasin (43.392◦N, 7.765◦E). Subsequently, new deep wa-ter was formed in March of 2005 and 2006 with θ =12.89– 12.92◦C, S=38.48–38.49 and σθ=29.113 kg m−3. The deep
water produced in the Ligurian subbasin during 2006 was more saline, warmer and denser than any historical obser-vations of western Mediterranean deep water. The results show S, θ and σθ in the western Mediterranean deep
wa-ter are higher than 1990s values, with a salinity increase of 1.5×10⁻³yr−1, a temperature increase of 3.6×10⁻³ ◦C yr−1
and a density increase of 4.0×10⁻⁴kg m−3yr−1 apparent
from a dataset of western Mediterranean deep water prop-erties spanning 1955–2006.
1 Introduction
Within the western basin of the Mediterranean Sea, deep convection ordinarily takes place during the winter months in localised regions of the Gulf of Lions and Ligurian and Provenc¸al subbasins (Fig. 1). This process is important as it leads to the formation of a water mass known as the Western Mediterranean Deep Water (WMDW), which plays a cru-cial role in the thermohaline dominated circulation of the Mediterranean Sea (Millot, 1991). The typical water column structure of the western basin consists of three major water masses along with Mediterranean Bottom Water (at depths >3000 m), which is not of relevance to this study. The
At-Correspondence to: H. L. Bryden
lantic Water (AW – S in the range 36.5 to 37.5, θ highly vari-able) originates from surface inflows in the Strait of Gibraltar and is recognised as a fresh, buoyant surface layer (0–200 m) which is steadily modified as it flows eastward through mix-ing and air-sea interactions (Bryden and Stommel, 1984; Send et al., 1999). The Levantine Intermediate Water (LIW – S in the range 38.45 to 38.75, θ >13.2◦C) lies below this layer (400–600 m), it is formed in the Levantine Basin of the eastern basin and is recognised by a distinct subsurface salin-ity maximum in vertical profiles (Rohling and Bryden, 1992). Underlying this is the WMDW (S in the range 38.40 to 38.48, θin the range 12.75 to 12.90◦C) which, following formation by mixing of AW and LIW during deep convection in the re-gions described above, spreads out through the western basin with a core at ∼2000 m (La Viollette, 1994).
1.1 Deep convection
Deep convection in the western basin and formation of the WMDW have been heavily studied (Leaman and Schott, 1991; Bethoux et al., 1990; Rhein, 1995; Testor and Gascard, 2006) following pioneering work by the MEDOC Group in the Gulf of Lions (MEDOC Group, 1970). Such studies suggest deep convection within the western basin is reason-ably understood, with the processes involved classified under three progressive phases (MEDOC Group, 1970; Marshall and Schott, 1999):
– Initially a “pre-conditioning” phase occurs during
which strong winter buoyancy losses owing to cold, dry Mistral and Tramontane continental winds (Testor and Gascard, 2006) gradually erode surface and intermedi-ate stratification (Mertens and Schott, 1998) within a cyclonic surface gyre in the Gulf of Lions and north-ern Provenc¸al subbasin (Marshall and Schott, 1999). The gyre is characterised by a doming of the σθ=28.8
isopycnal, with surface water densities exceeding 29.1 kg m−3in late winter (Swallow and Caston, 1973).
43˚N 43˚N 44˚N Latit ude 43˚N 42˚N 41˚N 40˚N 39˚N 38˚N Longitude
0˚E 2˚E 4˚E 6˚E 8˚E 10˚E Gulf of Lions Catalan subbasin Provençal subbasin Ligurian subbasin F R A N C E S P A I N CORSICA SARDINIA B a l e a r i c I s l a n d s
Fig. 1. The western basin of the Mediterranean Sea with the
sub-basins proposed by Ifremer (http://tinyurl.com/2hmnd9) and the boundary of the typical deep convection region shown (dashed re-gion).
This cyclonic surface circulation is an important fac-tor in pconditioning as it localises the convective re-gion by limiting exchange of the waters exposed to per-sistent surface forcing with more stably stratified wa-ters outside the gyre (Marshall and Schott, 1999; Send et al., 1999). The cyclonic circulation also draws the LIW toward the surface, to be more easily exposed to mixed layer (ML) entrainment (Schott et al., 1993) with the subsequent density increase of surface waters ulti-mately allowing for deeper convection of the water col-umn (Skliris and Lascaratos, 2004). As a result the surface and intermediate waters homogenise, exposing the underlying, weakly stratified water column to strong surface forcing (Schr¨oder et al., 2006).
– Following pre-conditioning, a “violent-mixing” phase
takes place as further strong surface buoyancy loss events commence deep convection and overturning of the water column (Marshall and Schott, 1999). This process occurs in the form of “plumes” of order 1 km2 within a convective regime reaching 1000 km2. The instantaneous vertical velocities within such “plumes” have been reported to reach 10 cm s−1(Schott and Lea-man, 1991) but have a net vertical transport of zero, acting more as strong mixing elements (Marshall and Schott, 1999). Typically, this phase of deep convec-tion is fairly rapid lasting less than one week (Salat and Font, 1987). The result of this phase is the formation of “deep mixed patches” with homogeneous temperature and salinity properties, varying in diameter from 10 to >100 km and reaching 2000 m into the water column (Marshall and Schott, 1999).
– As surface forcing ceases, a “sinking and spreading”
phase ensues as the recently formed deep mixed patches “slump” under gravity and undergo geostrophic adjust-ment; with a rim current established around the patch’s periphery (Jones and Marshall, 1997). Subsequently, stratification is re-established over the sinking mixed patch due to an inflow of stratified surface waters sur-rounding the convective region (Stommel, 1972), ini-tiated by frontal geostrophic eddies originating within the peripheral current (Jones and Marshall, 1997). The newly convected water in the western basin forms the WMDW, which steadily sinks to a level of neutral buoy-ancy and is understood to spread in a general southward direction (MEDOC Group, 1970). This dispersal of new WMDW (nWMDW) is facilitated by submesoscale vor-tices (Testor and Gascard, 2006) along with geostrophic eddies (Schott et al., 1993) spawned from baroclinic in-stabilities within the water column (Jones and Marshall, 1997). The circulation of WMDW following formation is fairly complex, but a general anticlockwise circula-tion of the water mass around the western basin is un-derstood to occur (Millot, 1999).
1.2 Changes of water mass characteristics
Observations of WMDW and LIW over the past century sug-gest properties of both water masses are changing, with an acceleration of such trends post-1955 (Rohling and Bryden, 1992). The WMDW is described as becoming “warmer and saltier over the past several decades” by Leaman and Schott (1991) whilst the LIW has also experienced an increase in salinity (Rohling and Bryden, 1992). Mean increases in temperature and salinity have been estimated by a number of authors and are highlighted in Table 1, with estimated increases in θ and S of WMDW ranging from 8.3×10⁻⁴ to 5.4×10⁻³ ◦C yr−1 and 6.9×10⁻⁴ to 2.0×10⁻³yr−1 re-spectively. The observed changes of both water masses are closely coupled as WMDW properties are partly governed by the properties of the water masses present in the deep convective regions of the western basin (Skliris and Las-caratos, 2004). Long term changes observed in the salinity and temperature of the LIW (and subsequently the WMDW) have been largely attributed to anthropogenic reductions in freshwater flows entering the Mediterranean (Rohling and Bryden, 1992; Bryden and Boscolo, 2002), although more recently the influence of the Eastern Mediterranean Tran-sient (EMT) on the western basin convective regime has also been considered (Klein et al., 1999; Schr¨oder et al., 2006). WMDW properties are also influenced by inter-annual variations in forcing and environmental conditions within the western basin (Mertens and Schott, 1998), al-though deep convection within the western basin is intermit-tent and may not occur yearly (Marshall and Schott, 1999). Nevertheless, such changes in salinity of the WMDW are predicted to significantly alter the thermohaline circulation
Table 1. Estimates of mean annual increases in potential temperature and salinity of the WMDW.
Study θincrease Sincrease Date range used in estimate
Rohling and Bryden (1992) 8.3×10⁻⁴ ◦C yr−1 6.9×10⁻⁴yr−1 1909–1989 Rohling and Bryden (1992) 1.6×10⁻³ ◦C yr−1 9.45×10⁻⁴yr−1 1955–1989 Bethoux et al. (1990) 4.0×10⁻³ ◦C yr−1 9.45×10⁻⁴yr−1 1959–1989 Mertens and Schott (1998) 3.5×10⁻³ ◦C yr−1 1.0×10⁻³yr−1 1959–1997 Bethoux and Gentili (1999) 3.5×10⁻³ ◦C yr−1 1.1×10⁻³yr−1 1959–1996 Bethoux et al. (2002) 3.4×10⁻³ ◦C yr−1 1.05×10⁻³yr−1 1993–2000 Schr¨oder et al. (2006) 5.4×10⁻³ ◦C yr−1 2.0×10⁻³yr−1 1995–2004
of the Mediterranean in the coming century (Skliris and Las-caratos, 2004).
1.3 Modern observations of the western basin
Early studies of deep convection within the western basin fo-cused on ship surveys of the convective regime in the Gulf of Lions and Ligurian and Provenc¸al subbasins (Stommel, 1972; Leaman and Schott, 1991). However, convective re-gions are notoriously difficult to work in owing to strong, persistent winter storms, which can hinder ship-based sam-pling campaigns and such campaigns in themselves are lim-ited by cost and manpower available. The development of neutrally buoyant profiling floats over the past half-century, outlined by Gould (2005), and the deployment of Argo deep profiling floats (hereafter, Argo floats) into the Mediter-ranean Sea in recent years (Poulain et al., 2007) represents a new approach to studying the physical oceanography of the Mediterranean Sea remotely, over periods reaching a few years. An Argo float is capable of recording vertical profiles of temperature and salinity to pre-described depths and at pre-defined intervals, and then transmitting this data along with the float position, to global relay centres, where the data are processed and made accessible to the scientific com-munity in near-real-time. Already, data collected by Argo floats in the North Atlantic has been presented by Ivchenko et al. (2005) in medium term monitoring of temperature and salinity variability, by Ohno et al. (2004) in observing spatial and temporal variations of the Mixed Layer Depth (MLD) in the North Pacific and by Avsic et al. (2006) in studying hydrographic properties of the Labrador Sea Water to com-plement ship-based CTD profiles. In relation to the Mediter-ranean Sea, a principal deployment of Argo floats took place in 2003 with floats then recovered in spring 2006 (Poulain et al., 2007). Three studies have already presented data from these floats: Taillandier et al. (2006) assimilated Argo data into a model of the Mediterranean Sea suggesting such data would be suitable for providing initial conditions for ocean circulation modelling, L´opez-Jurado et al. (2005) contrasted Argo float data with that of CTD data in the Catalan subbasin in observing a disruption to a previously observed warming
trend and Emelianov et al. (2006) confirmed a hypothesis of a “discrete-continuous” thermohaline structure of LIW in the western basin, through analysis of Argo float CTD profiles.
This study will examine the recent wintertime characteris-tics of the western basin of the Mediterranean Sea, through description and analysis of Argo float data collected during the winter months of 2004–2005 and 2005–2006. This study will also follow seasonal evolution of WMDW production during these periods, to compare any deep convection events observed with historical observational evidence of deep con-vection and water mass characteristics in the western basin. From this investigation we hope to learn whether deep con-vection took place in the western basin between 2004 and 2006 and how the deep water properties are changing with time.
2 Data
2.1 Argo profiling floats
The principal source of data for this study comes from tem-perature and salinity profiles collected by Argo floats in the western basin of the Mediterranean Sea, over the winter months (defined as 1st November to 31st March) of 2004– 2005 and 2005–2006. A total of 145 profiles from 5 floats were analysed between 0–10◦E, 38–46◦N (Fig. 2). The float data presented are part of the MedArgo Program (Poulain et al., 2007), which consisted of a total of 23 Argo floats de-ployed in both the eastern and western basins of the Mediter-ranean Sea between 2003 and 2006. The Argo float data represents real-time quality control data accessed from the USGODAE Argo GDAC dataset on 27/11/2006. When auto-matic quality control flags have indicated a specific measure-ment of being of a poor quality, it has been excluded from this study.
The MedArgo floats were configured to follow a 5-day profiling cycle with a neutral parking depth of 350 m and vertical CTD profiles to 700 m (9 in 10 cycles – “shallow dive”) and 2000 m (1 in 10 cycles – “deep dive”). During CTD profiles the Argo float sampled at 80 (700 m) and 106
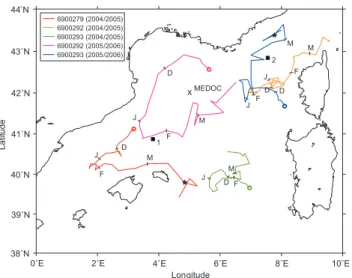
6900279 (2004/2005) 6900292 (2004/2005) 6900293 (2004/2005) 6900292 (2005/2006) 6900293 (2005/2006) 44˚N Latit ude 43˚N 42˚N 41˚N 40˚N 39˚N 38˚N Longitude
0˚E 2˚E 4˚E 6˚E 8˚E 10˚E
D J F M D J F M 1 2 MEDOC D D J J F F M M D J F M
Fig. 2. Trajectories of Argo floats within the western basin during
winters 2004–2005 and 2005–2006 investigated by this study. Float locations at the start of November are circled, with subsequent tick marks denoting the first float cycle of a particular month. The loca-tions used in the NCEP/NCAR reanalysis are shown as 1 (in relation to float 6900279 during winter 2004–2005) and 2 (in relation to float 6900293 during winter 2005–2006) and the centre of the MEDOC region is also indicated as the cross at 42◦N, 5◦E. The locations where deep-water formation was observed are marked with a star.
(2000 m) depths with intervals between samples of 5 m (0– 100 m), 10 m (100–700 m) and 50 m (700–2000 m). Mea-surements of temperature, conductivity - used to determine salinity – and pressure were made using on-board Sea-Bird Microcat CTD sensors with accuracies of 0.002◦C, 0.005
and 2.4 dbars respectively. Initial analysis of Argo float data coupled with discussion by Poulain et al. (2007) and Emelianov et al. (2006) suggests none of the floats experi-enced significant drift in any of the CTD sensors following pre-deployment calibration.
To consider differences between the pre-conditioned phases during the two winters we first assemble all available Argo float data within two 3◦×3◦cells (Catalan subbasin 39– 42◦N, 2–5◦E and Ligurian subbasin 41–44◦N, 6–9◦E) be-tween 1–30 November of the two winters and interpolate this data onto a regular 10 dbar pressure surfaces. The mean θ and S for each pressure surface was then calculated from the collated data, to create average θ and S profiles for Novem-ber 2004 and NovemNovem-ber 2005. An important point to note throughout this study is that Argo floats rarely profile the same water column more than once and may drift >30 km between subsequent profiles. However, given that processes of deep convection act over fairly large regions themselves (Marshall and Schott, 1999), we assume that the features ob-served in one region of a subbasin will be similar to those in adjacent locations within the same subbasin. This allows us to consider the region where pre-conditioning would most likely have occurred, despite not being directly sampled.
This study also utilizes hydrographic data from a CTD cast as part of the DYFAMED time-series in the Ligurian sub-basin (Marty, 2002) in order to compare with the Argo float data proximate to the DYFAMED location during March 2006.
2.2 NCEP/NCAR
Air-sea flux data comes from the NCEP/NCAR daily reanal-ysis (Kalnay et al., 1996) and were used to examine time-series of air-sea fluxes and heat loss (sea to air heat flux) in the regions of Argo floats during the winters of 2004–2005 and 2005–2006. The air-sea flux data represents the net of: incoming solar radiation, back radiation, latent and sensible heat loss. The NCEP/NCAR data presented is from two sep-arate grid cells at 3.75◦E, 40.9517◦N and 7.5◦E, 42.8564◦N (see Fig. 2) and were selected as they are proximate to 2 of the Argo float trajectories where deep convective regions were sampled (by Argo floats 6900279 and 6900293).
2.3 WMDW and LIW properties
Observational evidence of WMDW and LIW properties are considered to illustrate changes in the water masses proper-ties over the past century. The dataset consists of data col-lected between 1909–1989 from Rohling and Bryden (1992) with additional, more recent observational data in the same regions and at the same depths taken from Mertens and Schott (1998) and Testor and Gascard (2006), along with observational evidence from the Argo float data presented in this study, collected in the same region as Rohling and Bryden (1992). The potential density of WMDW at 2000 m for each year has been calculated from the dataset presented with a reference pressure set to 0dbar. The data from 1992– 2006 represent properties of WMDW identified at 2000 m immediately after formation and not data averaged per ves-sel, per year as in Rohling and Bryden (1992). The data ex-amined lacks observational evidence of WMDW properties between 2000 and 2004 when hydrographic surveys of the region were sparse. The salinity of the Levantine Intermedi-ate WIntermedi-ater was recorded in the region covering latitudes 41◦
to 43◦N and longitudes 5◦to 7.5◦E as per Rohling and Bry-den (1992) with 1◦extension of region to the north to include additional Argo float data.
This study uses implementations of the m map toolbox made freely available by Rich Pawlowicz (http://www.eos. ubc.ca/∼rich/map.html), the high resolution GSHSS Global Shoreline Data made freely available by the National Geophysical Data Centre (http://www.ngdc.noaa.gov/mgg/ shorelines/data/gshhs/) and the Woods Hole Oceanographic Institution OCEANS toolbox (ftp://acoustics.whoi.edu/pub/ Matlab/oceans/).
12 14 16 18 20 22 24 26 28 30 0 500 1000 1500 2000 2500 02/1 1/2004 02/12/2004 01/01/2005 05/02/2005 02/03/2005 Potential Temperature (°C) Pressure (dbar) (a) 38 39 40 41 42 43 44 45 0 500 1000 1500 2000 2500 02/1 1/2004 02/12/2004 01/01/2005 05/02/2005 02/03/2005 Salinity Pressure (dbar) (b)
Fig. 3. All (a) potential temperature and (b) salinity profiles from float 6900279 during the winter 2004–2005 observation period. A 0.5◦C offset for potential temperature and a 0.2 offset for salinity has been applied to consecutive profiles for clarity; therefore the scale applies to the 1st profile only. Dates indicate the first Argo float profile of a given month.
3 Results
3.1 Float observations
We first examine the hydrographic conditions for the respec-tive winters through description of 5 Argo float datasets, with a detailed focus on 2 datasets that provide evidence of winter deep convection and formation of nWMDW.
3.1.1 Hydrographic observations (winter 2004–2005) To examine the winter 2004–2005 hydrographic character-istics of the western basin, we first review successive pro-files of θ , S and σθ for Argo float 6900279, which ultimately
showed deep convection occurring in the Catalan subbasin during March 2005. Time evolution of vertical profiles of θ from Argo float 6900279 show a distinct transition from strong, surface thermal stratification in November, through to a well mixed, homogeneous water column by mid March (Fig. 3a). A salinity maximum (Smax)is well established in
vertical salinity profiles taken by the Argo float in early win-ter (Fig. 4), representing the core of the LIW at 500–600 m in the Catalan subbasin. During the early winter, surface wa-ter density is less than 28.0 kg m−3. Weakening of the ther-mocline and a subsequent homogeneous temperature profile is observed to 600 m on 10/2/2005, with significant erosion of the LIW core. This erosion of stratification is well illus-trated comparing Argo float deep-dive profiles on 2/12/2004 and 21/1/2005 where the temperature, salinity and density gradients of the upper 200 m weaken significantly (Fig. 4). As the Argo float travelled eastward during February 2005, the MLD decreased from ∼200 m on 10/2/2005 to <50 m on 20/2/2005, with vertical hydrographic profiles indicating stratified surface waters and an underlying, weakly strati-fied water column with θ <13.3◦C. Uniform vertical tem-perature profiles and almost vertical isotherms (Fig. 5) were
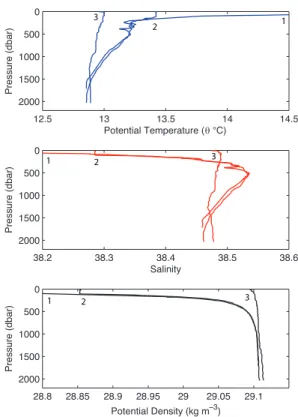
Fig. 4. Vertical profiles of potential temperature (top), salinity
(mid-dle) and potential density (bottom) taken from Argo float 6900279 deep-dive cycles. The deep dive cycles took place at 50-day inter-vals on 02/12/2004 (1), 21/01/2005 (2) and 12/03/2005 (3).
subsequently observed to maximum cycle depths of 750 m (7/3/2005) and 2000 m (12/3/2005) approximately 50 km from the coastline of Menorca (40◦N, 4.5◦E). Vertical pro-files on 12/3/2005 indicate the MLD reaching 2000 m and “connected” to the surface, with surface water σθ exceeding
02/1 1/2004 07/1 1/2004 12/1 1/2004 17/1 1/2004 22/1 1/2004 27/1 1/2004 02/12/2004 07/12/2004 12/12/2004 17/12/2004 22/12/2004 27/12/2004 01/01/2005 06/01/2005 11/01/2005 16/01/2005 21/01/2005 26/01/2005 31/01/2005 05/02/2005 10/02/2005 15/02/2005 20/02/2005 25/02/2005 02/03/2005 07/03/2005 12/03/2005 17/03/2005 22/03/2005 27/03/2005 Pressure (dbar) 12.9 12.9 12.9 12.9 13 13 13 13 13 13.1 13.1 13.1 13.1 13.1 13.1 13.1 13.1 13.1 13.2 13.2 13.2 13.2 13.2 13.2 13.2 13.2 13.2 13.2 13.2 13.4 13.4 13.4 13.4 13.6 13.8 14 14 15 16 16 18 18 0 100 200 300 400 500 600 700 800 Date
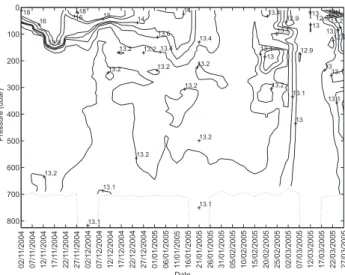
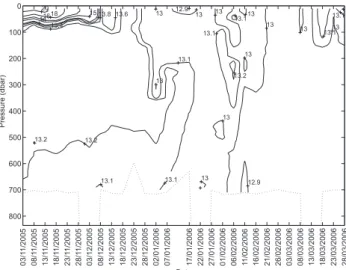
Fig. 5. Time series of vertical potential temperature profiles from
Argo float 6900279, limited to the Argo shallow dive depth (700 m). Data have been linearly interpolated onto a regular 10 m grid, with linear interpolation then carried out between successive float pro-files in order to contour the data.
29.1 kg m−3 and salinity (0–2000 m) 38.48±0.05 with no signature of the LIW Smax detected. Physical properties
at the maximum cycle depth on 12/3/2005 (2000 m) show θ=12.89◦C, S=38.48 and σθ=29.11 kg m−3. The water
col-umn (0–700 m) remained vertically uniform (with regards to θand S) between 7 and 12 March 2005, whilst the float trav-elled south-eastward for ∼100 km, with the MLDs during this time being ∼650 and ∼1900 m, much deeper than the mean MLD (97 m) observed during the 2004–2005 winter. Through the remainder of March the float travelled south into the Provenc¸al subbasin with the MLD rapidly decreasing to 50 m, ML temperatures exceeding 13◦C and an accompany-ing decrease in salinity of the ML occurred as the water col-umn restratified. Below this slightly stratified surface layer, the water remained very cold (<13◦C) with a weak salinity
maximum apparent at 300 m (Fig. 3b).
To further examine the seasonal evolution of nWMDW during the 2004–2005 winter, we consider the progressive mixing of the water column, revealed in hydrographic prop-erties averaged between pressure surfaces using data from Argo float 6900279 (Fig. 6). These results show that wa-ter column cooling between November and late January was largely restricted to the upper 200 m in the Catalan subbasin (coinciding with the maximum MLD) and was characterised by three cooling ’episodes’, with the 0–200 m layer cooling to a uniform 13.7◦C by the end of January. Over the same pe-riod, salinity in the 0–200 m layer fluctuated by a maximum of 0.1 between float cycles. By 10/2/2005 the 0–200 m layer cooled to a similar temperature of the 200–400 m layer, with subsequent prolonged cooling between late January and early March occurring in the 200–400 m and 400–600 m layers, as the MLD exceeded 200 m (after 10/2/2005). Following this
09/11/2004 29/11/2004 19/12/2004 08/01/2005 28/01/2005 17/02/2005 09/03/2005 12 14 16 18 Pot. Temp. (° C) 0-200m 200-400m 400-600m 600-800m 800-1000m 38 38.2 38.4 38.6 38.8 Salinity 28 28.5 29 29.5 Date Pot. Dens. (kg m -3) 1 2 3 09/11/2004 29/11/2004 19/12/2004 08/01/2005 28/01/2005 17/02/2005 09/03/2005 09/11/2004 29/11/2004 19/12/2004 08/01/2005 28/01/2005 17/02/2005 09/03/2005
Fig. 6. Time series of potential temperature (top), salinity (middle)
and potential density (bottom) averaged between pressure surfaces (see legend) from Argo float 6900279 (winter 2004–2005). As the Argo float profiles to 2000 m every 50 days, averages for the 600– 800 and 800–1000 m layers can only be shown for these cycles and are indicated as crosses. Numbered dashed vertical lines indicate three cooling events observed in data from this float.
prolonged cooling and increase in the MLD, a sharp increase in the 0–200 m layer salinity of 0.372 occurred between 25/2/2005 and 12/3/2005, whilst salinities in the 200–400 and 400–600 m layers decreased. These observations show surface forcing had been of sufficient duration and magni-tude (by late February 2005) to overcome the density gradi-ent and to progressively mix and gradi-entrain deeper layers. The observed salinity increase in the 0–200 m layer can therefore be explained by a reduction in salinity of the 200–400 m and 400–600 m layers through entrainment and upward mixing of the saline LIW into the ML. With continued surface forcing and deepening of the ML, the water column homogenised to 2000 m on 12/3/2005 with the 0–200 m layer having experi-enced a salinity increase of 0.163. In the remainder of March temperatures in all layers above 600 m increase and approach 13.2◦C whilst salinity decreases between 0–200 m by 0.17, and increases by 0.035 in the 200–400 and 400–600 m layers, coinciding with the re-establishment of a sub-surface Smax.
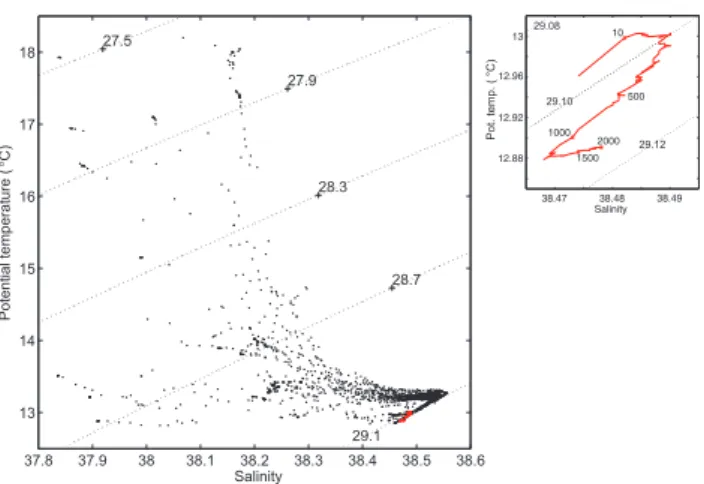
The entire set of θ and S measurements recorded by Argo float 6900279 are presented as a θ /S diagram (Fig. 7) to char-acterise water masses present in the western basin. Firstly, two “branches” of low salinity AW can be identified in the surface waters (σθ less than 28.9 kg m−3), which represent
the water mass at different stages of seasonal modification and in different locations. Throughout most of the winter a strong signal of the LIW is present as a salinity maximum, with mean winter salinity of 38.556, θ ∼13.2◦C between 450–650 m. Salinity profiles indicate the core of the LIW becomes less distinct during periods of deep MLs. A signal of Western Intermediate Water (WIW) appears on 2/3/2005 as a potential temperature minimum (θmin)of 12.821◦C, with
28.3 28.7 Salinity Potential temperature (° C) 37.8 37.9 38 38.1 38.2 38.3 38.4 38.5 38.6 13 14 15 16 17 18 27.9 27.5 29.1 29.08 29.10 29.12 Pot. temp. ( °C)
Fig. 7. θ /S diagram with potential density anomaly contours, using
all measurements made by Argo float 6900279 (large) and data col-lected by the Argo float deep-dive cycle on 12/03/2005 (in red and inset right).
occupying depths of ∼60 m between AW and LIW, close to 40.258◦N, 3.628◦E. Of most interest are two separate signa-tures of WMDW, the first is a cooler and fresher, old WMDW (oWMDW) (θ =12.86◦C, S= 8.46, σθ=29.108 kg m−3)
iden-tified at 2000 m on 2/12/2004 and 21/1/2005 (see main plot Fig. 7), whilst the other is a warmer, more saline nWMDW (θ =12.89◦C, S=38.48, σθ=29.113 kg m−3)
identi-fied on 12/3/2005 at 39.785◦N, 4.845◦E (see inset of Fig. 7).
These signatures of WMDW can be seen most clearly on the inset of Fig. 7, with nWMDW saltier, warmer yet denser than the oWMDW.
Having examined the data from Argo float 6900279 we now briefly examine data from two further Argo floats which were present in the western basin during the 2004–2005 win-ter, but which did not identify deep convection. Data col-lected within the central Provenc¸al subbasins from Argo float 6900293 reveals deep convection did not extend to this re-gion during the winter of 2004–2005. Following the first sig-nificant winter cooling around 9/11/2004, continued winter buoyancy loss events caused initially strongly stratified sur-face layer of AW to cool below the temperature of the deeper waters by 6/2/2005 (Fig. 8) yet the upper water column (0– 200 m) remained “fresher” than deeper waters with S<38.4 and the 0–200 m mean winter σθ=28.928 kg m−3 imposing
a strong density gradient into the deeper waters. As a con-sequence, later cooling and vertical mixing were limited to the surface layer of AW with the LIW not entrained into the ML and the MLD remaining shallower than 200 m. Similar observations from Argo float 6900292 over the 2004–2005 winter in the southern Ligurian subbasin indicate a persistent layer of cold but “fresh” water in the upper 200 m (mean win-ter σθ=29.074 kg m−3- results not shown). Layer averaged
properties indicate the 0–200 m θ dropping below 13◦C in February and March but salinity in the same layer remaining <38.4, with vertical mixing of the water column again
inhib-09/11/200429/11/200419/12/200408/01/200528/01/200517/02/200509/03/2005 13 14 15 16 Pot. T emp . (° C) 37.5 38.0 38.5 39.0 Salinity 28 28.5 29 29.5 Date Pot. Dens. (kg m -3) 0-200m 200-400m 400-600m 600-800m 800-1000m 12 09/11/200429/11/200419/12/200408/01/200528/01/200517/02/200509/03/2005 09/11/200429/11/200419/12/200408/01/200528/01/200517/02/200509/03/2005 3 1 2
Fig. 8. Time series of potential temperature (top), salinity (middle)
and potential density (bottom) averaged between pressure surfaces (see legend) from Argo float 6900293 (2004–2005 winter). As the Argo float profiles to 2000 m every 50 days, averages for the 600– 800 and 800–1000 m layers can only be shown for these cycles and are indicated as crosses. Numbered dashed vertical lines indicate three cooling events observed in data from this float.
ited by a strong density gradient and limited to those waters above the LIW core.
The Argo float data collected over the 2004–2005 winter observation period display fascinating features of deep wa-ter formation and winwa-ter hydrographic characwa-teristics in the western basin. 2 of 3 Argo floats detected a low salinity surface layer of AW, which persisted over much of the up-per water column of the Provenc¸al and Ligurian subbasins. This “fresh” surface layer prevented ML entrainment of the LIW and thus inhibited the pre-conditioning phase required for deep convection. However, the classical pre-conditioning did occur within the eastern Catalan subbasin, with Argo float 6900279 ultimately sampling nWMDW at 2000 m dur-ing March 2005. Deep convection occurred in an unusual lo-cation (39.785◦N, 4.845◦E) at the border of the Catalan and Provenc¸al subbasins, much further south than typically de-scribed. Furthermore, the nWMDW was warmer, saltier yet denser than oWMDW present in the western basin. Unfortu-nately, Argo float transects did not pass through the MEDOC region or the Gulf of Lions during the 2004–2005 winter, where deep convection has traditionally been studied. 3.1.2 Hydrographic observations (winter 2005–2006) The seasonal characteristics of the western basin during win-ter 2005–2006 are now examined using hydrographic data collected by 2 separate Argo floats. We first describe sea-sonal characteristics of the Provenc¸al and Ligurian sub-basins from successive profiles of θ , S and σθ for Argo
float 6900293, which subsequently detected formation of nWMDW during March 2006 in the Ligurian subbasin.
12 14 16 18 20 22 24 26 28 0 500 1000 1500 2000 2500 03/1 1/2005 03/12/2005 02/01/2006 01/02/2006 03/03/2006 Potential Temperature (θ° ) Pressure (dbar) (a) C 38 39 40 41 42 43 44 0 500 1000 1500 2000 2500 03/1 1/2005 03/12/2005 02/01/2006 01/02/2006 03/03/2006 Salinity Pressure (dbar) (b)
Fig. 9. All (a) potential temperature and (b) salinity profiles from float 6900293 during the winter 2005–2006 observation period. A 0.5◦C offset for potential temperature and a 0.2 offset for salinity has been applied to consecutive profiles for clarity; therefore the scale applies to the 1st profile only. Dates indicate the first Argo float profile of a given month. A missing profile caused a gap in the time series occurs between 07/01/2006–17/01/2006 (dashed line) when the Argo float encountered a problem and had to make an emergency ascent.
Fig. 10. Vertical profiles of potential temperature (top), salin-ity (middle) and potential denssalin-ity (bottom) taken from Argo float 6900293 deep-dive cycles (winter 2005–2006). The deep dive cy-cles took place at 50-day intervals on 03/12/2005 (1), 22/01/2006 (2) and 13/03/2006 (3).
Vertical profiles of potential temperature collected from Argo float 6900293 (Fig. 9a) show stable stratification persists throughout the early winter at the border of the
Provenc¸al and Ligurian subbasins, with a strong thermo-cline in the upper 150 m, along with a sub-surface θ maxi-mum at ∼300 m. A distinct Smax(S=38.58) is also present
in the region at 250–500 m (Fig. 9b), with the θmax and
Smax suggesting this water mass represents the core of the
LIW during early winter. The thermocline becomes entirely eroded by 2/1/2006 (Fig. 9a) with ML θ =13.4◦C, S>38.3 and surface water σθ reaching 29.051 kg m−3(15 m),
expos-ing the upper water column to surface forcexpos-ing. By 22/1/2006 the surface water density increases to 29.104 kg m−3(15 m) and the MLD reaches 1000 m (Fig. 10), with properties at the base of the MLD showing θ =12.94◦C, S=38.48 and
σθ=29.11 kg m−3. Salinity profiles from the same cycle
in-dicate salinity from 0–2000 m is 38.48±0.03, with the Smax
almost entirely eroded. Surface waters briefly restratify be-tween 1/02/2006 to 6/02/2006 as the float moves north-ward into the Ligurian subbasin, before again homogenis-ing with intermediate waters as the MLD reaches 700 m on 3/03/2006. The MLD reaches 2000 m on 13/3/2006, with vertical isotherms observed in the θ time evolution plot (Fig. 11) suggesting the “violent mixing” phase of deep convection was taking place. As the MLD reaches 2000 m (∼930 m deeper than the mean MLD estimated for the 2005–2006 winter in the region of the float) the hydro-graphic properties at the maximum cycle depth (2000 m) are θ=12.92◦C, S=38.49 and σθ=29.11 kg m−3, whilst the float
is at 43.392◦N, 7.765◦E. The salinity at 2000 m increased
by 0.04 and the density has increased by 0.01 kg m−3
com-pared to the previous deep-dive cycle on 22/1/2006, with the deep water becoming saltier, warmer but denser over win-ter as LIW is mixed down. These results show that although the nWMDW at 2000 m in the western basin is warmer than oWMDW, it also has a sufficiently high salt content to make it denser. It should be noted that deep water production may
03/1 1/2005 08/1 1/2005 13/1 1/2005 18/1 1/2005 23/1 1/2005 28/1 1/2005 03/12/2005 08/12/2005 13/12/2005 18/12/2005 23/12/2005 28/12/2005 02/01/2006 07/01/2006 17/01/2006 22/01/2006 27/01/2006 01/02/2006 06/02/2006 11/02/2006 16/02/2006 21/02/2006 26/02/2006 03/03/2006 08/03/2006 13/03/2006 18/03/2006 23/03/2006 28/03/2006 Pressure (dbar) 12.9 12.9 13 13 13 13 13 13 13 13 13 13 13 13.1 13.1 13.1 13.1 13.1 13.1 13.1 13.2 13.2 13.2 13.4 13.6 13.8 14 15 1618 20 0 100 200 300 400 500 600 700 800 Date
Fig. 11. Time series of vertical potential temperature profiles from
Argo float 6900293, limited to the Argo shallow dive depth (700 m). A gap in the time series occurs between 07/01/2006–17/01/2006 when the Argo float encountered a problem and had to make an emergency accent. Data have been linearly interpolated onto a reg-ular 10 m grid, with linear interpolation then carried out between successive float profiles in order to contour the data.
04/11/2005 24/11/2005 14/12/2005 03/01/2006 23/01/2006 12/02/2006 04/03/2006 13 14 15 Date Pot. T emp. (°C) 37.5 38.0 38.5 39.0 Date Salinity 28 28.5 29 29.5 Date Pot. Dens. (kg m -3 ) 12 24/03/2006 04/11/2005 24/11/2005 14/12/2005 03/01/2006 23/01/2006 12/02/2006 04/03/2006 24/03/2006 04/11/2005 24/11/2005 14/12/2005 03/01/2006 23/01/2006 12/02/2006 04/03/2006 24/03/2006 0-200m 200-400m 400-600m 600-800m 800-1000m
Fig. 12. Time series of potential temperature (top), salinity (middle)
and potential density (bottom) averaged between pressure surfaces (see legend) from Argo float 6900293 (2005–2006 winter). As the Argo float profiles to 2000 m every 50 days, averages for the 600– 800 and 800–1000 m layers can only be shown for these cycles and are indicated as crosses.
have occurred prior to 13/3/2006 in the Ligurian subbasin (from 26/02/2006 to 8/03/2006), as MLDs reached the maxi-mum cycle depth of shallow-dive cycles (700 m) with similar properties in the ML to the nWMDW later produced. Surface water temperatures increase during the remainder of March to 13.1◦C and a minor salinity maximum appears between 75–130 m, accompanied by a shallow MLD of 20 m as the surface waters restratify.
27.1 27.5 27.9 28.3 28.7 29.1 Salinity Potential temperature (° C) 38 38.1 38.2 38.3 38.4 38.5 38.6 13 14 15 16 17 18 19 20 21 .
Fig. 13. θ /S diagram with potential density anomaly contours,
us-ing all measurements made by Argo float 6900293 (large) and data collected by the Argo float deep-dive cycle on 13/03/2006 (inset right).
Having observed nWMDW formation in the Ligurian sub-basin, the progressive homogenisation of the water col-umn will now be examined to follow seasonal evolution of WMDW formation. This is accomplished by analysing time evolution of layer averaged hydrographic properties for float 6900293 over the 2005–2006 winter (see Fig. 12). A steady increase in the 0–200 m layer salinity (∼7.5×10⁻³d−1) is observed between the start of the observation period (3/11/2005) and 3/12/2005, accompanied by a decrease in salinity of all layers deeper than 200 m. These salinity trends coincide with cooling in the 0–200, 200–400 and 400–600 m layers measuring 1.7, 0.2 and 0.25◦C respectively (relative to the first float cycle) on 22/1/2005. Such results suggest the deeper layers are progressively being entrained into an ever-deepening ML that is exposed to surface forcing and again suggest entrainment of the LIW into the ML, as the average salinity over 0–600 m reaches values typical of the LIW on 26/2/06. Following further cooling, the 0–200, 200– 400 and 400–600 m layers are uniform to within 0.1◦C from
26/2/2006 to 13/3/2006 (as the float moves northward from the Provenc¸al into the Ligurian subbasin) and as the MLD reaches 2000 m on 13/3/06, the net salinity increase in the 0–200 m layer (relative to the first float cycle) is estimated as 0.238. Salinities in the 200–400 and 400–600 m layers decrease for the remaining observation period, whilst the 0–200 m layer experiences minor warming and fluctuating salinity.
To identify the presence of water masses within the north-ern Provenc¸al and Ligurian subbasins during the 2005–2006 winter, a θ /S diagram is plotted from measurements taken by Argo float 6900293 (Fig. 13). A Smaxcan be observed
close to the 29.1 σθ contour in most of the profiles and
is interpreted as the presence of LIW in this region, with the LIW core (winter average S=38.57, θ ∼13.2◦C) having
Fig. 14. Vertical profiles of potential temperature (top), salin-ity (middle) and potential denssalin-ity (bottom) taken from Argo float 6900292 (2005–2006 winter) deep-dive cycles. The deep dive cycles took place at 50-day intervals on 23/01/2006 (1) and 14/03/2006 (2).
salinity and density ∼0.0140 and ∼0.004 kg m−3higher than
the LIW core identified in the Catalan subbasin the previ-ous winter. Data plotted above the 28.6 σθ contour
fluctu-ate largely in θ and S, indicating the presence of a fresher, warmer surface layer present in early winter (AW), which becomes saltier and cooler with progression through the win-ter season and movement of the Argo float north-eastward. Measurements of θ and S at 2000 m on 22/1/2006 indi-cate values typical of oWMDW with θ =12.83◦C, S=38.454 and σθ=29.107 kg m−3. The following deep-dive cycle of
Argo float 6900293 on 13/3/2006 at 43.392◦N, 7.765◦E, identifies nWMDW present at 2000 m with θ =12.923◦C, S=38.486 and σθ=29.113 kg m−3. Similarly, nWMDW can
also be observed from the DYFAMED time-series at the be-ginning of April 2006, with the new deep water present at 2000 m recording values coherent with the Argo float data. The nWMDW present in the Ligurian subbasin is ∼0.03◦C
warmer and ∼0.01 saltier but with indistinguishable density difference, compared to the nWMDW observed the previous winter at the border of the Catalan and Provenc¸al subbasins. Although we again evidence a cooler, fresher oWMDW, which is later displaced by a warmer, more saline nWMDW produced during the 2005–2006 winter, we did not detect a signal of the nWMDW produced in the Catalan subbasin the
09/11/2004 29/11/2004 19/12/2004 08/01/2005 28/01/2005 17/02/2005 09/03/2005 29/03/2005 −200 0 200 400 600 800 1000 Heat Flux (Wm −2 ) 04/11/2005 24/11/2005 14/12/2005 03/01/2006 23/01/2006 12/02/2006 04/03/2006 24/03/2006 −200 0 200 400 600 800 1000 Heat Flux (Wm −2 )
Fig. 15. NCEP/NCAR daily reanalysis air-sea flux data for the
2004–2005 (top) and 2005–2006 (bottom) winters. The locations of the reanalysis time-series are shown in Fig. 2 with blue represent-ing re-analysis location 1 (Catalan subbasin) and red representrepresent-ing re-analysis location 2 (Ligurian subbasin).
previous winter in the Ligurian subbasin from either the Argo float data or within the DYFAMED dataset.
It was expected that deep convection would also have been observed in data collected by Argo float 6900292, as the float regularly profiled within the MEDOC region during the winter 2005–2006 observation period. It appears however, that the Argo float perhaps missed the main winter convec-tion due to the timing of deep-dive cycles, with nWMDW subsequently detected beneath a re-establishing LIW core (Fig. 14). During the early winter, Argo float 6900292 data indicated stable stratification was present in the Gulf of Li-ons, with the LIW core at ∼500 m and θ exceeding 17◦C in the surface waters. The LIW core was later detected at 250 m on 23/1/2006 following progressive decreases in the salinity and temperature of the surface waters. As the float profiles close to the centre of the MEDOC region, convection of the water column reached 700 m during shallow-dive cycles on 22/2/2006 and 9/3/2006 with uniform temperature and salin-ity profiles (results not shown). A subsequent deep-dive cy-cle on 14/3/06 identifies nWMDW with θ =12.91◦C, S=38.48
and σθ=29.114 kg m−3 at 2000 m (see Fig. 14). However,
owing to the timing of Argo float deep-dive cycles we cannot be sure where and when this water mass was formed. 3.2 Air-sea fluxes
We now examine the NCEP/NCAR daily reanalysis air-sea flux data compiled in locations proximate to Argo float tra-jectories (see Fig. 2) in order to study the surface forcing in the two deep convective regions sampled by Argo floats (6900279 and 6900293) in March 2005 and March 2006 re-spectively (Fig. 15).
Winter 2004–2005 data indicates four periods (lasting <3days) when heat fluxes in the Catalan subbasin reach or
exceed 600 Wm−2suggesting major meteorological forcing
is taking place for short periods. Despite the proximity of Argo float 6900279 to the NCEP/NCAR re-analysis location in the Catalan subbasin, the three cooling “episodes” noted in the layer averaged θ (Fig. 6) do not correspond with the three prominent cooling events in the NCEP/NCAR data (Fig. 15). However, the three cooling events noted in the NCEP/NCAR data do correspond well to the time series of layer averaged θshown in Fig. 8 from Argo float 6900293. Intervening pe-riods are marked by much lower heat fluxes and correspond to observations from Argo float 6900279 of brief surface re-stratification. Heat fluxes in the Ligurian subbasin during winter 2004–2005 are coherent with the heat flux time se-ries from the Catalan subbasin, but show consistently weaker heat fluxes (generally below 400 Wm−2)during the periods of major meteorological forcing previously noted in the Cata-lan subbasin.
Despite significant sea-air heat fluxes around 9/11/2004 revealed in the NCEP/NCAR data at both re-analysis loca-tions and cooling noted in data from Argo float 6900293, Argo float 6900279 detected warming in the upper 200 m of the water column, yet was in close proximity to the NCEP/NCAR re-analysis location in the Catalan subbasin. We suggest this is due to the float drifting between differ-ent water mass regimes and discuss this result in Sect. 4.1. The heat fluxes remain almost always, above 200 Wm−2 be-tween 12/2/2005 and 8/3/2005 during which time the MLD reached 2000 m. The heat flux remained positive for the en-tire winter until 10/3/2005, after which time float (6900279) observations indicate surface restratification over the newly ventilated water column.
The NCEP/NCAR data from the Ligurian subbasin over the 2005–2006 winter indicates a clear difference between the surface heat fluxes experienced the previous winter in the Catalan subbasin. Heat fluxes in the Ligurian subbasin did not exceed 400 Wm−2 and were consistently weaker, with less distinct heat flux “episodes” observed in comparison to the previous winter. A distinct peak in the air-sea flux oc-curs on 6/3/2006 of 236 Wm−2, following which the MLD increases to reach 2000 m on 13/3/2006, despite heat fluxes quickly becoming negative. Weaker agreement between the Ligurian and Balearic heat flux time series is observed com-pared to the heat flux time series from the respective sub-basins during the previous winter. Balearic subbasin heat fluxes exceeded 400 Wm−2on 7 occasions between Novem-ber 2005 and January 2006, but are markably weaker and with fewer well-defined major meteorological forcing events, compared to those experienced in the subbasin the previous winter.
To examine similarities between the Argo float data and NCEP/NCAR reanalysis data, we compare the winter NCEP/NCAR heat loss with heat content change observed by Argo floats throughout the two winter observation peri-ods (Fig. 16). We define the heat content change computed from Argo float data as the time derivative of heat content
09/11/2004 29/11/2004 19/12/2004 08/01/2005 28/01/2005 17/02/2005 09/03/2005 29/03/2005
04/11/2005 24/11/2005 14/12/2005 03/01/2006 23/01/2006 12/02/2006 04/03/2006 24/03/2006
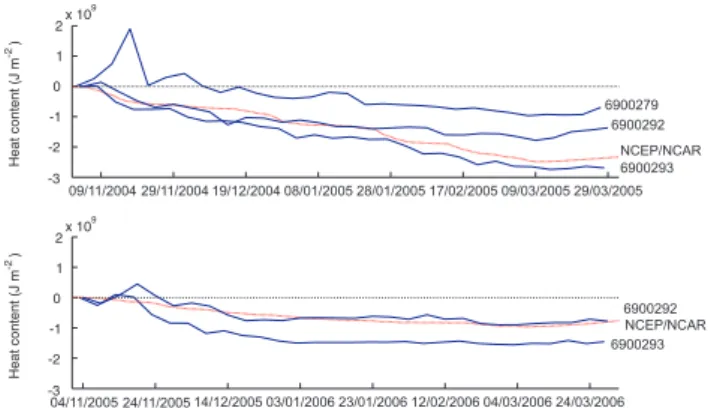
Fig. 16. Comparisons of Argo float heat content (blue solid) and
NCEP/NCAR cumulative heat loss (red dashed) for the 2004–2005 (top) and 2005–2006 (bottom) winters.
(Levitus et al., 2000) integrated over a fixed depth layer (0–200 m) between successive Argo float profiles. Reason-able agreement is found between cumulated air-sea heat flux (calculated from the NCEP/NCAR data) and heat content change (computed for all Argo float data) with differences in total seasonal heat loss of 9.98×10⁸±6.63×10⁸J m−2and 3.61×10⁸±3.37×10⁸J m−2in the winters of 2004–2005 and 2005–2006 respectively.
Differences between Argo float 6900279 and NCEP/NCAR total winter heat loss (re-analysis loca-tion 1) in the 2004–2005 winter were 1.622×10⁹J m−2with the NCEP/NCAR heat loss being larger. Comparisons be-tween Argo float 6900293 and the NCEP/NCAR total winter heat loss (re-analysis location 2) for the 2005–2006 winter show similar gradients throughout the winter with stronger agreement (compared to 2004–2005 winter) and differences between total estimated heat loss of 6.976×10⁸J m−2, with the Argo cumulative heat content being larger. Interestingly, reasonable agreement was found between the datasets during both winters, with the Argo float data “following” the NCEP/NCAR data remarkably well, despite large differences in winter buoyancy loss over the two winter observation periods and some Argo floats being quite a distance from the particular re-analysis locations.
Through analysis of the Argo and NCEP/NCAR data it is apparent that surface forcing was stronger and more pro-longed within the Catalan subbasin during the 2004–2005 winter, when compared to the surface forcing experienced in the 2005–2006 winter within the Ligurian subbasin, leading to a greater water column heat loss. This is highlighted in the differences between the NCEP/NCAR heat losses when deep convection was observed in the respective years. The deep convection observed in 2005 (12 March) and 2006 (13 March) occurred 2–6 days after maximum cumulative heat losses are observed in NCEP/NCAR data with the differ-ences between these results showing an additional surface heat loss of 1.52×10⁹J m−2at the time deep convection was
38.1 38.15 38.2 38.25 38.3 38.35 38.4 38.45 38.5 38.55 38.6 0 200 400 600 800 13 14 15 16 17 18 19 0 200 400 600 800 38.1 38.15 38.2 38.25 38.3 38.35 38.4 38.45 38.5 38.55 38.6 0 200 400 600 800 13 14 15 16 17 18 19 0 200 400 600 800 Salinity Potential temperature (°C) Depth (m) Depth (m)
2004-2005 (Catalan subbasin) 2005-2006 (Ligurian subbasin)
Fig. 17. Comparison of vertical salinity (top) and potential
temper-ature (bottom) profiles in the Catalan (2004) and Ligurian subbasins (2005). Profiles represent an average of all available Argo float data between 1 to 31 November 2004 (532 measurements from 7 Argo float profiles) and 2005 (368 measurements from 6 Argo float pro-files) within two 3◦×3◦cells (Catalan subbasin 39–42◦N, 2–5◦E and Ligurian subbasin 41–44◦N, 6–9◦E).
observed in March 2005 (compared to March 2006). As a result, the nWMDW formed during 2004–2005 was colder (and less saline), yet had indistinguishable density to the nWMDW formed the following year. Both datasets evidence a heat content increase from mid-March through to the end of the observation period, consistent with restratification of surface waters and re-establishment of a salinity maximum. 3.2.1 Differences in the pre-conditioning phases of
November 2004 and 2005
An interesting question is how deep convection occurred in the 2005–2006 winter in the Ligurian subbasin, despite con-sistently weak buoyancy losses. To address this question we examine differences in the water column structure of the western basin during the pre-conditioning phase of 2004 and 2005. Average potential temperature and salinity pro-files created from Argo float data (Fig. 17) reveal the Smax
of the LIW in the Ligurian subbasin during November 2005 was saltier (∼0.007), warmer (0.005◦C) and with a shallower core (at ∼400 m) in comparison to the LIW observed in the Catalan subbasin in November 2004 (LIW core at ∼540 m). Furthermore, the Ligurian subbasin was 0.359◦C cooler and
0.07 saltier in November 2005 than the Catalan subbasin in November 2004 (based on 0–700 m average θ and S). The shallower, saltier LIW in the Ligurian subbasin during November 2005 would be expected to promote homogeni-sation of the surface and intermediate waters during winter time buoyancy loss, despite weaker buoyancy fluxes. Cooler waters persisting in the upper 200 m would also have assisted this homogenisation process.
Year 1900 1920 1940 1960 1980 2000 2020 W MD W p o te n ti a l d e n si ty (kg m -3) 29.07 29.08 29.09 29.10 29.11 Year 1900 1920 1940 1960 1980 2000 2020 L IW Sa lin it y 38.42 38.44 38.46 38.48 38.50 38.52 38.54 38.56 Year 1900 1920 1940 1960 1980 2000 2020 W MD W p o te n ti a l te mp e ra tu re (°C ) 12.65 12.70 12.75 12.80 12.85 12.90 Year 1900 1920 1940 1960 1980 2000 2020 W MD W sa lin it y 38.36 38.38 38.40 38.42 38.44 38.46 38.48 (a) (b) (c) (d)
Fig. 18. Potential temperature (a), salinity (b) and potential density (c) of the Western Mediterranean Deep Water, recorded in the
west-ern basin. Data prior 1990 was presented in Rohling and Bryden (1992), data from 1992 and 1995 come from Mertens and Schott (1998) and Testor and Gasgard (2006) respectively, and data from 2005 and 2006 represent properties measured by Argo floats at the base of the deepest winter MLD in the respective winters. The dashed lines are linear regressions presented by Rohling and Bryden (1992) for data spanning 1909–1955 (with the exception of density which Rohling and Bryden (1992) did not examine), while the solid lines are linear regressions for the data from 1955-2006. The salin-ity of the Levantine Intermediate Water (d), recorded in the region covering latitudes 41◦to 43◦N and longitudes 5◦to 7.5◦E (as per Rohling and Bryden (1992) with 1◦extension of region to the north to accommodate additional Argo float data). The dashed line repre-sents a linear regression through the entire LIW dataset, whilst the solid line depicts a linear regression through the post-1955 data.
3.3 Changes in WMDW properties
We finally consider an adapted version of the dataset pre-sented by Rohling and Bryden (1992) that has been ex-panded to include more recent observational evidence of LIW and WMDW properties (Fig. 18), to examine long term warming and increasing salinity trends. The data show that from 1955–2006 the WMDW has warmed on average by 3.6×10⁻³ ◦C yr−1, with accompanying increases in salinity of 1.5×10⁻³yr−1and in density of 4.0×10⁻⁴kg m−3yr−1. The coefficient of determination (r2)for θ , S and σθ was
found to be 0.649, 0.734 and 0.5593 respectively. The WMDW observed in the Ligurian subbasin during March 2006 is warmer, more saline and denser than any of the previous WMDW data presented, with the data from 1955– 2006 also suggesting the WMDW is experiencing acceler-ating increases in temperature, salinity and density com-pared with trends prior to 1955. The data also show the LIW has experienced a salinity increase of 9.17×10⁻⁴yr−1 from 1900–2005 with r2=0.625, whilst a linear regression considering only post-1955 data reveals a lower co-efficient
of determination with r2=0.457. The LIW present in the MEDOC region during winter 2005–2006 was recorded as having θ =13.988◦C, S=38.532 and σθ=28.99 kg m−3 (data
from Argo float 6900292) showing the LIW has experienced an increasing salinity trend, although it remains slightly less saline than in 1987 but warmer and less dense.
4 Discussion
4.1 The pre-conditioning phase
The observed cooling and increases in salinity depicted by Argo float data generally correspond well to periods of strong surface forcing. We also find that NCEP/NCAR heat fluxes from the Catalan and Ligurian subbasins were of a simi-lar magnitude and duration to those expected from the Mis-tral wind (Mertens and Schott, 1998; Leaman and Schott, 1991). Agreement between the time series of layer averaged θ from Argo float 6900293 and NCEP/NCAR re-analysis time series in the Catalan subbasin location during winter 2004–2005 is not entirely unexpected, given that both the NCEP/NCAR re-analysis location and the Argo float track lie within a region typically exposed to similar surface forcings from the Mistral and Tramontane winds (Testor and Gascard, 2006). However, notable warming and a salinity decrease ap-pears as sharp fluctuations in θ and S profiles taken by Argo float 6900279 in early winter, which have occurred despite NCEP/NCAR data proximate to the float trajectory suggest-ing strong surface heat loss. We suggest these contradictsuggest-ing results are due to the Argo float moving between different water mass regimes in the Catalan subbasin (Salat and Font, 1987), similar to observations of anomalous temperature and salinity changes in Argo float data in the Sea of Okhotsk by Ohshima et al. (2005). As such, stronger agreement be-tween heat content change computed from Argo float data and NCEP/NCAR heat loss for the 2004–2005 winter would be expected had we began cumulating heat loss after the float moved out from this warmer water mass regime.
We also note the combination of unusually shallow, warm and saline intermediate waters and saline surface waters in the Ligurian subbasin during winter 2005–2006. Such condi-tions mean the surface and intermediate waters require lower cumulative buoyancy loss to homogenise and subsequently, the “pre-conditioning” phase of deep convection exposing weakly stratified deeper waters to ML entrainment was con-cluded by mid-January in 2006 (Ligurian subbasin) com-pared to early March in 2005 (Catalan subbasin). These pre-conditioning processes have important consequences on the properties of nWMDW subsequently produced, which we later discuss.
4.2 The violent mixing phase
Observations during early March in the Catalan subbasin (12/03/2005) and Ligurian subbasin (13/03/2006) describe
well the “violent mixing” phase of deep convection (Marshall and Schott, 1999) with heat fluxes in both subbasins immedi-ately prior to deep water production of a similar magnitude to heat fluxes reported during convection events in the western basin from 1987 to 1992 (Marshall and Schott, 1999). The oWMDW detected prior to March 2006 in the Ligurian sub-basin has near identical properties to the oWMDW described by Salat et al. (2007) present in the deep layers of the western basin during the 2004–2005 winter. However, we note that nWMDW produced in the Catalan subbasin during the 2004– 2005 winter was not subsequently detected in either Argo float data or the DYFAMED time-series from the Ligurian subbasin during the 2005–2006 winter. We suggest this is possibly due to the higher density nWMDW produced in the 2004–2005 winter (+0.005 kg m−3 compared to oWMDW) sinking to a depth of neutral buoyancy beyond that which is sampled by Argo floats or the DYFAMED campaign, al-though a lack of observational data beyond 2000 m in the western basin reduce the integrity of this conclusion.
The timing of deep convection is found to be dependent on the integrated cooling and mixing of the water column occurring over the winter period (Schott et al., 1993) with heat fluxes and associated buoyancy losses identified as the dominant factor in the timing of deep convection (Mertens and Schott, 1998). Indeed, historical observations show that within the western basin, the “violent mixing” phase of deep-water production may occur between January and March (Schott et al., 1993; Schott and Leaman, 1991; Bunker, 1972; Mertens and Schott, 1998; Marshall and Schott, 1999). The results we present from both winters dating the violent mix-ing phase to March are consistent with a numerical modellmix-ing study by Beranger et al. (2007) and the 2004–2005 obser-vations are found to be coherent with the time series pre-sented by Font et al. (2007). Whilst the Ligurian subbasin experienced an “early” pre-conditioning phase during winter 2005–2006, heat losses (and instantaneous heat fluxes) were insufficient to trigger deep convection and production of nWMDW until March. The winter of 2004–2005 in the Cata-lan subbasin experienced particularly severe weather (L´opez-Jurado et al., 2005) yet nWMDW production did not occur until March. It is suggested that in the Catalan subbasin the water column experienced “ventilation” during Febru-ary with homogenisation of the upper water column, com-parable to brief, shallow convection described by Pinot and Ganachaud (1999), which can lead to formation of a WIW. Indeed, this study identifies a WIW at depths above the LIW in the waters north of the Balearic Islands, generated by such shallow-convection and consistent with earlier observations by Salat and Font (1987) and Fuda et al. (2000). Once the intermediate waters have been entrained into the ML at the end of February 2005, a Mistral storm event in early March ultimately triggered “complete” deep convection.
4.3 The sinking and spreading phase
Appearance of weak intermediate salinity maxima and mi-nor restratification of surface waters during late March 2005 and 2006 indicates the beginning of the “sinking and spread-ing” phase of nWMDW formation (Madec et al., 1991). This restratification over deep-mixed patches occurs over simi-lar time scales to those described by Jones and Marshall (1997). This reintegration of heat is enhanced in the Lig-urian subbasin by a supply of warmer surface waters orig-inating in the Tyrrhenian subbasin (Astraldi and Gasparini, 1992). The faster restratification noted in the Catalan sub-basin is attributed to a combination of stronger atmospheric heating and advection of stratified fluid from coastal waters surrounding the Balearic Islands (Salat and Font, 1987). Sub-sequent sinking and spreading of nWMDW were not appar-ent in any of the Argo float data, with the observation period and depths of sampling of the Argo floats limiting the study in this respect.
4.4 Argo float limitations
The observations we have detailed show Argo floats are ca-pable of detecting some of the processes and events associ-ated with both the “pre-conditioning” and “violent-mixing” phases of deep convection. A limitation of the Argo float data we present however, is the difficultly in mapping out the spatial distribution of surface buoyancy within the west-ern basin during early-winter. This is due to the intermittent space/time sampling of Argo floats with respect to sampling pre-conditioning regions that may exceed 1000 km2 (Jones and Marshall, 1997). It is for instance difficult to examine the upward doming of the σθ=28.8 isopycnal where the LIW is
brought up into shallower waters (Schr¨oder et al., 2006) and which typically marks the boundary of the pre-conditioning regions of the western basin (Marshall and Schott, 1999) using Argo float data alone. As such, we could not exam-ine how the surface buoyancy distribution during the early-winter may have acted to localise and limit the size of the subsequent deep convection regimes.
4.5 Unusual locations of deep convection
Typically, studies of deepwater production in the western basin have focused on the MEDOC region and Gulf of Lions where WMDW production has consistently been observed (Leaman and Schott, 1991; Font et al., 2007). We cannot be definite if the deep water sampled in the MEDOC re-gion during March 2006 was a signature of nWMDW formed there the previous winter or if it represents nWMDW formed within the MEDOC region (or wider western basin) during the 2005–2006 winter when the timing of Argo float deep-dive cycles within the MEDOC region may have missed the violent mixing phase and not sampled a deep mixed layer connected to the surface waters. To this end, we state that a
nWMDW was present at 2000 m in the Gulf of Lions during March 2006 with a signature consistent with the nWMDW produced the previous winter in the Gulf of Lions (Font et al., 2007).
Whilst the winters of 2004–2005 in the Catalan subbasin and 2005–2006 in the Ligurian subbasin experienced pre-conditioning and surface forcing consistent with that experi-enced in the MEDOC deep convective regime, MLDs have far exceeded March climatological MLD averages in both subbasins (D’Ortenzio et al., 2005). The special feature of the nWMDW formation noted between 2004 and 2006 is therefore the regions where deep convection has occurred. In relation to the Ligurian subbasin, Stommel (1972) identified “patches” of high density surface waters in the south-west of the subbasin, with Sparnocchia et al. (1995) suggesting deep convection was possible in the Ligurian subbasin but attribut-ing a failure to identify deep water production to weak pre-conditioning processes. Indeed, the 2004–2005 winter in the Ligurian subbasin did not experience deep convection due to a persistent layer of fresh surface water, yet the following year deepwater production did occur, which we attribute to surface forcing acting on the unusual cold and saline water column structure.
A number of nWMDW production events occurred in the 2004–2005 winter (L´opez-Jurado et al., 2005) with Canals et al. (2006) and Schr¨oder et al. (2006) indicating nWMDW formed off the Gulf of Lions shelf at 2000 m and also de-tected in the Provenc¸al subbasin with similar properties to the nWMDW identified in this study. Font et al. (2007) also ev-idence nWMDW production during March 2005 in the Gulf of Lions, subsequently detected at a deep mooring site off the Catalan coast. We however have found no previous evidence of deep convection so close to the Balearic Islands.
These studies are of interest because combined with data presented in this investigation, they show deepwater pro-duction during the 2004–2005 winter occurred in numer-ous regions of the western basin and was not constrained to the MEDOC region. This suggesting therefore that sur-face water densities exceeded 28.8 kg m−3over a wider re-gion than “typically” observed (Marshall and Schott, 1999) during the pre-conditioning phase of winter 2004–2005, ul-timately leading to an enlargement of the deep convective regime of the western basin during this winter (Salat et al., 2007). Furthermore, whilst unusual features facilitated deep-water production in the Ligurian subbasin the following win-ter, the deep convective regime of the western basin was also likely larger than usual with nWMDW detected simultane-ously in the MEDOC region and Ligurian subbasin. Such nWMDW production in the Catalan and Ligurian subbasins during successive years suggests that deepwater production is regionally variable and can occur in a number of regions within the western basin, where the meteorological and hy-drographic characteristics required for deepwater production coincide.
4.6 Interannual variability
Interannual differences between properties of nWMDW typ-ically formed each winter in the western basin are tradition-ally attributed to interannual variability in surface forcing (Mertens and Schott, 1998). Indeed the data presented in this study indicate the Catalan subbasin experienced larger heat losses and stronger heat fluxes than the Ligurian subbasin in both the 2004–2005 and 2005–2006 winter, which is consis-tent with observations of the particularly severe winter over the western basin in 2004–2005 (L´opez-Jurado et al., 2005). As such, nWMDW produced during 2004–2005 would be expected to be cooler than the nWMDW produced in 2005– 2006 (when heat fluxes were consistently weaker). However, interannual variations in forcing are not the only factors in-fluencing the properties of nWMDW. As noted, convective regions of the western basin that are characterised by higher salinity intermediate waters generate warmer but more saline MLs following pre-conditioning and subsequently produce (relatively) warm and salty deep waters. The same can also be said for higher salinity surface waters, which mix down more quickly when exposed to surface forcing. In the case of the Ligurian subbasin during the 2005–2006 winter, un-usual characteristics of both the AW and LIW prior to deep-water formation have affected the nWMDW properties. We note AW and LIW in the Ligurian subbasin during Novem-ber 2005 recorded salinities ∼0.13 and ∼0.014 above that of the same water masses observed the previous winter in the Catalan subbasin, which was followed in March 2006 by production of the warmest, most saline and densest WMDW on record.
4.7 Long term trends
Explanations of the long-term salinity and temperature trends in the WMDW have previously focused on a higher salinity LIW present in the western basin. This has been attributed to anthropogenic reductions in the freshwater budget of the eastern basin (Rohling and Bryden, 1992; Bethoux and Gen-tili 1999: Skliris and Lascratos, 2004) and subsequent alter-ations to salinity of the LIW during formation in the east-ern basin (Bryden and Boscolo, 2002) and also to long term changes to freshwater and heat fluxes of the Mediterranean Sea in relation to climatic cycles (Rixen et al., 2005; Send et al., 1999). Indeed, this study shows evidence of an in-creasingly saline LIW present in the western basin. Further-more, changes in the dense water flowing out of the Mediter-ranean Sea have been observed and suggest continuing trends of temperature and salinity increase are linked to a denser (saltier) water mass produced in the eastern basin (Millot et al., 2006). What triggered formation of this denser wa-ter mass is debatable, attributed to anthropogenic influences (Skliris and Lascaratos, 2004) or ”exceptional meteorologi-cal conditions” (Millot et al., 2006). In any case, a shift in the location of deepwater formation in the eastern basin from the
Adriatic to the Aegean subbasin took place post-1987 (Las-caratos et al., 1999) becoming known as the Eastern Mediter-ranean Transient (EMT) (Schr¨oder et al., 2006). The notable effect of the EMT has been a further increase in the salin-ity of the LIW (Klein et al., 1999), which may be modulat-ing changes to the LIW caused by reductions in the freshwa-ter budget of the easfreshwa-tern basin (Rohling and Bryden, 1992). Alternative explanations to the observed trends in WMDW properties include low rainfall inputs to the Mediterranean Sea raising the salinity of surface waters (Marty and Chi-averini1), consistent with the higher salinity AW present in the Ligurian subbasin during winter 2005–2006. We sug-gest that production of the warmest, most saline and densest WMDW during 2006 in the Ligurian subbasin was largely due to both an usually saline AW combined with a shal-lower, higher salinity LIW. Previous studies identify a warm-ing trend of 1.6–2.6×10⁻³ ◦C yr−1and a salinity increase of
9.45–10×10−3yr−1of the WMDW between the 1950s and
1990s (Bethoux et al., 1990; Rohling and Bryden, 1992), with later studies showing an acceleration of trends possibly reaching 5.4×10⁻³ ◦C yr−1and 2.0×10⁻³yr−1(Schr¨oder et al., 2006). This study observes a similar acceleration of such trends in the WMDW to those shown in Table 1, along with an increase in the σθ of WMDW of 4.0×10⁻⁴kg m−3yr−1
using data spanning 1955–2006.
In the eastern Catalan subbasin and the western Ligurian subbasin nWMDW production has occurred in two unusual locations, revealed from Argo float data. Argo float data shows promise for future monitoring of deep convection and water mass properties in the Mediterranean Sea, in conjunc-tion with continued ship based sampling campaigns and time series moorings. During future Argo based studies, a com-plementary ship survey during the early winter would assist in quantifying surface buoyancy distribution and water col-umn structure prior to convection, to investigate further how these factors facilitate deep water production in the Catalan and Ligurian subbasins.
Acknowledgements. The Argo data were collected and made freely available by the International Argo Project, the national programs contributing to it, and the MedArgo program supported by the European Commission through the MFSTEP project (http://www.Argo.ucsd.edu,http://Argo.jcommops.org). Argo is a pilot program of the Global Ocean Observing System. The authors also acknowledge the referees for their thoughtful comments for improving the manuscript.
Edited by: S. Josey
1Marty, J.C., and Chiaverini, J.: Abrupt warming and salting of
deep Mediterranean Sea in 2006, Geophys. Res. Lett., in review, 2008.