HAL Id: hal-01422545
https://hal.archives-ouvertes.fr/hal-01422545
Submitted on 26 Dec 2016
HAL is a multi-disciplinary open access archive for the deposit and dissemination of sci-entific research documents, whether they are pub-lished or not. The documents may come from teaching and research institutions in France or abroad, or from public or private research centers.
L’archive ouverte pluridisciplinaire HAL, est destinée au dépôt et à la diffusion de documents scientifiques de niveau recherche, publiés ou non, émanant des établissements d’enseignement et de recherche français ou étrangers, des laboratoires publics ou privés.
Pelagic food web patterns: do they modulate virus and
nanoflagellate effects on picoplankton during the
phytoplankton spring bloom?
Pascaline Ory, Hans Hartmann, Florence Jude, Christine Dupuy, Yolanda del
Amo, Philippe Catala, Françoise Mornet, Valérie Huet, Jan Benoit, Dorothée
Vincent, et al.
To cite this version:
Pascaline Ory, Hans Hartmann, Florence Jude, Christine Dupuy, Yolanda del Amo, et al.. Pelagic food web patterns: do they modulate virus and nanoflagellate effects on picoplankton during the phytoplankton spring bloom?. Environmental Microbiology, Society for Applied Microbiology and Wiley-Blackwell, 2010, 12 (10), pp.2755-2772. �10.1111/j.1462-2920.2010.02243.x�. �hal-01422545�
Article published in Environmental Microbiology (2010) 12(10), 2755–2772 1
2 3
Pelagic food web patterns: do they modulate virus and nanoflagellate effects on
4picoplankton during the phytoplankton spring bloom?
56
Pascaline Ory1*†, Hans J. Hartmann1†, Florence Jude2, Christine Dupuy1, Yolanda Del Amo2, 7
Philippe Catala3, Françoise Mornet4, Valérie Huet1, Benoit Jan1, Dorothée Vincent5, Benoit 8
Sautour2, Hélène Montanié1† 9
10
1 Littoral, Environnement et SociétéS (LIENSS) Université de La Rochelle UMR 6250 CNRS-ULR, 2 rue
11
Olympe de Gouges, 17042 La Rochelle Cedex, France
12
2 Environnements et Paleoenvironnement Océaniques (EPOC) Université de Bordeaux 1 UMR 5805 CNRS, 2
13
rue du Professeur Jolyet, 33120 Arcachon, France
14
3 Observatoire Océanologique de Banyuls-sur-Mer UMR 7621 CNRS-Université Pierre et Marie Curie, Avenue
15
Fontaulé, 66650 Banyuls-sur-Mer, France
16
4 UMS 3109 CNRS-IFREMER Environnement Littoral Atlantique, Place du Séminaire, 17137 L’Houmeau,
17
France
18
5 Laboratoire d’Océanologie et de Geosciences (LOG) Université du Littoral Coté d’Opale UMR CNRS 8187, 32
19
avenue Foch, 62930 Wimereux, France
20
*Corresponding author: Tel +335 46 45 83 14 E-mail address: [email protected]
21
† These authors contributed equally to this work
22 23 24
Running title:
25Effects of viruses and nanoflagellates on picoplankton 26
Summary
27As agents of mortality, viruses and nanoflagellates impact on picoplankton populations. We 28
examined the differences in interactions between these compartments in two French Atlantic bays. 29
Microbes, considered here as central actors of the planktonic food web, were first monitored 30
seasonally in Arcachon (2005) and Marennes-Oléron (2006) bays. Their dynamics were evaluated 31
to categorize trophic periods using the models of Legendre and Rassoulzadegan (1995) as a 32
reference framework. Microbial interactions were then compared through 48h-batch-culture 33
experiments performed during the phytoplankton spring bloom, identified as herbivorous in 34
Marennes and multivorous in Arcachon. Marennes was spatially homogeneous compared to 35
Arcachon. The former was potentially more productive, featuring a large number of heterotrophic 36
pathways, while autotrophic mechanisms dominated in Arcachon. A link was found between 37
viruses and phytoplankton in Marennes, suggesting a role of virus in the regulation of autotroph 38
biomass. Moreover, the virus-bacteria relation was weaker in Marennes, with a bacterial lysis 39
potential of 2.6% compared with 39% in Arcachon. The batch experiments (based on size-40
fractionation and viral enrichment) revealed different microbial interactions that corresponded to 41
the spring-bloom trophic interactions in each bay. In Arcachon, where there is a multivorous web, 42
flagellate predation and viral lysis acted in an opposite way on picophytoplankton. When together 43
they both reduced viral production. Conversely, in Marennes (herbivorous web), flagellates and 44
viruses together increased viral production. Differences in the composition of the bacterial 45
community composition explained the combined flagellate-virus effects on viral production in the 46 two bays. 47 48
Introduction
49The long held paradigm that primary production is transferred through a herbivorous chain to small 50
and large phytovores neglects the importance of most microorganisms. Yet bacteria, which are 51
dominate in the oceans (Borsheim et al., 1990; Hennes and Suttle, 1995; Li, 1998). Bacteria were 53
primarily considered as remineralizers providing inorganic nutrients for primary producers. Later, 54
the microbial loop concept (Azam et al., 1983) highlighted the role of bacteria as recyclers of DOM 55
originating either from primary production or from losses at different trophic levels. Thus, the role 56
of bacteria in the microbial loop evolved from that of a matter sink to a trophic link towards 57
bacterivorous organisms. Moreover, bacterial community dynamics are not only controlled by 58
resources i.e. bottom-up control, such as the availability of inorganic nutrients and the quality of 59
DOM (Kirchman et al., 2000), but also by predation i.e. top-down control, examples being the 60
mortality induced by protists such as nanoflagellates and ciliates and by viral lysis. (Sanders et al., 61
1992; Fuhrman, 1999). The selectivity of protist predation based on size, motility, shape and cell 62
surface properties of prey (Gonzalez et al., 1990; Monger et al., 1999) can potentially impact on the 63
morphological characteristics of bacteria and shape their community composition (BCC) (Hahn and 64
Hofle, 2001; Posch et al., 2001). On an ecosystem level, protist predation may exert a stronger 65
control in oligotrophic waters than in eutrophic waters (Gasol et al., 2002). 66
Since the 1990’s, viruses have been considered as an additional factor in the mortality of bacteria 67
(Fuhrman, 1999), other micro-organisms such as microalgae (Cottrell and Suttle, 1995) and 68
unpigmented flagellates (Garza and Suttle, 1995; Massana et al., 2007). Virus-mediated bacterial 69
mortality could account for 48-84% of bacterial production in oligotrophic areas and 59% in 70
eutrophic areas (Boras et al., 2009). Regarding the biogeochemical aspects of the ecosystem, viral 71
lysis shunts carbon flow (Fuhrman, 1999): 6 to 26% of photosynthetically fixed carbon flows back 72
to DOM, becoming available for microbial uptake and consequently modifying the competitive 73
balance of phytoplankton and bacteria for limiting nutrients (Wilhelm and Suttle, 1999). Moreover, 74
viral infection could potentially maintain the species richness of bacteria, as described in the “kill 75
the winner” concept (Thingstad and Lignell, 1997). The density dependence of viral infection could 76
limit dominant and competitive bacteria and give an advantage to less competitive ones (Bouvier 77
and Del Giorgio, 2007; Weinbauer et al., 2007; Auguet et al., 2009), although this idea is still 78
controversial (Winter et al., 2004). In addition, host specificity could concern strains instead of 79
species because of the phenotype plasticity of the viral permissivity-resistance characters 80
(Schwalbach et al., 2004; Fuhrman, 2009). 81
Even if virioplankton is mainly composed of bacteriophages (Fuhrman, 1999; Suttle, 2005), a link 82
with phytoplankton or chlorophyll a concentrations, suggesting phytophage pathogenicity 83
(Wommack and Colwell, 2000), has already been underlined in some long term surveys where there 84
were high densities of algal cells (Maranger et al., 1994) as well as in offshore stations (Boehme et 85
al., 1993; Guixa-Boixereu et al., 1999) or in coastal regions at the deep chlorophyll a maximum 86
(Baudoux et al., 2008). Organisms less than 3µm in size may be responsible of large part of primary 87
production, in particular in oligotrophic areas (Platt et al., 1983). Autotrophic as well as 88
heterotrophic pico- and nanoplankton are too small to be efficiently consumed by metazoans (Sherr 89
and Sherr, 1988); they are mainly consumed by flagellates and ciliates (Sherr and Sherr, 1994) and 90
can significantly contribute to their diet (Hirose et al., 2008). However, the grazing yield from 91
phytoplankton is lower than from bacteria. Furthermore, predation on protists indirectly affects 92
bacterial grazing, enhancing viral impact (Boras et al., 2009). Thus, as the preferential prey of 93
copepods (Nielsen and Kiorboe, 1994), ciliates can be considered as a trophic link between pico- 94
and nano-plankton and mesozooplankton (superior trophic levels) (Calbet and Saiz, 2005). 95
To assess the importance of microbiological plankton compartments in matter flow, Legendre and 96
Rassoulzadegan (1995) described 4 major trophic concepts each incorporating different dominant 97
carbon pathways: (1) The herbivorous or classical food web, which is based on large-phytoplankton 98
(>5µm) primary production leading to large zooplankton organisms. (2) The microbial food web, in 99
which primary production is mainly due to small phytoplankton and comprises pathways involving 100
heterotrophic bacteria and protozoa. (3) The microbial loop, a nearly closed system where carbon 101
flows are limited to heterotrophic bacteria and unpigmented protists; DOM released by the grazers 102
becomes substrate for bacteria. (4) Finally, the multivorous food web, a transitional trophic system 103
comprising diverse heterotrophic carbon pathways in which both large and small phytoplankters are 104
significant primary producers. 105
Accordingly, the question arises: do the interactions between microbial compartments (in particular 106
between viruses, picoplankton and nanoflagellates) vary depending on the trophic pathway? So far, 107
despite the clear importance of heterotrophic microorganisms in pelagic food webs, descriptions of 108
trophic models have mostly been based on primary producer size, water column stratification and 109
nutrients (Rivkin et al., 1996; Marquis et al., 2007). Thus, to answer this question, two sites along 110
the French Atlantic coast that are distinctive in terms of their river inputs and hydrology (shape, 111
mixing regime and water residence time) were chosen as study case areas to describe the temporal 112
succession of trophic pathways. The temporal dynamics of abiotic parameters and microbiological 113
compartments were assessed over 7 months in Arcachon Bay in 2005 and over one year in 114
Marennes Oléron Bay in 2006. Located North-Southward along the coast of the Bay of Biscay, 115
Arcachon and Marennes-Oléron Bays are both semi-enclosed and macrotidal lagoons, largely 116
composed of intertidal mudflats (Blanchet et al., 2008; Allard et al., 2009). Like many estuaries and 117
bays, the 2 basins are highly productive, featuring a large-phytoplankton spring bloom (Struski and 118
Bacher, 2006; Glé et al., 2008). In this context, does the large-phytoplankton spring bloom entail 119
similar trophic pathways in each bay and thus similar interactions between the above-mentioned 120
microbial compartments? To answer this question, we first defined the trophic succession for each 121
bay, then located the spring phytoplankton bloom within this succession, and finally in vitro 122
experiments were performed during this period to analyse the quantitative and qualitative impact of 123
nanoflagellate grazing and viral lysis on picoplankton. 124
125 126 127 128
Results
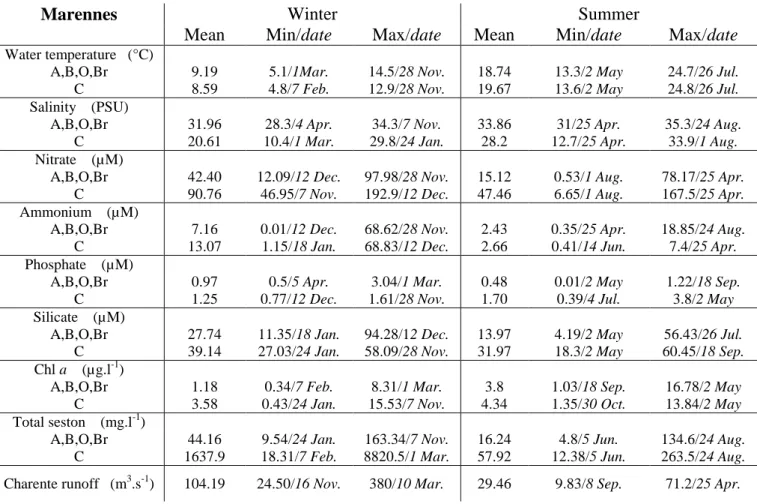
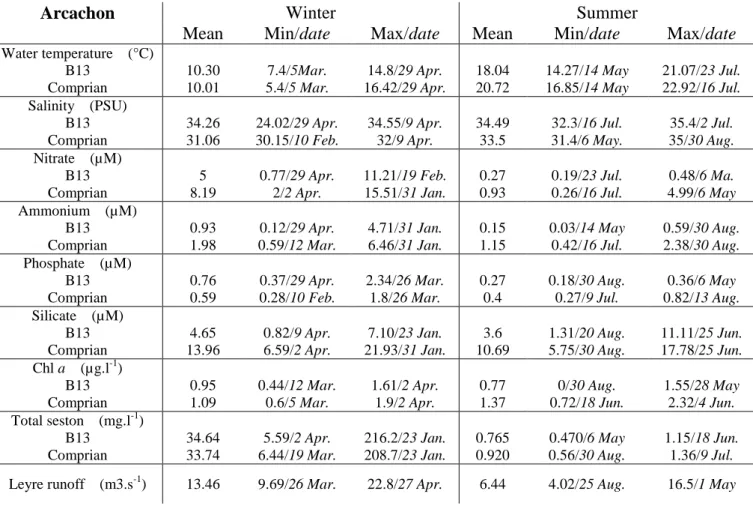
130 IN SITU SURVEYS 131 Environmental context 132The evolution of the abiotic parameters in the 2 bays followed a typical temperate-coastal pattern 133
featuring peak temperatures and salinities in the summer together with low nutrient levels during 134
the period of low runoff. On average, Arcachon Bay (Arc) had fewer nutrients than Marennes (M-O) 135
(Table S1 and S2). Arc waters were spatially heterogeneous, with significant differences of salinity, 136
temperature and most nutrients between the 2 stations (ANOVA, H0 no difference between stations
137
is rejected, p<0.05). By contrast, M-O was homogeneous over 4 of the 5 stations (ANOVA p>0.05). 138
The Charente station differed from the four others, with higher nutrient levels and lower salinity 139
(ANOVA with Tukey multiple comparisons, p>0.05) (Table S1). 140
141
Zonation and seasonality of microbial distribution 142
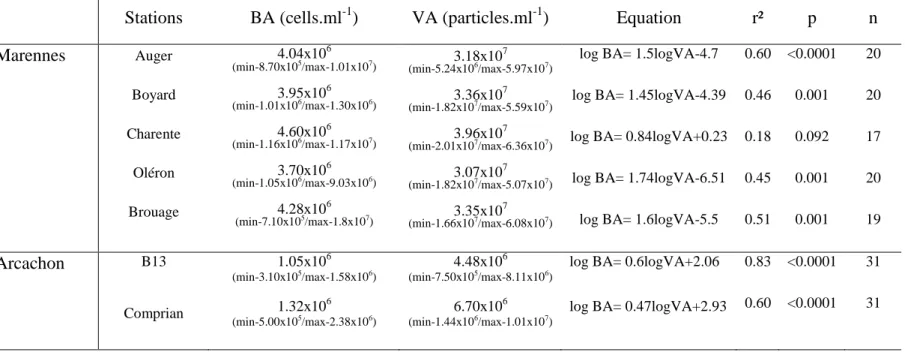
The bacteria/virus relationship (r²≥0.6) in Arc was stronger than in M-O. However, the response of 143
bacteria to increasing viruses was weaker in Arc (log/log regression slopes ≤ 0.6) than in M-O 144
(slopes ≥ 0.84, Table 1). In Arc, bacterial (BA) and viral (VA) abundances in Comprian were 145
significantly higher than in B13 (ANOVA, p < 0.0002, Table 1). In M-O, the BA/VA relationship 146
was equal in 4 of the 5 stations (Slope comparison, ANCOVA, p<0.05, n=96), but the relationship 147
was insignificant at Charente station (p=0.09) (Table 1). Nevertheless, no significant differences in 148
the annual abundance of viruses and bacteria were found between the 5 stations (ANOVA, p<0.05). 149
Consequently, the global monthly and annual means (BA: 4.11±0.34x10⁶ cells.ml-1 and VA: 150
3.38±0.34x10⁷ particles.ml-1) are representative for the whole basin. The VBR (virus to bacteria 151
ratio) was higher in M-O (annual mean= 11.16 ± 5.39) compared to Arc (4.06 ± 1.17 and 4.89 ± 152
1.96 at B13 and Comprian, respectively). In M-O, VBR tended to be higher from November to 153
April (>10) and lower during summer (<10), while no trend was visible in Arc (data not shown). 154
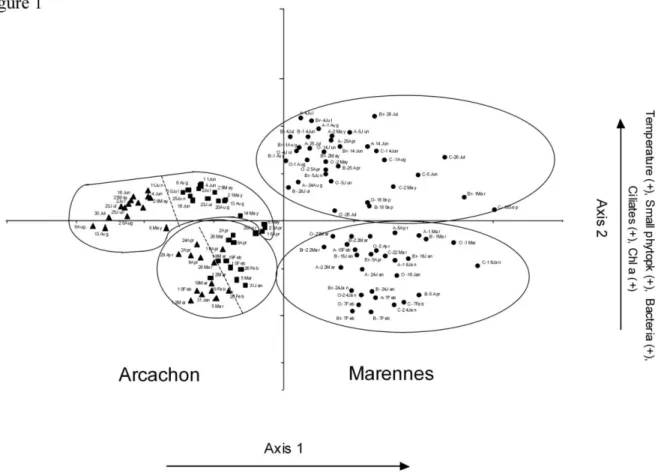
The results of PCA and HAC were analysed to compare the spatial and temporal organization of the 155
2 bays (Fig. 1). Only samples from January to August were taken into account. Nutrients (23%) and 156
viruses (7.5%) contributed positively to axis 1 while Cryptophyceae (10%), salinity (5%), diatoms 157
(5%) and Synechococcus (5%) contributed negatively. Small phytoeukaryotes (16%), temperature 158
(14%), bacteria (12.5%) and ciliates (12.5%) contributed positively to axis 2. The 2 axes accounted 159
for 52.67% of the total variance among the samples. Along the first axis, Arc was distinguished 160
from M-O by low nutrients (Table S1), a high abundance of autotrophs [Diatoms (mean: 161
3.52±4.17x10⁵cell.l-1 vs. 0.65±1.45x10⁵cell.l-1), Cyanobacteria (mean: 1.77±2.83x10⁴ vs. 162
3.9±2.9x10³cell.ml-1), Cryptophyceae (6.46±5.17x10⁴ vs. 13±28cell.l-1)], as well as low VA 163
(5.71±5.23x10⁶ vs. 3.37±1.21x10⁷ particles.ml-1). Seasonal clusters were found along the second 164
axis for both basins (“winter”: January - April and “summer”: May - August), principally due to 165
higher summer temperatures combined with a higher abundance of microorganism in Arc (bacteria, 166
ciliates and pico- nanophytoplankton). Furthermore, a spatial subdivision appeared in Arc along 167
axis 1, distinguishing the inner (Comprian) from the outer (B13) sampling station. By contrast, the 168
M-O stations were homogeneous, although the Charente station points were always shifted to the 169
right because of a lower salinity and a higher level of nutrients. Moreover, the Charente station was 170
also distinguished by large amounts of suspended matter (Table S1). 171
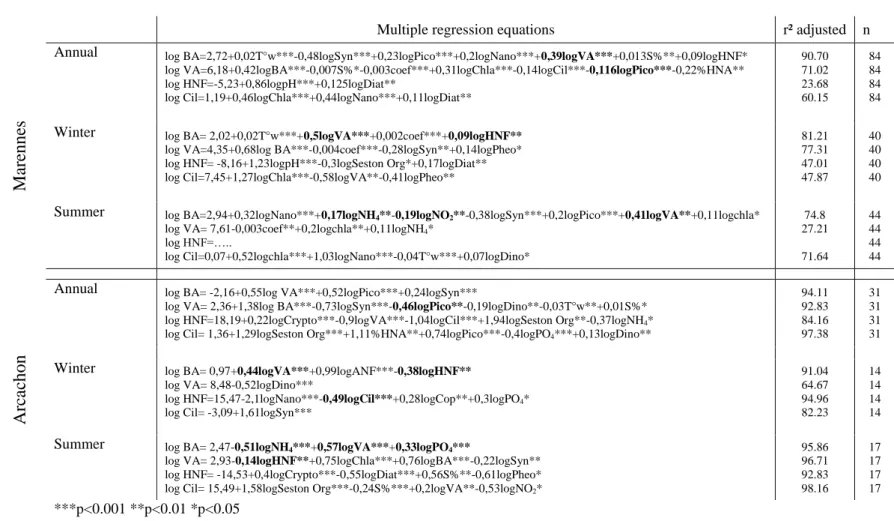
Based on the results of this multivariate assessment, the basin dynamics were further distinguished 172
using the inner station of Arc (Comprian) and averages of the five M-O stations (because of their 173
spatial homogeneity) using multiple regressions. VA and BA dynamics can be related to the more 174
complex relationships in M-O compared to Arc (Table 2). The opposite was observed for 175
heterotrophic nanoflagellates. There are several important details: (i) in winter, BA was positively 176
related to viruses in both bays and to HNF in M-O but negatively in Arc. In summer, only the link 177
with viruses remained along with supplementary links with nutrients (ammonium, nitrite and 178
phosphate); (ii) there was a negative relationship between viruses and picophytoplankton all year 179
long in both bays as well as with HNF in Arc during the summer; viruses were positively linked to 180
chla all year round in M-O but not in Arc. (iii) HNF were negatively related to ciliates during winter 181
(Table 2). 182
183
Temporal succession of trophic pathways 184
Herbivorous food webs were identified for 20% of the sampling period in Arc (February and 185
August) and for 27% of the period in M-O (May and July-August, Fig. 2A,B). Multivorous webs 186
were present for 21% of the period in Arc (May and the second half of August) and for 25% of the 187
period in M-O (3 weeks in February-March and 2 months between October and mid-188
December). The microbial food web represented about half of the sampling period in both bays, yet 189
they were not synchronized, except during March-April (Fig. 2). Finally, the microbial loop was 190
absent in Arc, while it was present for 5% of the period in M-O (two weeks at the end of March and 191
one in September). During these two periods, bacteria grew 2.0x and 2.4x, viruses 2.0x and 2.0x, 192
nanoflagellates 6.7x and 1.5x and ciliates 0 and 20x, respectively (Fig. 2B, “Microbial loop”). 193
BA and VA evolved in parallel during all the trophic periods in Arc. However, the synchronisation 194
was less obvious in M-O, particularly during the herbivorous and multivorous phases when VA did 195
not decrease as much (-1.6x) as BA (-2.1x). 196
In Arc, the small phytoplankton (annual mean = 3.4±1.5x10⁴ cells.ml-1) were dominated by 197
picoplankton, with 3 major growth periods (early April, early May accompanied by nanoplankton, 198
and from mid-June to end of July, also accompanied by nanoplankton). Large-phytoplankton, with 199
an annual mean of 4.73±4.16x10⁵ cells.l-1, dominated at the beginning of the year, with mainly 200
dinophyceae and cryptophyceae species; this was followed later by two diatom peaks (mid-May and 201
late August). Three periods of growth of small phytoplankton were observed in M-O (annual mean 202
= 1.98±1.71x10⁴ cell.ml-1) that were mostly due to picoplankton (end of April, 4.9x10⁴ cells.ml-1, 203
early June, 6.8x10⁴ cells.ml-1 and early July, 4x10⁴ cells.ml-1). Large-phytoplankton (annual 204
mean=7.05±14.6x10⁴ cells.l-1) developed at the end of March (mainly diatoms), early May (mainly 205
diatoms) and early July (diatoms and dinoflagellates). Moreover, picophytoplankton and large 206
phytoplankton accounted for the viral dynamics during the herbivorous and multivorous periods in 207
M-O (simple regression, p=0.01 and p=0.006, respectively). 208
Nanoflagellate numbers increased systematically during the microbial phases in both Arc and M-O 209
at the beginning of the herbivorous and multivorous periods, just before the large-phytoplankton 210
blooms. Small cells dominated in the latter (annual mean: 88.2±6.9% <3µm cells, Fig. 2). In Arc, 211
the pigmented/unpigmented ratio of nanoflagellates was higher (mean=11.6 vs. 3.9 in M-O). 212
Ciliate dynamics followed those of bacteria in M-O except in mid-February (Fig. 2B). 213
Heterotrophic species dominated (annual mean of Strombidium spp plus Strobilidium spp: 55% and 214
48% of the total abundance, respectively). The only exception was during the spring phytoplankton 215
bloom when autotrophic and potentially autotrophic taxa (Myrionecta rubra, Tontonia spp, Laboea 216
sp) represented 60% and 80% of the total abundance. In Arc, ciliate dynamics followed those of 217
nanoflagellates, increasing during the microbial food web periods. 218
Finally, beyond the fact that the changes in the trophic pathways in the two bays are not 219
synchronized, the major difference was the contrasting organization at the beginning of the year, 220
which was herbivorous in Arc and microbial in M-O. Moreover, during the large-phytoplankton 221
spring blooms, M-O featured a herbivorous web pathway while Arc was in a multivorous phase. 222
223
IN VITRO EXPERIMENTS
224
Experiments were performed with water from Arcachon-Comprian (2006; T°in situ= 18.6°C; S= 32 225
PSU) and the Marennes-Station E (2007; T°in situ= 15°C; S= 32.5 PSU) collected at morning high 226
tide. During incubation, the nighttime/daytime water temperature varied from 19.5°C to 23.3°C in 227
Arc and from 18°C to 22°C in M-O, respectively. 228
229
Protists 230
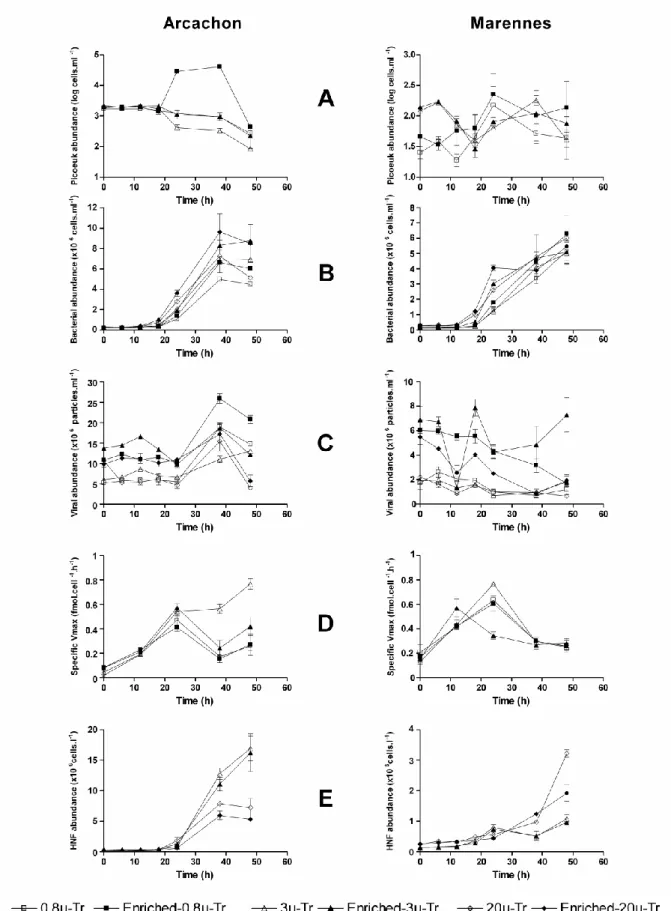
In Arc, the abundance of picophytoeukaryote (picoeuk) was equivalent in all treatments at the 231
beginning of the experiment (1.8x10³cells.ml-1). In the absence of predators, virus enrichment had a 232
positive effect from 18h to 38h, during which picoeuk abundance increased 18-fold (Fig. 3A). But 233
in the presence of flagellates, picoeuk abundance dropped 4.5-fold. In M-O water, the abundance of 234
picoeuk was not significantly different between treatments despite an initial difference due to the 235
filtration step. 236
Pigmented nanoflagellates were few and varied little in both sites, (means: 6.4x10⁴cells.l-1 in Arc 237
and 9.6x10⁴cells.l-1 in M-O), making up <1% and <10% of the total nanoflagellates, respectively. 238
The nanoflagellates started growing at 18h (Fig. 3E). Their growth rates were 2- to 4-fold higher in 239
Arc than in M-O (in 3µ-Tr and 20µ-Tr respectively). Moreover, in both bays, the nanoflagellates in 240
the latter were significantly higher than in 3µ-Tr (2way-ANOVA p<0.01) while the small cells 241
(<3µm) dominated and grew more rapidly than the large ones. During the 48h incubations, the 242
small/large flagellate ratio increased from 5 to 100 in Arc and from 1.5 to 20 in M-O. 243
244
Bacterial abundance and growth rate 245
During the different treatments, bacterial abundance after 48h increased 20-35 fold in Arc 246
(stationary phase) and 20-60 fold in M-O (logarithmic phase) (Fig. 3B). In Arc, the net bacterial 247
abundance increase (NBI) was always significantly greater in virus enriched treatments (p=0.005). 248
In M-O, the viral enrichment enhanced BA only in the 0.8µm treatments (p<0.05). 249
The maximum specific bacterial growth rate (µmax) showed significant differences between 250
treatments: µmax was significantly higher in both bays with virus-enriched treatments compared to 251
the corresponding controls (2way ANOVA, p=0.02) (cf Fig. 3B black versus clear symbols). The 252
growth stimulation was 9-14% in Arc and 12-33% in M-O. However, the presence of flagellates did 253
not significantly modify µmax in either of the bays (20µm and 3µm treatments versus 0.8µm 254
treatments; Fig. 3B) 255
In Arc, during the exponential phase, the growth rate of population 6 of HNA cells, which were the 256
most abundant, was stimulated in enriched-0.8µ-Tr (+44%) compared to the control, while 257
populations 3, 4 and 5 were inhibited. The presence of flagellates (3µ and 20µ treatments) masked 258
this particularity. In M-O, the growth rate of population 3 in the presence of flagellates was 259
significantly higher than those of the other populations (data not shown). 260
261
Viral abundance and production 262
The initial viral abundance was multiplied 2-3-fold in enriched-treatments in both Arc and M-O 263
(Fig. 3C). In Arc, some viruses were produced during the first 12 hours, except in 20µ-Tr. A second, 264
stronger production phase was observed between 24 and 38h in all treatments, persisting till the end 265
of the experiment in 3µ-Tr. The presence of flagellates significantly decreased the total viral 266
production rate (-50% in 3µ-Tr and -75% in 20µ-Tr) from 0.04 h-1 in 0.8µ-Tr to 0.02 h-1 in 3µ-Tr 267
and to 0.01 h-1 in 20µ-Tr (2way-ANOVA, p=0.0002). Moreover, viral enrichment decreased the 268
viral production rate notably in presence of small predators (-47.5%, p=0.009) and in their absence, 269
yet not significantly (-23%; p=0.1). In M-O, VA evolved differently with the various treatments: 270
viruses were produced between 12 and 18h only in the presence of flagellates (3µ- and 20µ-271
treatments). There was a second production phase from 38h in all treatments except in the enriched-272
0.8µ-Tr and 20µ-Tr. The net viral production over 48h was negative (-31%, -72%, -5.3%, -70% and 273
-65% in 0.8µ-Tr, enriched-0.8µ-Tr, 3µ-Tr, 20µ-Tr and enriched-20µ-Tr respectively) except in 274
enriched-3µ-Tr (+5.8%). In contrast to Arc, a combination of the presence of flagellates and virus 275
enrichment increased 2.5-fold the total viral production rate (from 0.01 h-1 in 0.8µ-Tr to 0.025 h-1 in 276
enriched-3µ-Tr). The addition of viruses alone had the opposite effect (2way-ANOVA, interaction, 277
p=0.006), inducing a significant 6.5-fold decrease (from 0.01 h-1 in 0.8µ-Tr to 0.0016 h-1 in 278
enriched-0.8µ-Tr). 279
280
Virus mediated bacteriolysis 281
In Arc, we calculated that 70±15% of the bacterial stock was lysed per day (0.8µ-Tr). In the 282
presence of flagellates, this impact decreased significantly to 33.7±1.9% (3µ-Tr) and 39±11% (20µ-283
Tr) (ANOVA: p=0.01). By contrast, virus mediated lysis was less severe in M-O (13.6±1.7% of 284
bacterial stock lysed per day without any predators). Small flagellates had no effect (9.4±4.6% in 285
3µ-Tr, p>0.05). However, in the presence of all the flagellates (20µ-Tr), the percentage of lysed 286
bacteria significantly decreased to 2.6±0.3% (ANOVA, p=0.009). 287
288
Bacterial enzymatic activity and community composition 289
In Arc, the change in specific maximum velocity of potential aminopeptidase activity (specific 290
Vmax) was similar in all treatments, with a peak at 24h. Specific activity dropped at 38h except in 291
3µ-Tr, where a strong activity was maintained until the end of the experiment (Fig. 3D). There was 292
a negative relationship between picoeuk abundance and bacterial proteolytic activity, which was 293
significant only in the presence of flagellates (Simple regression: r²=92% p<0.0001 n=15 in 3µ-Tr, 294
r²=29% p=0.022, n=15 in enriched-3µ-Tr). The specific Vmax peaked also at 24h in M-O, except in 295
the enriched-3µ-Tr at 12h. In both bays, peaks of activity occurred during the exponential growth 296
phase of bacteria (Fig. 3B, D). Moreover, a decline in bacterial activity coincided with an increase 297
in viral abundance in both bays: in M-O, there was a negative relationship between VA and specific 298
Vmax in the 0.8µ and 3µ treatments (log VA=4.11-0.63 x logVmax, r²=0.15, n=60, p=0.002). This 299
relationship was still significant (r²=0.13, p=0.007) when 20µ treatments were taken into account. 300
301
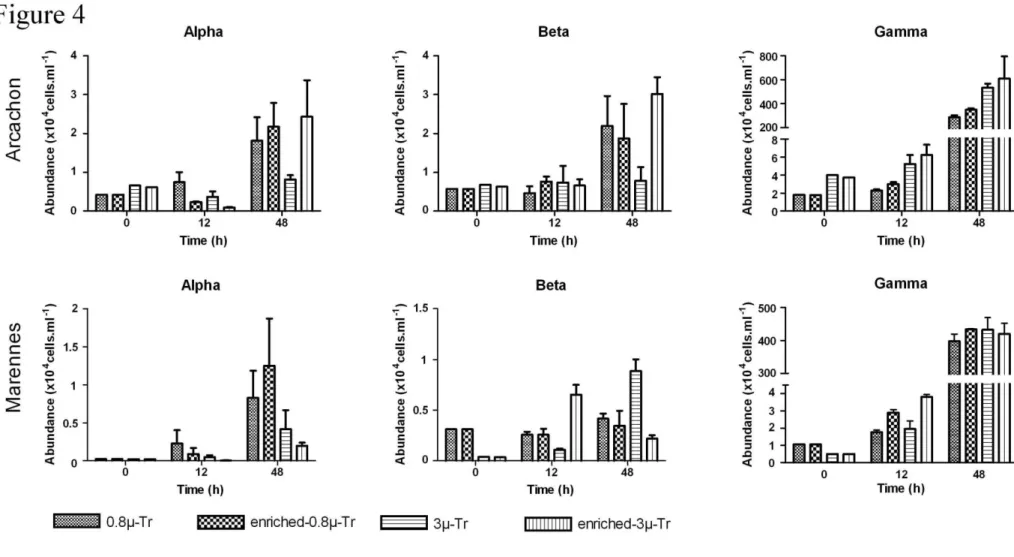
At the beginning of the incubations, the Eubacteria were less FISH-targeted in Arc (53% of 302
DAPI stained bacteria in 0.8µ-Tr and 35% in Tr) than in M-O (62% in 0.8µ-Tr and 81% in 3µ-303
Tr). In Arc, the dominance of γ-proteobacteria (Gamma) was further increased in the presence of 304
small nanoflagellates (15% versus 8%), while α- and β-proteobacteria (Alpha and Beta) were 305
present in relatively similar proportions (2-2.5%) (Fig. 4). In M-O, Gamma were more numerous in 306
the 0.8µ treatments (8.9%) than in the 3µ treatments (3%), while among the other groups, only Beta 307
in 0.8µ-Tr showed up significantly (2.6%). 308
Over 48h, the proportion of Eubacteria increased in both bays (78-85% in Arc, 83-90% of 309
total cells in M-O), with a dominance of Gamma. However, while the proportion of Gamma at 48h 310
was higher in Arc in the presence of flagellates (70±5.4%) than in their absence (58±3%), 311
independent of viral enrichment, Gamma dominated in M-O (≈80%) with no difference between 312
treatments (Fig. 4). Furthermore, at 48h in Arc, a positive effect of viruses was observed on Beta 313
and Alpha in the presence of flagellates (+38% in enriched-3µ-Tr compared to the control 0.8µ-Tr), 314
counterbalancing the negative impact of predators (-65% in 3µ-Tr). However, earlier on, at 12h, 315
Alpha cells were sensitive to virus inputs (-70% and -75% in enriched-0.8µ-Tr and enriched-3µ-Tr 316
respectively, compared to the corresponding control). In M-O, among the rare groups, Alpha 317
increased notably in virus-enriched treatments without predators at 48h (+50% in enriched-0.8µ-Tr). 318
By contrast, nanoflagellates restrained their growth (-49.6% in 3µ-Tr compared to the 0.8µ-Tr 319
control), and even more so after viral enrichment (-76.2% in enriched-3µ-Tr) (Fig. 4). Conversely, 320
the combined effect of nanoflagellates and viruses resulted in an increase of Beta cells at 12h 321
(enriched-3µ-Tr) while the presence of flagellates alone reduced Beta growth (3µ-Tr versus 0.8µ-322
Tr). At 48h, this pattern was reversed: Beta cells increased in the presence of flagellates (+112% 323
compared to the control) while they decreased with additional viral enrichment (-50%). 324
325
Discussion
326For each site, the survey concerned only one year without taking into account the potential inter-327
annual variability of microbial dynamics in the pattern of trophic succession (Guarini et al., 2004; 328
Glé et al., 2007). Unfortunately, due to logistic restricitions, the comparison of the bays had to be 329
carried out for two adjacent years, and the bias of inter-annual variability cannot be assessed. 330
After in situ surveys of one year, 48h in vitro incubation experiments were performed with different 331
water categories treated by differential filtration, corresponding to a top-down manipulation of 332
microbial compartments and consequently the removal of predators. Because of the complexity of 333
the microbial food web, with parameters such as predation/competition links and the size overlap of 334
predators and competitors, the size-fractionation method may reduce or eliminate some elements of 335
normal trophic webs. Currently employed methods, including artificially composed trophic webs, 336
necessarily simplify natural systems. We consider that, of those currently employed, the filtration 337
method is one which involves the least disturbance of the webs (Chen et al., 2009). 338
339
Temporal trophic succession 340
Several previous studies have analysed seasonal production patterns in Arcachon Bay (Arc) (Robert 341
et al., 1987; Glé et al., 2008) and Marennes Bay (M-O) (Guarini et al., 1998; Struski and Bacher, 342
2006). In Arc, river runoff and high levels of tidal exchange create a gradient of nutrients along the 343
basin, except for phosphate (Glé et al., 2008). Seasonally, as in our study, Arc is early nutrient 344
limited with a depletion of nitrate from May to the autumn and of phosphate during spring. In M-O, 345
nutrient availability was higher and limitations were only encountered episodically during certain 346
years (Soletchnik et al., 1998; Struski, 2005). However, during our 2006 in situ survey, no 347
limitations were found. Based on our multivariate analysis, Arc is spatially heterogeneous while M-348
O is spatially homogeneous, despite the influence of the Charente River. Moreover, as already 349
illustrated by Soletchnik et al. (2007), seasonal variations, characterized by changes in salinity, 350
temperature and chla are higher in M-O than in Arc. 351
Our trophic organization framework was based on microbiological and environmental dynamics, as 352
proposed by Legendre and Rassoulzadegan (1995). Mousseau et al. (2001) illustrated the 353
periodicity of trophic organization using ratios of biomasses, production and uptake rates. For the 354
present study, the entire spectrum of abundance from virioplankton to mesozooplankton were used 355
in a similar manner to Rodriguez et al. (2000). We used microbial abundance instead of biomass 356
since the contact rates between virus/host cells or prey/predator determine viral infections and 357
grazing rates. Our empirical trophic-period definitions were validated by a factorial discriminant 358
analysis (FDA) in which the discriminant variable was the defined trophic model (Fig. S1). The 359
clusters remained separated even in the absence of the abundance data used for characterizing the 360
trophic organization (Lambda Wilks test, p<0.05). 361
The microbial food web dominated in the two bays for 54% and 43% of the seven months of the 362
surveys in Arc and O, respectively; although this consisted of short periods of domination in M-363
O and only 2 long ones in Arc. This domination was longer than what has been found in other 364
coastal sites: on the Canadian East coast and in Plymouth Channel, the microbial food web 365
dominated for less than 20% of the year and only during summer (Rodriguez et al., 2000; Mousseau 366
et al., 2001). A herbivorous food web dominated in Canada for 50% of the year while it represented 367
only 15% (2 short phytoplankton blooms) in Plymouth Channel. In the latter, there was a 368
domination of the transition model i.e. the multivorous food web. In our study sites, the herbivorous 369
web persisted over longer periods in M-O (43% of the first seven months) while the transitional 370
multivorous web dominated in Arc (22% over the same period). The trophic systems of Arc, a 371
largely closed lagoon, appear to be more stable and less subject to trophic variations than the more 372
open M-O (Fig. 2; see also Fig. 4 in Soletchnik et al., (2007). In the latter, there was a succession of 373
microbial and herbivorous models without a systematic passage through the transitional 374
multivorous model. Moreover, the microbial food web was easier to distinguish from the other webs 375
than in Arc (Fig. S1). Consequently, the dominance of the microbial food web attests the 376
importance of microbial compartments in both ecosystems. 377
Another major difference between the bays is the contrasting trophic organization during winter: a 378
herbivorous food web in Arc and a microbial food web in M-O. The presence of winter blooms has 379
already been described in the Bay of Biscay (Labry et al., 2001; Marquis et al., 2007) and suggested 380
for the two basins through analyses of long-term data series (Soletchnik et al., 2007). These 381
phytoplankton blooms are influenced neither by temperature nor by nitrogen or phosphorus 382
availability but are probably due to silicate input combined with a potential for salinity stratification 383
or light availability. 384
The spring phytoplankton bloom occurred at the same period in both bays (April-May) yet it was 385
greater in Arc, where it consisted of large phytoplankton forms such as diatoms and picoplankton. 386
However, estimations of pelagic primary production illustrate a higher annual productivity in M-O 387
of 185 gC.m-2.yr-1 compared with 103 gC.m-2.yr-1 in Arc (Struski and Bacher, 2006; Glé et al., 388
2008). 389
390
Grazing and viriolysis control 391
Our results demonstrate that primary producers (small and large phytoplankton cells) and 392
autotrophy-based mechanisms (cf. PCA results) are important in Arcachon Bay (Arc). However, 393
Marennes Bay (M-O) is characterized by a higher potential for primary production, suggesting an 394
uncoupling between phytoplankton abundance and productivity. The difference in phytoplankton 395
abundance could be typically explained by (1) pelagic and benthic metazoan grazing, which is 396
relatively low in M-O (Sautour and Castel, 1998) compared to Arc; (2) flushing out, which is 397
relatively higher in M-O because it is quite an open system; (3) settling (Sautour and Castel, 1993); 398
(4) light limitation (Pomeroy and Deibel, 1986; Sautour and Castel, 1993) and trophic status (meso-399
eutrophic in M-O vs. mesotrophic in Arc). 400
In addition, we show that in M-O, phytoplankton could also be controlled by viruses; this is 401
corroborated by the simultaneous virus-bacteria uncoupling (Fig. 2). Viruses have been shown to 402
modify the taxonomic diversity of their host communities, i.e. prokaryotes (Thingstad and Lignell, 403
1997), and protists (Suttle, 2007) restraining the rapidly growing and succeeding species. Moreover, 404
these successions of active phage-host systems would maintain a relatively constant baseline of host 405
standing stocks (Wommack and Colwell, 2000). In addition, in M-O, virus infection could maintain 406
the phytoplankton standing stock baseline at a low level. Thus, viral production may rely on 407
autotroph lysis as well as bacterial lysogeny events. Moreover, the in vitro experiments show that, 408
in the presence of protist predators, the potential for viral lysis of the bacteria standing stock was 409
lower in M-O (2.6%) than in Arc (39%) during the phytoplankton bloom. Indeed, viral control of 410
phytoplankton was less clear in Arc and the link between bacteria and viruses was strong. Without 411
nanoflagellates, the release of large numbers of free viruses was in line with an increase in bacterial 412
mortality of up to 70% of the bacterial standing stock, as already suggested by the contrasting 413
dynamics of nanoflagellates and viruses during the in situ survey (Fig. 2; Table 2). In contrast, the 414
dynamics of nanoflagellates and viruses were similar in M-O, and during the spring bloom, virus-415
mediated bacterial mortality did not change significantly (9.4-13.6% with and without small 416
nanoflagellates, respectively). 417
Thus, the two trophic models that prevailed during the phytoplankton spring bloom are also 418
reflected in the interactions between the microbial compartments. The impact of nanoflagellates and 419
viruses on picoplankton differs in a multivorous web (Arc) compared to a herbivorous web (M-O). 420
The in vitro experiments carried out in Arc showed that the strong potential for viral bacteriolysis 421
(viral shunt: Wilhelm and Suttle, 1999) contributes to the development of picophytoeukaryotes 422
(picoeuk) due to an increased supply of organic and inorganic nutrients. The presence of 423
nanoflagellates, previously described as predators of picoeuk (Sherr and Sherr, 1994), appears to 424
counteract the indirect positive effect of viruses on the latter. Thus, the contrasting effect of viruses 425
and nanoflagellates on picoeuk can be defined as antagonist top-down control. 426
While the herbivorous web dominated in M-O, the antagonist impact could not be observed during 427
in vitro experiments because of the very low abundance of picoeuk in the sampling water. The 428
bacterioplankton were the only picoplankton compartment affected by viral enrichment in M-O: 429
through the viral shunt, the absence of picoeuk reduces the competition for nutrients and thus 430
increases the positive effect of viral enrichment on the growth of non-lysed bacteria. 431
In our study, nanoflagellate treatment in both bays did not affect bacterial abundance or growth, in 432
contrast to published data (Zhang et al., 2007). However, this does not necessarily mean that 433
predation by nanoflagellates had no effect. Indeed, flagellate grazing on picoeuk in Arc potentially 434
released particulate organic matter, provoking the observed increase of bacterial proteolysis. 435
Furthermore, with size-selective predation, the loss of bacteria through grazing is compensated by 436
the growth of predation-resistant cells, suggesting that nanoflagellates can affect the phenotypic 437
structure of bacterioplankton (Gonzalez et al., 1990; Monger and Landry, 1991; Simek et al., 1997; 438
Posch et al., 1999). Moreover, considering the BCC data, the morphological diversity of bacteria 439
and the mean biovolumes of bacterial sub-populations, there should be a preferential grazing of α-440
proteobacteria (small coccoid-shaped cells) by nanoflagellates compared to β-proteobacteria (large 441
bacillus-shaped cells). Beta dominate in freshwater but can also be found in coastal waters, without 442
a defined marine or riverine origin (Nold and Zwart, 1998). Indeed, they are present in both bays in 443
proportions equivalent to more specifically marine groups like Alpha during spring phytoplankton 444
blooms. More specifically, the hypothesis that Alpha are more vulnerable to grazing is confirmed in 445
M-O. Moreover, Beta are not as opportunistic as Gamma but nevertheless are metabolically very 446
reactive: the sensitivity of Alpha to grazing and to viral infection provides nutrients for Beta, which 447
are resistant, and this is highlighted by an increase of bacterial proteolysis. 448
However, Beta were as vulnerable to grazing as Alpha in Arc. A different clonal composition of 449
Beta could explain the variable response to predation pressure between the two bays (Brümmer et 450
al., 2003; Schwalbach et al., 2004). 451
The variable responses of bacterial groups to viral lysis in the present study confirm previous results 452
concerning BCC (Bouvier and Del Giorgio, 2007) and bacterial metabolism (Middelboe et al., 453
1996). Consequently, viral production can be modified according to the trophic period. During the 454
multivorous phase of the phytoplankton spring bloom in Arc, viral production was synergistically 455
depleted by the presence of flagellates and viral enrichment. The predation of picoeuk and bacteria 456
decreases the number of host cells and could lead to a general drop of lytic or lysogenic viral 457
production. Moreover, the acquisition of viral resistance, as observed with Alpha bacteria in virus-458
enriched incubation, would accentuate the negative impact on viral production. During the 459
herbivorous phase of the phytoplankton spring bloom in M-O, the response in terms of viral 460
production was the opposite. In the presence of flagellates, after virus enrichment, the development 461
of predation-resistant and virus-sensitive Beta, at the expense of Alpha, led to a positive synergistic 462
action of predators and viruses on viral production. This stimulation in the presence of flagellates 463
has already been described (in contrast to the inhibition found in Arcachon) and explained by 464
changes in BCC under grazing pressure (Simek et al., 2001; Weinbauer et al., 2003; Weinbauer et 465
al., 2007; Pradeep Ram and Sime-Ngando, 2008). Interestingly, our results also suggest that this 466
stimulation occurs during the herbivorous period. 467
Conclusion
468The temporal structure of trophic networks has been described in two bays on the French Atlantic 469
coast, providing major new elements for future studies, in particular for comparing microbiological 470
relationships during similar trophic periods. 471
Considering that trophic periods were defined in the same way for the two bays, the results of 472
picoplankton and viral production can be extrapolated in relation to how multivorous and 473
herbivorous trophic models work in general. Thus, during a multivorous period, viral lysis together 474
with flagellate grazing may reduce viral production and act antagonistically toward picoeukaryotes. 475
During a herbivorous period, flagellates and virus could both stimulate viral production. These 476
contrasting responses sustain the debate about potential shifts in viral production due to grazing: 477
positive or undetectable responses have already been found (Hornak et al., 2005; Weinbauer et al., 478
2007). For the first time, a negative effect of flagellate predation and viral lysis on viral production 479
has been described and linked to a trophic model, the multivorous food web. 480
481
Experimental procedures
482Study site and sampling strategy of in situ surveys 483
The study was carried out in two sites along the Bay of Biscay on the French Atlantic coast, 484
Arcachon Bay and Marennes Oleron Bay, which are 150 km apart. Both are shallow, soft-bottom 485
bays that are under strong tidal influence (Fig. S2). Arcachon Bay (44°40N, 1°10W) is a 180 km² 486
triangular shaped coastal lagoon that communicates with the Atlantic through a broad channel to the 487
south (Fig. S2). The Leyre River is the major source of freshwater for the lagoon (100 000 m3.y-1; 488
Glé et al., 2007) which has a meso- to macrotidal regime with amplitudes from 1.1m to 4.9m. It is 489
about 25 m deep at the entrance but the inside channels are shallow (5-10 m) , while about 70% of 490
3 weeks in the South East part of the bay. Marennes Oleron Bay to the North (46°00N, 1°10W) is 492
similar in size (175 km²) and depth (mean=8.6m; Stanisière et al., 2006), and intertidal mudflats 493
cover about 60% of its surface (Fig. S2). Freshwater arrives mainly from the Charente River, with 494
3x10⁹ m3.y-1, or 90% of the total freshwater input (DDE-Charente Maritime/HYDRO-MEDD/DE). 495
The bay is characterised by a macrotidal system, with amplitudes from 2 to 6m. It communicates 496
with the ocean through two passes, the Pertuis de Maumusson to the South and the Pertuis 497
d’Antioche to the North, with a relatively short residence time of 11 days. Tidal exchanges are 498
greater through the northern pass, resulting in a north-south circulation of oceanic (Bay of Biscay) 499
water (Struski, 2005). 500
Sampling was carried out twice weekly, from January to August 2005, at 2 stations in Arcachon 501
Bay: B13, near the mouth of the Bay, which is under oceanic influence, and Comprian, in the inner 502
basin, which is affected by the continental runoff. Five stations were surveyed in Marennes Oleron 503
Bay on a bi-monthly basis (January to December 2006). The stations were spread out over the entire 504
basin: one was close to the southern pass (A= Auger), two were above mudflats close to the 505
continent (Br=Brouage) and island (O= Oleron) coasts, one was close to the northern pass 506
(B=Boyard) and one near the mouth of the Charente River (C=Charente). 507
Water samples were collected in both bays near the surface (<1m) using Niskin bottles. Subsamples 508
were fixed on board. The rest were kept in 8L polypropylene dark bottles for laboratory analyses 509
(transfer time <3h). Physical parameters (temperature, salinity, pH) were recorded on board with 510
multiparameter probes (Seabird SBE25 in Arcachon and YSI 6600EDS-M in Marennes). 511
512
Batch culture design 513
Experimental water was collected at high tide at the surface from the central Comprian station in 514
Arcachon Bay on 17 May 2006 and from the northern “E” station in Marennes Bay (Fig. S2) on 24 515
April 2007. The experimental protocols were based on a slightly modified version of the method of 516
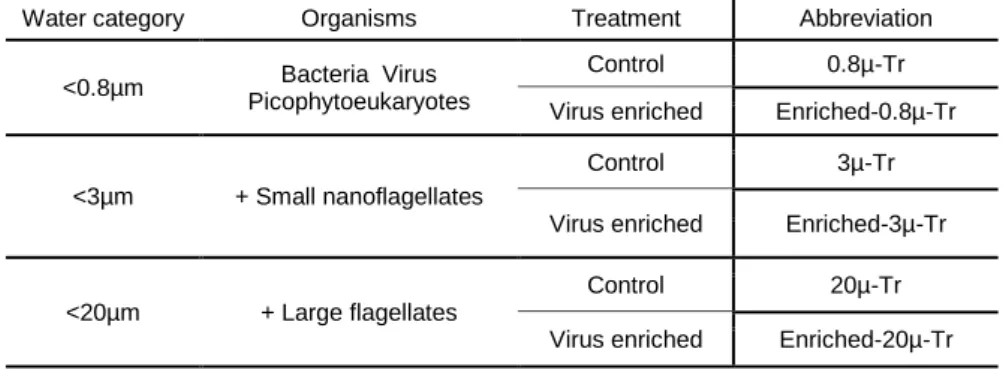
Auguet et al. (2009). In the lab, three water categories were obtained by sequential filtration from 517
75L of seawater: (1) <20µm, filtered through nylon membranes, (2) <3µm, filtered through 518
Versapor acrylic polymer membranes (Gelman Sciences Inc.) and (3) <0.8µm, filtered through 519
cellulose acetate membranes (Sartorius). Viral particles were then concentrated from 40L of <0.2-520
water, as a high molecular weight concentrate (HMWC) using a 30kDa polysulfone cartridge 521
(Sartorius). Viral-free water was kept for use as dilution water. Six different treatments were 522
prepared with the three water categories (Table 3), each diluted ten fold with the dilution water and 523
enriched (x2) or not with viruses (HMWC). 524
Each of the six treatments were triplicated in 2.4L Nalgene polycarbonate bottles filled with 2200 525
ml and incubated under in situ conditions of light and temperature in circulating seawater tanks. 526
Samples for bacterial, viral, phytoplankton and flagellate counts were collected at 0, 6, 12, 18, 24, 527
38 and 48h. Samples for bacterial activity and diversity were collected every 12h. Samples for 528
ciliate abundance were collected at the beginning and the end of the experiment (<20µm treatment). 529
530
Physical and chemical parameters 531
Seston was assessed by filtering 200 to 500 ml of water according to turbidity and processed 532
according to Auguet et al. (2005). Samples for dissolved inorganic nutrients (Silicate (Si), 533
Phosphate (PO4), Urea, Ammonium (NH4), Nitrite (NO2) and Nitrate (NO3)) were filtered (20ml,
534
Whatman GF/F) into glass flasks and stored at -20°C for analyses with an autoanalyser (Bran and 535
Luebbe, AA3 for Arcachon and Skalar for Marennes (Strickland and Parsons, 1972)). 536
537
Biological parameters 538
Chlorophyll a (chla) and pheopigment were analysed by filtering 200 ml of water through Whatman 539
GF/F filters (25 mm). Filters were stored for less than a month at -20°C before extraction (acetone 540
90% overnight at 4°C and shaken). Samples were analysed by the fluorimetry method (Turner, TD 541
700) according to Yentsch and Menzel (1963). 542
Subsamples (3ml) for viral and bacterial counts were fixed with 0.02-µm filtered formaldehyde (2% 543
final concentration) and stored for less than a week at 4°C. Samples were enumerated by 544
epifluorescence microscopy after staining for 30 min with Sybr Green I (Noble and Fuhrman, 1998). 545
Bacteria and viruses were counted in at least 15 fields chosen randomly under blue excitation (Zeiss 546
Axioskop 1000x). Using flow cytometry (FACSCalibur, Bekton Dickinson) and Sybr-GreenI 547
staining, bacteria cells were distinguished between High Nucleic Acid (HNA) and Low Nucleic 548
Acid (LNA) cells. Furthermore, for batch culture samples, HNA cells were clustered in 4 sub-549
groups (populations 3, 4, 5 and 6) according to decreasing biovolume (2, 0.8, 0.3 and 0.15 µm3, 550
respectively) and fluorescence. Small phytoplankton cells (<10µm; picoeukaryotes, nanoeukaryotes 551
and Synechococcus) were analysed using flow cytometry according to Joux et al. (2005). 552
Microphytoplankton (>10µm) and ciliate subsamples were fixed and stained in alkaline lugol (final 553
concentration, 1%). 10-20 ml subsamples were decanted in Utermöhl settling chambers before 554
counting and sizing by inverted microscopy (white light, Leica DMIRB, 400x – 630x). For ciliate 555
samples, the suspended matter of a 1L subsample was settled for 6h at in situ temperature before 556
siphoning off the top 850ml and fixing a 150ml aliquot of the siphoned water. Nanoflagellates 557
(60ml) were fixed with paraformaldehyde (final concentration 1%) and stored at 4°C for less than a 558
week. Cells filtered onto 0.8µm black polycarbonate membranes (Nucleopore) were stained with 559
DAPI (Porter and Feig, 1980) and counted under ultraviolet excitation (Zeiss Axioskop 1000x) with 560
a distinction between unpigmented (HNF) and pigmented (ANF) nanoflagellates based on the 561
absence of chlorophyll fluorescence under green excitation. At least 100 nanoflagellates were 562
counted for each slide. 563
Mesozooplankton were collected 1m below the surface in Arcachon Bay using a standard 200µm 564
WP-2 net towed slowly against the current. The catch was fixed in 5% seawater/formalin and 565
counted with a binocular loupe. 566
567 568
Bacterial growth, viral production and bacterial mortality 569
The maximum specific growth rate (h-1) of bacteria was calculated from log transformed abundance 570
data during the exponential growth phase in each bottle. Total viral production rate (h-1) was 571
calculated by adding the net increase of logarithmic viral abundance during each peak divided by 572
the incubation time. The bacterial mortality (cell.ml-1.h-1) induced by viral lysis was determined in 573
unenriched treatments from the viral production (sum of the net increase of viral abundance divided 574
by the duration of the experiment, particles.ml-1.h-1) divided by an assumed burst size of 50. The 575
percentage of bacterial cells lysed (d-1) was equivalent to the bacterial mortality rate (cell.ml-1.d-1) 576
divided by the total bacterial abundance. 577
578
Bacterial activity 579
Leucine aminopeptidase activity was measured in duplicate at T0, 12, 24, 36 and T48h by using L-580
Leucine-7-amino-4-methylcoumarin hydrochloride (Leu-MCA, Sigma) as a model protein substrate, 581
according to Hoppe (1993). The enzyme Vmax was determined by adding substrate to the sample, 582
giving a final saturating concentration of 1000µM. Incubations were performed in the dark and at in 583
situ temperature for around 5h, then stopped using Sodium-dodecyl sulfate (1% final concentration) 584
The release of 7-amino-4-methylcoumarin dye (MCA, Sigma) was measured with a 585
spectrofluorometer (Kontron, model SFM 25) at 380nm excitation and 440nm emission. Solutions 586
of MCA (20 to 2000nM) were used as a standard for calibration. The potential enzymatic activity 587
per cell was obtained by dividing Vmax by the corresponding bacterial abundance (specific Vmax, 588 fM.cell-1.h-1). 589 590 Bacterial diversity 591
Bacterial community composition was determined with fluorescent in situ hybridization using eight 592
Cy-3 labelled probes (MWG-Biotech): a mix of Eub 338 I,II and III for Eubacteria, Pla5a for 593
Planctomycetes, CF319a for Cytophaga-Flavobacterium cluster, Alf1b for α-proteobacteria, Bet43a 594
for β-proteobacteria, Gam42a for γ-proteobacteria, Arch915 for archaea and a non specific probe 595
as a control (Amann et al., 1995; Bouvier and Del Giorgio, 2007). 596
Samples were fixed in paraformaldehyde (2% final) and stored for at least 12h at 4°C before 597
freezing at -20°C. Bacteria were filtered onto 0.2µm polycarbonate membranes (Whatman), rinsed 598
with 0.2µm-filtered milli-Q water, dried and stored at -20°C. Pieces of membrane were hybridized 599
with 9µl of hybridization solution (Cy3-labelled probe, 2.5ng.µl-1) for 4h30 at 46°C and washed at 600
48°C for 15 mn. The membrane was then rinsed for a few seconds successively in 0.2µm-filtered 601
Milli-Q water then 80% ethanol and finally air dried. Bacterial cells were counter-stained with 602
DAPI mounting solution (0.25µg.µl-1 in (Citifluor (Biovalley)/Vectashield (Ablys, SA, Paris): 4/1). 603
At least 10 fields were counted on an epifluorescence microscope (Axioskop, Zeiss) using Cy3 604
(blue) and DAPI (UV) filters. 605
606
Identification of trophic dynamics 607
Trophic periods were defined empirically using the 4 conceptual trophic flux models of Legendre 608
and Rassoulzadegan (1995), primarily from the abundances of phytoplankton and bacteria but also 609
taking into account the dynamics of viruses, HNF and ciliates (Table 4). 610
The herbivorous food web is characterized by blooms of large (>10µm) phytoplankton cells. During 611
this period there is in general an increase in the number of ciliates. The microbial food web is 612
defined by an increase of small autotrophs (phytoplankton <10µm) and heterotrophs (bacteria). 613
Their potential predators (HNF and ciliates) may increase in number. The microbial loop, a closed 614
system maintained by nutrient regeneration, is characterized by high abundance of exclusively 615
heterotrophic micro-organisms (bacteria, HNF and ciliates). Finally, the multivorous food web is a 616
transitional model where all trophic pathways are actively contributing to the dynamics of the 617
ecosystem. 618
The trophic organization identified for each bay was then formalized using multivariate factorial 619
discriminant analysis (FDA). FDA classifies the samples using predefined criteria (i.e. the trophic 620
model) to discriminate samples according to independent variables (all abiotic and biotic 621
parameters). Prior to the FDA analysis, data were normalized and tested for heteroskedasticity 622
(Levene test, Ho: equal variances between criteria). The purpose was to test whether samples are 623
classified as predicted by the empirical trophic model and to assess the relative importance of the 624
independent variables in the classification. The significance of clustering is tested by a Wilks 625
Lambda test (low Lambda values corresponds to significant (p<0.05) clustering). 626
627
Statistical analysis 628
To compare field data between the 2 bays, the Arcachon results (3-day intervals) were regrouped by 629
sliding means to obtain 15-day time steps, as in Marennes Bay. Statistical analyses were performed 630
with log transformed data using XlStat (Addinsoft; version 7.5.2: one way- or two way-ANOVA, 631
simple regression, Principal Component Analysis (PCA) combined with Hierarchical Ascendant 632
Classification (HAC), Factorial Discriminant Analysis (FDA)) and Minitab (version 15: stepwise 633
multiple regressions and Levene test for Heteroskedasticity). 634
Acknowledgements
635This study was supported by the French Program PNEC-Littoral Atlantique. P.O.’s work was 636
supported by a PhD fellowship from the CNRS and the Région Poitou-Charente. The authors thank 637
the pilots of IFREMER-La Tremblade for the sampling logistics in Marennes Bay and Martine 638
Bréret and Pascal Lebleu for their helpful technical assistance. We also thank two anonymous 639
reviewers for their constructive criticism. 640
References
641Allard, J., Chaumillon, E., and Féniès, H. (2009) A synthesis of morphological evolutions and 642
Holocene stratigraphy of a wave-dominated estuary: The Arcachon lagoon, SW France. Continental 643
Shelf Research. 644
Amann, R.I., Ludwig, W., and Schleifer, K.-H. (1995) Phylogenetic identification and in situ 645
detection of individual microbial cells without cultivation. Microbiological Reviews 59: 143-169. 646
Auguet, J.C., Montanie, H., Delmas, D., Hartmann, H.J., and Huet, V. (2005) Dynamic of 647
virioplankton abundance and its environmental control in the Charente estuary (France). Microbial 648
Ecology 50: 337-349. 649
Auguet, J.C., Montanie, H., Hartmann, H.J., Lebaron, P., Casamayor, E.O., Catala, P., and Delmas, 650
D. (2009) Potential effect of freshwater virus on the structure and activity of bacterial communities 651
in the Marennes-Oléron Bay (France). Microbial Ecology 57: 295-306. 652
Azam, F., Fenchel, T., Field, J.G., Gray, J.S., Meyer-Reil, L.A., and Thingstad, T.F. (1983) The 653
ecological role of water-column microbes in the sea. Marine Ecology Progress Series 10: 257-263. 654
Baudoux, A.-C., Veldhuis, M.J.W., Noordeloos, A.A.M., van Noort, G., and Brussaard, C.P.D. 655
(2008) Estimates of virus- vs. grazing induced mortality of picophytoplankton in the North Sea 656
during summer. Aquat Microb Ecol 52: 69-82. 657
Blanchet, H., Lavesque, N., Ruellet, T., Dauvin, J.C., Sauriau, P.G., Desroy, N. et al. (2008) Use of 658
biotic indices in semi-enclosed coastal ecosystems and transitional waters habitats—Implications 659
for the implementation of the European Water Framework Directive. Ecological Indicators 8: 360-660
372. 661
Boehme, J., Frischer, M.E., Jiang, S.C., Kellogg, C.A., Pichrad, S., Rose, J.B. et al. (1993) Viruses, 662
bacterioplankton, and phytoplankton in the southeastern Gulf of mexico: distribution and 663
contribution to oceanic DNA pools. Marine ecology progress series 97: 1-10. 664
Boras, J.A., Sala, M.M., Vazquez-Dominguez, E., Weinbauer, M.G., and Vaqué, D. (2009) Annual 665
changes of bacterial mortality due to viruses and protists in an oligotrophic coastal environment 666
(NW Mediterranean). Environmental Microbiology 11: 1181-1193. 667
Borsheim, K.Y., Bratbak, G., and Heldal, M. (1990) Enumeration and biomass estimation of 668
planktonic bacteria and viruses by transmission electron microscopy. Applied and environmental 669
microbiology 56: 352-356. 670
Bouvier, T., and Del Giorgio, P.A. (2007) Key role of selective viral-induced mortality in 671
determining marine bacterial community composition. Environmental Microbiology 9: 287-297. 672
Brümmer, I.H.M., Felske, A., and Wagner-Döbler, I. (2003) Diversity and seasonal variability of 673
beta-proteobacteria in biofilms of polluted rivers: analysis by temperature gradient gel 674
electrophoresis and cloning. Applied and environmental microbiology 69: 4463-4473. 675
Calbet, A., and Saiz, E. (2005) The ciliate-copepod link in marine ecosystems. Aquatic Microbial 676
Ecology 38: 157-167. 677
Chen, B., Liu, H., and Wang, Z. (2009) Trophic interactions within the microbial food web in the 678
South China Sea revealed by size-fractionation method. Journal of Experimental Marine Biology 679
and Ecology 368: 59-66. 680
Cottrell, M.T., and Suttle, C.A. (1995) Dynamics of a lytic virus infecting the photosynthetic 681
marine picoflagellate Micromonas pusilla. Limnology and Oceanography 40: 730-739. 682
Fuhrman, J.A. (1999) Marine viruses and their biogeochemical and ecological effects. Nature 399: 683
541-548. 684
Fuhrman, J.A. (2009) Microbial community structure and its functional implications. Nature 459: 685
193-199. 686
Garza, D.R., and Suttle, C.A. (1995) Large double-stranded DNA viruses which cause the lysis of a 687
marine heterotrophic nanoflagellate (Bodo sp.) occur in natural marine viral communities. Aquatic 688
Microbial Ecology 9: 203-210. 689
Gasol, J.M., Pedros-Alio, C., and Vaque, D. (2002) Regulation of bacterial assemblages in 690
oligotrophic plankton systems: results from experimental and empirical approaches. Antonie Van 691
Leeuwenhoek 81: 435-452. 692
Glé, C., Del Amo, Y., Sautour, B., Laborde, P., and Chardy, P. (2008) Variability of nutrients and 693
phytoplankton primary production in a shallow macrotidal coastal ecosystem (Arcachon Bay, 694
France). Estuarine, Coastal and Shelf Science 76: 642-656. 695
Glé, C., Del Amo, Y., Bec, B., Sautour, B., Froidefond, J.-M., Gohin, F. et al. (2007) Typology of 696
environmental conditions at the onset of winter phytoplankton blooms in a shallow macrotidal 697
coastal ecosystem, Arcachon Bay (France). Journal of Plankton Ressearch 29: 999-1014. 698
Gonzalez, J.M., Sherr, E.B., and Sherr, B.F. (1990) Size-selective grazing on bacteria by natural 699
assemblages of estuarine flagellates and ciliates. Applied and environmental microbiology 56: 583-700
589. 701
Guarini, J.-M., Gros, P., Blanchard, G.F., Richard, P., and Fillon, A. (2004) Benthic contribution to 702
pelagic microalgal communities in two semi-enclosed, European-type littoral ecosystems 703
(Marennes-Oléron Bay and Aiguillon Bay, France). Journal of Sea Research 52: 241-258. 704
Guarini, J.-M., Blanchard, G.F., Bacher, C., Gros, P., Riera, P., Richard, P. et al. (1998) Dynamics 705
of spatial patterns of microphytobenthic biomass: inferences from a geostatistical analysis of two 706
comprehensive surveys in Marennes-Oléron Bay (France). Marine Ecology Progress Series 166: 707
131-141. 708
Guixa-Boixereu, N., Vaqué, D., Gasol, J.M., and Pedros-Alio, C. (1999) Distribution of viruses and 709
their potential effect on bacterioplankton in an oligotrophic marine system. Aquat Microb Ecol 19: 710
205-213. 711
Hahn, M.W., and Hofle, M.G. (2001) Grazing of protozoa and its effect on populations of aquatic 712
bacteria. FEMS Microbiology Ecology 35: 113-121. 713
Hennes, K., P., and Suttle, C.A. (1995) Direct counts of viruses in natural waters and laboratory 714
cultures by epifluorescence microscopy. Limnology and Oceanography 40. 715
Hirose, M., Katano, T., and Nakano, S.-I. (2008) Growth and grazing mortality rates of 716
Prochlorococcus, Synechococcus and eukaryotic picophytoplankton in the bay of the Uwa Sea, 717
Japan. Journal of Plankton Research 30: 241-250. 718
Hoppe, H.G. (1993) Use of fluorogenic model substrates for extracellular enzyme activity (EEA) of 719
bacteria. In Handbook of methods in Aquatic Microbial Ecology. Kemp, P.F., Sherr, B.F., Sherr, 720
E.B., and Cole, J.J. (eds). Boca Raton, FL: Lewis Publishers, pp. 423-431. 721
Hornak, K., Masin, M., Jezbera, J., Bettarel, Y., Nedoma, J., Sime-Ngando, T., and Simek, K. (2005) 722
Effects of decreased resource availability, protozoan grazing and viral impact on the structure of 723
bacterioplankton assemblage in a canyon-shaped reservoir. FEMS Microbiology Ecology 52: 315-724
327. 725
Joux, F., Servais, P., Naudin, J.-J., Lebaron, P., Oriol, L., and Courties, C. (2005) Distribution of 726
picophytoplankton and bacterioplankton along a river plume gradient in the Mediterranean Sea. Vie 727
et Milieu 55: 197-208. 728
Kirchman, D.L., Meon, B., Cottrell, M.T., Hutchins, D.A., Weeks, D., and Bruland, K.W. (2000) 729
Carbon versus iron limitation of bacterial growth in the California upwelling regime. Limnol 730
Oceanogr 45: 1681-1688. 731
Labry, C., Herbland, A., Delmas, D., Laborde, P., Lazure, P., Froidefond, J.-M. et al. (2001) 732
Initiation of winter phytoplankton blooms within the Gironde plume waters in the Bay of Biscay. 733
Marine Ecology Progress Series 212: 117-130. 734
Legendre, L., and Rassoulzadegan, F. (1995) Plankton and nutrient dynamics in marine waters. 735
Ophelia 41: 153-172. 736
Li, W.K.W. (1998) Annual average abundance of heterotrophic bacteria and Synechococcus in 737


![[PDF] Formation Complet Merise Pdf](data:image/gif;base64,R0lGODlhAQABAIAAAP///wAAACH5BAEAAAAALAAAAAABAAEAAAICRAEAOw==)