HAL Id: hal-00089735
https://hal-insu.archives-ouvertes.fr/hal-00089735
Submitted on 28 Aug 2006
HAL is a multi-disciplinary open access archive for the deposit and dissemination of sci-entific research documents, whether they are pub-lished or not. The documents may come from teaching and research institutions in France or abroad, or from public or private research centers.
L’archive ouverte pluridisciplinaire HAL, est destinée au dépôt et à la diffusion de documents scientifiques de niveau recherche, publiés ou non, émanant des établissements d’enseignement et de recherche français ou étrangers, des laboratoires publics ou privés.
Accuracy of PIXE analyses using a funny filter
Sophie Gama, Marcel Volfinger, Claire Ramboz, Olivier Rouer
To cite this version:
Sophie Gama, Marcel Volfinger, Claire Ramboz, Olivier Rouer. Accuracy of PIXE analyses using a funny filter. Nuclear Instruments and Methods in Physics Research Section B: Beam Interactions with Materials and Atoms, Elsevier, 2001, B181, pp.150-156. �10.1016/S0168-583X(01)00350-0�. �hal-00089735�
Accuracy of PIXE analyses using a funny filter
Sophie Gama, Marcel Volfinger, Claire Ramboz and Olivier Rouer
Institut des Sciences de la Terre d'Orléans (ISTO), CNRS/Université d'Orléans, 1A, rue de la Férollerie, 45071 Orléans Cédex 2, France
Abstract
Light and heavy trace elements can be analysed simultaneously by particle-induced X-ray emission (PIXE) using an Al-funny filter (a filter with a hole drilled at its centre, placed in front of the detector window). The treatment of spectra, performed using the GUPIX code, requires the determination of an instrumental constant H. In theory and when using ordinary filters, H is a constant corresponding to the detection solid angle. In contrast, we have observed that H varies with X-ray energy using a funny filter. This is due to an inaccurate description of the geometry of the detection: detector-to-target distance, filter thicknesses and hole diameter of the funny filter. We develop a methodology to determine the effective values of the four geometrical parameters from a calibration of H using standards. In turn, H recalculated using these effective values is a constant equivalent to the effective detection solid angle.
Author Keywords: PIXE analysis; Funny filter; GUPIX software; Accuracy PACS classification codes: 82.80; 81.05; 91.65; 91.65.N
1. Introduction
In order to characterize the geochemical anomalies related to Late Hercynian hydrothermal processes in the La Châtaigneraie mining district (Cantal, France [1]), we have performed both electron probe micro-analyses (EPMA) (at BRGM-CNRS-University, Orléans) and particle-induced X-ray emission (PIXE) analyses (at CERI-CNRS, Orléans and LPS-CEA, Saclay) of major and trace elements ranging from P to U in selected ores and alteration minerals from this W-rich district. A multi-element application of the PIXE method was therefore developed. In particular, an Al-filter with a tiny hole drilled at its centre (funny filter) was systematically placed in front of the X-ray detector, as this procedure allows both the lighter (15 Z 25) and heavier elements (Z 25) to be analysed simultaneously. The specific problems encountered in the calibration of the PIXE method using funny filters are exposed and discussed below. We present the results of an extensive investigation of the calibration procedure using funny filters, with various standards and under variable geometrical conditions of detection. The GUPIX code [2] is used for spectra treatment.
2. Experimental set-up
The proton miniprobe at the CERI-CNRS laboratory focuses a 3 MeV proton beam (beam spot size of about 30×60 μm2) to a target placed under vacuum (from 5×10⁻⁵ to 10−6 mbar). A detailed description has been reported previously by Zine et al. [3] and by Azahra [4]. The intensity of the proton beam, varying from 200 pA to 1 nA, is measured using a chopper calibrated relative to a Faraday cup. The relative uncertainty of charge integration is around 5%. For the analysis of samples containing heavy elements, the intensity is reduced to 200 pA in order to avoid high counting rates (<800 pulses per s) which degrade X-ray peak shapes. The X-ray Si(Li) detector (Oxford Instruments) is characterized by a 30 mm2 nominal surface area, a 3 mm nominal Si-crystal thickness and a 7.5 μm-thick Be window. Its energy resolution at 5.9 keV is 148 eV. A 135 μm-thick Be-filter is placed in front of the detector to prevent interactions with scattered protons. Al-funny filters, with thicknesses ranging from 100 to 300 μm, are superimposed on the Be-filter in order to attenuate the characteristic X-rays from major elements, which would disturb the electronic detection, increase pulse pile-up on the spectra and obliterate X-rays of trace elements. A mirror, placed in front of the target, reflects the image of the beam impact on the target to an endoscope which magnifies at 200×. Standards are polished and coated with a thin carbon layer in order to ensure conductivity.
3. General principles and methodology
The PIXE method allows the trace element content Cz in a thick target to be determined from
the measured characteristic X-ray intensity Im(Z,M), using the formula
Im(Z,M)=Yt(Z,M)QCzΩT(Z) ,
where the theoretical yield, Yt(Z,M), and the transmission, T(Z), are computed from the database. The parameters Q, Ω and are measured. In order to derive concentrations from peak intensities, the GUPIX software [2] uses a fitting routine based upon the non-linear least-squares method developed by Marquardt, followed by an iterated linear least-least-squares procedure. To solve Eq. (1), the code uses a database containing the energies and relative intensities of the K and L X-rays for all elements up to 38 keV. In the program approach [5],
the detector solid angle Ω is substituted by an instrumental parameter H, which is determined by analysis of well-defined standards.
H≈Ω=S/d2.
H theoretically corresponds to Ω but, in practice, it is an energy-dependent parameter due to
uncertainties of the database, the charge calibration and modelization of the Si(Li) detector and filters. The constancy of H, using different filters (Al, Be, …), was frequently verified ([4, 5, 6, 7, 8 and 9] and Fig. 1). As mentioned by Czamanske et al. [11], many minerals and glasses with certified major element composition are available but they are not well characterized for minor and trace elements. Several authors [11, 12 and 13] used the NIST-610 glass as a standard for PIXE analysis, which contains over 60 elements present at nominal abundances of about 500 ppm. However the PIXE spectrum of this glass has a lot of overlapping peaks and requires a very long acquisition time. Nejedly and Campbell [9] have recently proposed the use of alloy standards containing Mo in minor quantity and Fe or Ni as a major element for calibration. These Fe–Ni alloys also allow a proper determination of the foil thickness. As for geoscientists, they commonly calibrate the PIXE method using a few standards containing major elements, for lack of appropriate minor or trace element-bearing standards [11].
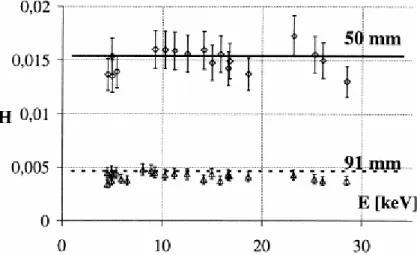
Fig. 1. Experimental H-values for Kα and Kβ X-ray lines of elements analysed in standards with an Al100 filter
placed in front of the Si(Li) detector and for two target-to-detector distances (50 and 91 mm). For each d-value,
H-measurements approximate the detection solid angle Ω (straight line). Analyses were performed at 3.2 MeV
using the nuclear microprobe from the LPS-CEA laboratory at Saclay [10] (beam size: 30×30 μm2).
4. The funny filter problem
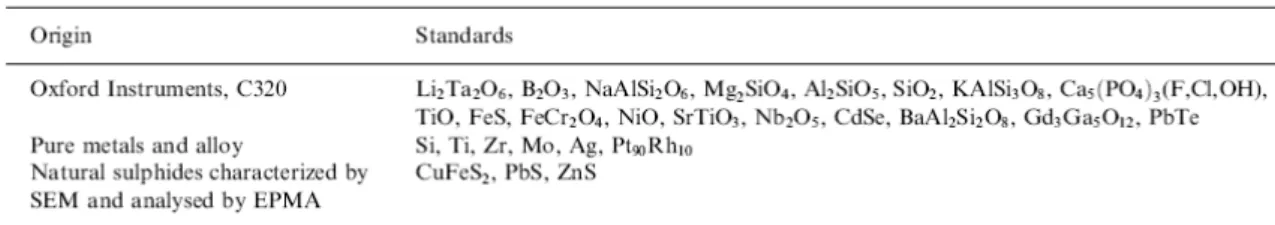
For our multi-element trace analyses, we have always used Al-funny filters (φ=0.5 mm) of various thicknesses (100–300 μm), with the detector located at a nominal distance of about 31 mm from the target. We have systematically observed that H-values drastically vary with X-ray energies between 2 and 8–10 keV. H-values become more or less constant above 8–10 keV, but remain significantly different from the nominal Ω-value. The magnitude of the departure is too large to be explained by database imperfections or an improper characterization of the absorbers (chemistry, texture, thickness, etc.) or of the detector efficiency [8, 9 and 12]. These unconventional H-variations observed are therefore inherent to the use of funny filters. In order to understand why H-values vary with energy when using a funny filter, we have undertaken systematic measurements of H using standards calibrated for
major elements (Fig. 2): metallic samples like pure metals, alloys and sulphides, and also insulating matrices like oxides, silicates, sulphates and others (a list of the chemistry and origin of all standards is given in Table 1).
Fig. 2. (a)–(c) H-values, calculated from experimental spectra, for Kα and Kβ X-ray lines of elements analysed in
standards. Nominal experimental conditions are d=31 mm, tBe=135 μm and φ=0.5 mm. tAl is 100, 200 and 300
μm ((a), (b) and (c), respectively). Every superimposed curve is calculated with one single set of adjusted geometrical parameters (numbers between brackets: di in mm, (tBe)i and (tAl)i in μm, φi in mm). (d). H-values
calculated for L X-ray lines with superimposed curves simulated for K X-ray lines. The error bars, around 6%, take into account the relative uncertainties on the collected charge and on the peak fit.
5. Simulations of H experimental values: principle and
results
Let d, tBe, tAl and φ be the nominal geometrical parameters of the detection, i.e., the parameters measured at the beginning of the calibration procedure. Following Eq. (1), H could be expressed
Thus, H depends on the nominal distance d, see (2), and the filter transmission T(Z). The latter is a function of tBe, tAl and φ, as follows:
Probably, the H-variation observed results from inaccurate measurement of d and inaccurate estimation of the parameters tA1, tBe and φ controlling the transmission T(Z). Only an inaccuracy of transmission parameters can account for the observed variation of H with energy (see below). Following Eq. (3), H is calculated from the measured peak area Im(Z,M) and the nominal parameters entered into the program by the user
Im(Z,M)=Yt(Z,M)QCz HTnominal.
We shall assume that there exists one set of realistic geometrical parameters [di, (tAl)i, (tBe)i
and φi] that allows to reproduce measured peak areas for the whole investigated energy range.
Ii(Z,M)=Yt(Z,M)QCz ΩiTi,
with
Ii(Z,M)=Im(Z,M).
It follows that
H=(S/di2)(Ti/Tnominal).
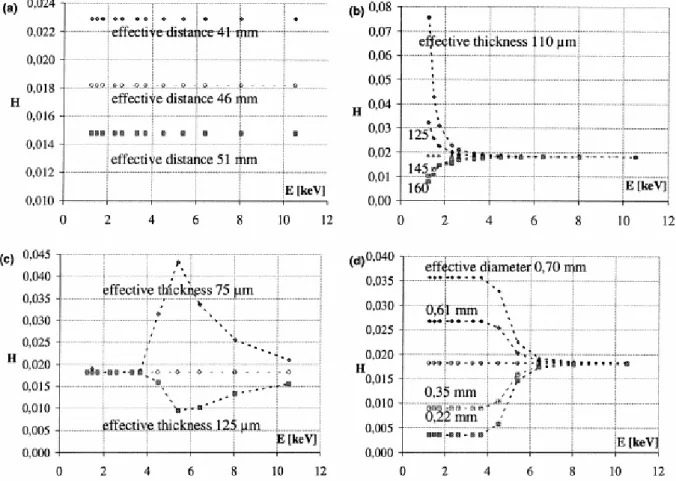
Firstly, we have simulated the effect on calculated H-values of the inaccuracy of each geometrical parameter (d, tBe, tAl and φ) separately. Fig. 3 shows that (a) a decrease in parameter d significantly increases H to a constant value, whatever the energy; (b) in contrast, decreasing tBe significantly increases H only for the lower energy range (the Be-filter does not absorb X-photons above 3 keV); (c) a decrease in tAl affects H-values only for intermediate energies between 4 and 8 keV; (d) increasing φ results in higher constant H-values below 4 keV, but does not affect H above 6 keV. Each parameter contributes to vary H in different energy ranges, so we were able to adjust a unique set of parameters (di, (tAl)i, (tBe)i and φi) that
allows the H-values to be modelled between 2 and 40 keV (Fig. 2). These adjusted parameters are regarded as effective values that allow accurate trace concentration to be calculated.
Maybe these parameters are biased by other inaccuracies that have not been considered. For instance, tBe could compensate for an inaccuracy of the detector Be-window thickness.
Fig. 3. Simulated effects on calculated H-values (squares and diamonds) of incorrect geometrical parameters: (a) detector-to-target distance d for a Si(Li) detector with a 38.5 mm2 surface area, (b) Be-filter thickness, (c)
Al-filter thickness and (d) funny Al-filter hole diameter. The true transmission-controlling parameters, which yield constant H values (circles), are tBe=135 μm, tAl=100 μm and φ=0.5 mm.
6. Discussion
Each of the four effective geometrical parameters was adjusted from experimental H-values by a “trial-and-error” method, separately. A more rigorous mathematical approach would also calculate the accuracy of each effective parameter. We here discuss about the physical significance of the four adjusted parameters. (a) Firstly, the underestimation by about 30% of
d shown by our experiments may seem surprising. However, it is very difficult to estimate the
accurate position of the Si crystal behind the Be window: the latter distance was measured at 1 cm in an older similar detector from the CERI laboratory. The crystal/Be-window distance could be measured accurately using an X-ray source of known intensity, placing the detector at different distances. Also, the surface of the crystal should be measured accurately using a calibrated X-ray source. (b) As for the Be-foil thickness, the adjusted value of 170 or 190 μm is consistent with that of 170 μm deduced by Choi [6] by the Kα/Kβ method [14]. However, it is quite different from the value of 135 μm measured by optical and scanning-electron microscopy. An inaccurate estimation of the dead layer of the detector crystal could explain this difference. (c) The simulation shows that the thicknesses of the Al100 and Al200 funny filters are overestimated by 5 μm whereas that of the Al300 filter is overestimated by 30 μm.
Note that aluminium manufactured by rolling can exhibit some variations in its thickness. Also, Nejedly and Campbell [9] found that nominal thicknesses of Al350 and Al500 ordinary filters were underestimated by around 10 μm. (d) The holes drilled mechanically in Al-filters are oval under the microscope and show imperfect rims. This could explain the inaccuracy found for all nominal φ-values. Maybe more sophisticated drilling methods, like laser ablation, could allow a better control of the hole geometry.
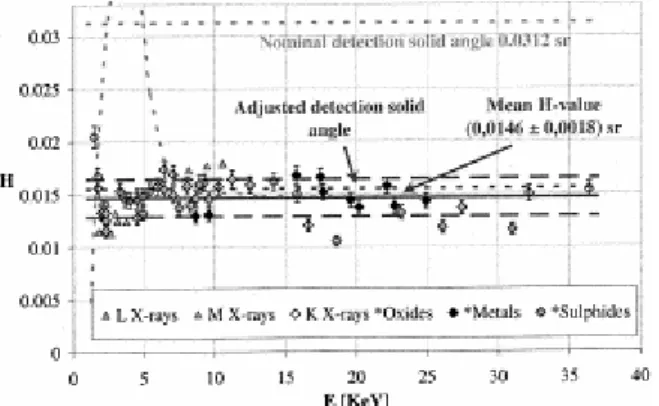
One strong argument showing that the four adjusted parameters best approximate the true parameters is as follows: for three distinct calibrations (Fig. 2) performed at a nominal distance of 31 mm and using the same Be-filter with a nominal thickness of 135 μm, d and tBe have been adjusted to 44 mm and 170 μm, respectively. Moreover, the diameters of three holes drilled in the same way in aluminium foils have been adjusted to similar effective values. Lastly, on entering the adjusted geometrical values into the GUPIX program, a single constantH-value is calculated for the whole energy range with a precision of 10% (σ). Additionally, the calculated H is nearly equal to the effective detection solid angle Ωi: for
instance, a mean H-value of 0.0146±0.0018 sr is calculated with the Al100 funny filter calibrated at 95 μm, consistent with the Ωi-value of 0.0156 sr deduced from di=44 mm (Fig.
4). The standard deviation on H of 0.0018 sr can then be propagated into trace element calculations.
Fig. 4. Values of the H-parameter calculated with the adjusted values of the four geometrical parameters using the GUPIX program. The lighter dashed lines and the heavy lines plus the datapoints correspond to the H-values calculated with the nominal parameters (d=31 mm; tBe=135 μm; tAl=100 μm; φ=0.5 mm) and the adjusted
parameters (di=44 mm; (tBe)i=170 μm; (tAl)i=95 μm; φi=0.84 mm), respectively.
7. Conclusions
In this paper, we have shown that, in order to properly apply the PIXE method using a funny filter, a very precise characterization of the analytical system geometry is required. When the geometrical parameters entered into the GUPIX code are inaccurate, then the instrumental constant H loses its primary physical significance of the detection solid angle. This confirms that the H-value method proposed by the GUPIX program, despite its simplicity, can yield erroneous concentrations, especially when using funny filters.
Ideally speaking, correct PIXE analyses at least require funny filters with a certified geometry, a detector that is well characterized and placed at an accurate distance from the target. Under such conditions, the PIXE method is absolute and requires no calibration. In practice, we show that effective geometrical parameters can be adjusted from H-calibration. These effective values only approximate the true system geometry, since they certainly
integrate some imperfections of the GUPIX database and of the detector description. However, they allow to calculate, with a precision of around 10%, a constant H which is internally consistent with the adjusted detection solid angle.
Acknowledgements
We are very grateful to the scientific team of the CERI-CNRS laboratory who has provided us with an easy access to the probe and an efficient technical assistance during the experiments. Also, J.P. Gallien, L. Daudin and H. Khojda are acknowledged for careful assistance on the nuclear microprobe of the LPS-CEA laboratory and for their critical comments of the results. We are indebted to L. Peilleron at ISTO-CNRS who made the filters and participated in the construction of the analytical chamber and its optical device. We also would like to thank J.L. Campbell from Guelph University, T. Sauvage and G. Blondiaux from CERI-CNRS for fruitful discussions and, finally, two anonymous reviewers who significantly contributed to better the manuscript.
References
1. S. Gama, C. Ramboz and M. Volfinger. Terra Abstracts 11 (1999), p. 477.
2. J.A. Maxwell, W.J. Teesdale and J.L. Campbell. Nucl. Instr. and Meth. B 95 (1995), p. 407. 3. D. Zine, D.B. Isabelle and G. Rémond. Nucl. Instr. and Meth. B 49 (1990), p. 446.
4. M. Azahra, Thesis, University of Clermont-Ferrand II, 1993.
5. J.L. Campbell, D. Higuchi, J.A. Maxwell and W.J. Teesdale. Nucl. Instr. and Meth. B 77 (1993), p. 95.
6. C.G. Choi, Thesis, University of Orléans, 1995.
7. L.J. Cabri, J.L. Campbell, J.H.G. Leflamme, R.G. Leigh, J.A. Maxwell and J.D. Scott. Can.
Mineral. 23 (1985), p. 133.
8. J.L. Campbell, G.K. Czamanske, L. MacDonald and W.J. Teesdale. Nucl. Instr. and Meth.
B 130 (1997), p. 608.
9. Z. Nejedly and J.L. Campbell. Nucl. Instr. and Meth. B 160 (2000), p. 415. 10. C. Engelmann and G. Revel. Nucl. Instr. and Meth. B 54 (1991), p. 84.
11. G.K. Czamanske, T.W. Sisson, J.L. Campbell and W.J. Teesdale. Am. Mineral. 78 (1993), p. 893.
12. G. Rémond, C. Gilles, D. Isabelle, C.G. Choi, M. Azahra, O. Rouer and F. Cesbron. Appl.
13. P.S.Z. Rogers, C.J. Duffy and T.M. Benjamin. Nucl. Instr. and Meth. B 22 (1987), p. 133. 14. C.G. Ryan, D.R. Cousens, C.A. Heinrich, W.L. Griffin, S.H. Sie and T.P. Mernagh. Nucl.