HAL Id: hal-00296550
https://hal.archives-ouvertes.fr/hal-00296550
Submitted on 20 May 2008
HAL is a multi-disciplinary open access
archive for the deposit and dissemination of
sci-entific research documents, whether they are
pub-lished or not. The documents may come from
teaching and research institutions in France or
abroad, or from public or private research centers.
L’archive ouverte pluridisciplinaire HAL, est
destinée au dépôt et à la diffusion de documents
scientifiques de niveau recherche, publiés ou non,
émanant des établissements d’enseignement et de
recherche français ou étrangers, des laboratoires
publics ou privés.
J.-M. Ryoo, D. W. Waugh, A. Gettelman
To cite this version:
J.-M. Ryoo, D. W. Waugh, A. Gettelman. Variability of subtropical upper tropospheric humidity.
Atmospheric Chemistry and Physics, European Geosciences Union, 2008, 8 (10), pp.2643-2655.
�hal-00296550�
Atmos. Chem. Phys., 8, 2643–2655, 2008 www.atmos-chem-phys.net/8/2643/2008/ © Author(s) 2008. This work is distributed under the Creative Commons Attribution 3.0 License.
Atmospheric
Chemistry
and Physics
Variability of subtropical upper tropospheric humidity
J.-M. Ryoo1, D. W. Waugh1, and A. Gettelman2
1Department of Earth and Planetary Science, Johns Hopkins University, Baltimore, MD, USA 2National Center for Atmospheric Research, Boulder, CO, USA
Received: 13 November 2007 – Published in Atmos. Chem. Phys. Discuss.: 22 January 2008 Revised: 7 May 2008 – Accepted: 7 May 2008 – Published: 20 May 2008
Abstract. Analysis of Atmospheric Infrared Sounder (AIRS) measurements for five years shows significant lon-gitudinal variations in the winter subtropical upper tropo-spheric relative humidity (RH), not only in the climatological mean values but also in the local distributions and tempo-ral variability. The largest climatological mean values occur over the central-eastern Pacific and Atlantic oceans, where there is also large day-to-day variability. In contrast, there are smaller mean values, and smaller variability that occurs at lower frequency, over the Indian and western Pacific oceans. These differences in the distribution and variability of sub-tropical RH are related to differences in the key transport processes in the different sectors. The large variability and intermittent high and low RH over the central-eastern Pa-cific and Atlantic oceans are due to intrusions of high poten-tial vorticity air into the subtropics. Intrusions seldom occur over the eastern Indian and western Pacific oceans, and here the subtropical RH is more closely linked to the location and strength of subtropical anticyclones. During northern winter there are eastward propagating features in the subtropical RH in this region that are out of phase with the tropical RH, and are caused by modulation of the subtropical anticyclones by the Madden-Julian Oscillation.
1 Introduction
Water vapor is the dominant greenhouse gas in Earth’s at-mosphere, and understanding its distribution and variability is essential for understanding the present and future climate. The radiative effect of water vapor is logarithmic in the wa-ter vapor concentration, and small changes in regions with low amounts of water vapor can have a large influence on climate (e.g. Spencer and Braswell, 1997; Held and Soden,
Correspondence to: D. W. Waugh
2000; Pierrehumbert et al., 2007). As a result it is of particu-lar importance to know the water vapor distribution in the dry regions in the tropics and subtropics, as well as the physical processes controlling this distribution.
Satellite measurements over the last two decades have greatly improved our knowledge of the distribution and vari-ability of tropospheric humidity (e.g. Rind et al., 1993; Soden and Bretherton, 1993; Bates et al., 1996; Read et al., 2001; Gettelman et al., 2006). These measurements have also en-abled examination of the processes causing variability in the water vapor distribution. For example, several studies have shown a strong link between intraseasonal variations in trop-ical upper tropospheric humidity and the Madden Julian Os-cillation (MJO) (e.g. Mote et al., 2000; Sassi et al., 2002; Eguchi and Shiotani, 2004; Tian et al., 2006). Also, the dis-tribution and synoptic variability in upper tropospheric hu-midity in the summer subtropics has been linked to the deep convection and transport associated with summer monsoons (e.g. Randel and Park, 2006; Gettelman et al., 2006). An-other process linked to variability in the subtropical humidity field is Rossby wave breaking along the tropopause (Waugh, 2005).
Here we examine further the variability of subtropical hu-midity during winter. We focus on the winter subtropics as these are the regions of lowest relative humidities (e.g. Fig. 2 of Gettelman et al., 2006). The analysis performed extends that of Waugh (2005) by considering a longer data record, variability in the middle and upper troposphere, and the im-pact of subtropical anticyclones and the MJO as well as Rossby wave breaking. For this study we use data from At-mospheric Infrared Sounder (AIRS) instrument on the NASA Aqua satellite (Aumann et al., 2003; Fetzer et al., 2003), which provides measurements of high vertical and horizontal resolution and daily global coverage for over five years. This dataset enables spatial and temporal variations in UTH to be examined (e.g. Gettelman et al., 2006). The majority of the analysis examines the northern subtropics during winter, but we also briefly consider the southern subtropics in winter.
The data used are described in the next section. In Sect. 3 the spatial and temporal variations in the RH distributions during Northern Hemisphere winter are examined. These variations are then related to transport processes in Sect. 4. The variability and transport during Southern Hemisphere winter is briefly discussed in Sect. 5. Concluding remarks are given in the final section.
2 Data and methods
The UTH data use here is AIRS level-2 data retrievals (ver-sion 4) which have been binned into a 1◦ by 1◦ latitude-longitude grid as in Gettelman et al. (2006). The level 2 data include temperature and water vapor at vertical resolution around 1–2 km and horizontal resolution of around 50 km. See Gettelman et al. (2006) for details of the data screening, calculation of relative humidity (RH), and formation of the gridded data.
Several studies have compared AIRS water vapor with bal-loon and in situ aircraft measurements (e.g. Divakarla et al., 2006; Tobin et al., 2006; Hagan et al., 2004; Gettelman et al., 2004). These have shown that AIRS retrievals capture the spatial variability in the aircraft in situ measurements of upper tropospheric humidity, and mixing ratios agree within 25% or better (e.g. Hagan et al., 2004; Gettelman et al., 2004).
AIRS data are archived on 28 levels from the surface to the mesosphere. The AIRS water vapor is an average for a layer between two pressure levels. Following the AIRS convention each layer is referenced by the pressure at the bottom of the layer, e.g. water vapor and RH at 250 hPa corresponds to the layer from 250 to 200 hPa (which has midpoint at 225 hPa). We examine here AIRS RH for the 2002/2003 to 2005/2006 Northern Hemisphere (NH) winters (December, January, and February). We focus primarily on the 250 hPa layer but also consider the RH distributions in other layers.
Several different meteorological products are also used in our analysis. Horizontal winds and potential vortic-ity (PV) calculated from National Center for Environmen-tal Prediction-National Center for Atmospheric Research (NCEP-NCAR) reanalysis data (Kalnay et al., 1996) are used to examine the horizontal flow and disturbances to the sub-tropical tropopause. These data are archived on a 2.5◦ lati-tude by 2.5◦ longitude grid. We focus on flow in the upper troposphere, and analyze horizontal velocities on the 200 hPa pressure surface and PV on the 350 K isentropic surface. (In the tropics and subtropics the 200 hPa pressure surface and 350 K isentropic surface occur at approximately the same height.)
Outgoing longwave radiation (OLR) is used as a sim-ple proxy of the deep convection. The OLR data used are the NOAA spatially and temporally interpolated OLR (Liebmann and Smith, 1996), obtained from the NOAA-Cooperative Institute for Research in Environmental
Sci-ences (CIRES) Climate Diagnostics Center (CDC; informa-tion available online at http://www.cdc.noaa.gov/). These data are stored on the same grid as the NCEP-NCAR reana-lyzes.
We also compare the RH fields with the Madden-Julian Oscillation (MJO). For this analysis we use MJO indices obtained from the NOAA Climate Prediction Center (CPC) (http://www.cpc.noaa.gov). These indices are computed by applying an Extended Empirical Orthogonal Function (EEOF) analysis to the 200 hPa velocity potential. The first EEOF consists of ten time-lagged patterns (each pattern sep-arated by 5 days), and ten MJO indices are formed by re-gressing daily data on to these patterns. Each index is asso-ciated with the phase when the equatorial velocity potential anomalies have propagated to a particular longitude.
3 Water vapor distribution
3.1 Climatological distribution
We first consider the climatological northern winter (December–February) RH distributions. We focus on the dis-tributions in the northern subtropics, but also consider, for comparison, the tropical distribution. As has been reported in many previous studies (e.g. Rind et al., 1993; Bates et al., 1996; Read et al., 2001; Gettelman et al., 2006), the climato-logical mean RH in the subtropical upper troposphere is gen-erally drier than in the tropics, see Fig. 1a. However, in both the tropics (5◦S–5◦N) and subtropics (15◦N–25◦N) there are significant zonal variations. In the tropics there is high RH in the convective regions (e.g., Indonesian region, trop-ical Africa, and troptrop-ical America) but there are also regions with low RH (in particular, the eastern tropical Pacific). In the subtropics there are local maxima over the eastern Pa-cific and eastern Atlantic oceans and minima over the Indian, central Pacific, and tropical America.
The above horizontal variations in RH occur throughout the middle and upper troposphere, see Fig. 1c, e. At all pres-sures between 600 and 150 hPa the largest tropical RH occurs in the Indonesian region (around 100◦E) and tropical Amer-ica (60◦W), and largest subtropical RH in the eastern Pacific (around 120◦W) and Atlantic (0◦E). The magnitude, how-ever, varies with altitude. In both the tropics and subtropics the lowest RH is found in the middle troposphere, around 500 hPa.
We now consider the variability about these climatolog-ical mean values. Figure 1b shows the standard deviation of the daily 250 hPa RH (σRH) for northern winter. As
with the climatological mean value, there are large spa-tial variations in σRH. However, in contrast to the
clima-tological mean values, the largest σRH occur in the
sub-tropical regions. These maxima occur east of longitudes where the climatological PV contours reach furthest south. (The contours in Fig. 1a are PV=1.5 and 2.5 PVU contours
J.-M. Ryoo et al.: Subtropical upper tropospheric humidity 2645
Fig. 1. Climatological DJF distributions of RH. Maps of (a) mean and (b) standard deviation at 250 hPa. Vertical cross sections of (c) mean
and (d) standard deviation for average over 15.5◦N to 25.5◦N, and (e) mean and (f) standard deviation for average over 5.5◦S to 5.5◦N. The white curves are PV=±1.5 and 2.5 PVU contours and black curves are OLR=240 W/m2contours in (a) and OLR=70 W/m2contours in (b).
(1 PVU=10−6m2K kg−1s−1), and are shown to illustrate the approximate location of the dynamical tropopause.) The smallest σRHare in the eastern tropical Pacific, where there
are also very low mean values. Similar horizontal variations in σRHare found through the middle and upper troposphere,
see Fig. 1d, f.
In both the tropics and subtropics the highest (lowest) vari-ability occurs in regions with high (low) mean values. As a result the vertical cross sections of the mean and standard de-viation shown in Fig. 1c–f have very similar spatial structure. 3.2 Probability density functions
As OLR has a logarithmic dependence on the water vapor distribution it is important to know not just the mean and standard deviation of RH but also the full distribution. We
now briefly examine the probability distribution functions (PDFs) of RH in different regions. We focus on distribu-tions on 250 hPa RH, but similar variadistribu-tions are found for other middle and upper troposphere levels.
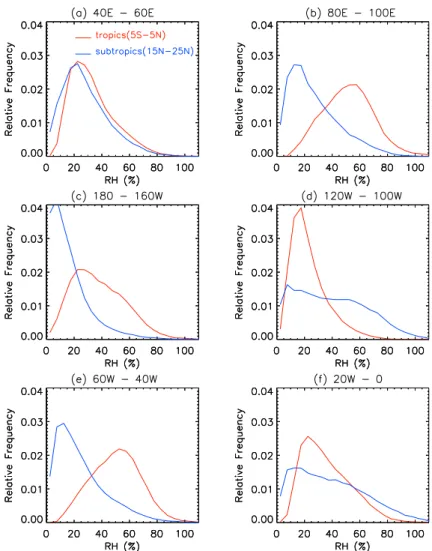
Figure 2 compares tropical (5◦S–5◦N) and subtropical (15◦N–20◦N) PDFs for several different longitudes. In all regions the PDFs are very broad, but the characteristics of PDFs, including the location of the peak value and shape (skewness), varies between regions. As expected from the above analysis of the mean and standard deviation, the char-acteristics of the PDFs vary both with longitude and between the tropics and subtropics.
The characteristics of the PDFs can be divided into three broad categories, with differing contrasts between tropical and subtropical PDFs. In the first category, which occurs
Fig. 2. PDFs of 250 hPa RH for (a) 40◦E–60◦E, (b) 80◦E–100◦E, (c) 180◦W–160◦W, (d) 120◦W–100◦W, (e) 60◦W–40◦W, and (f) 20◦W–0◦W. Tropical regions (5.5◦S–5.5◦N) are shown in red, and subtropical regions (15.5◦N–25.5◦N) in blue. These PDFs are illustra-tive of the PDFs in the wider regions discussed in the text.
over the Indian ocean and western Pacific (80◦E to 180◦E) and over the Atlantic ocean (80◦to 20◦W), the tropical PDFs have a narrow peak at high RH (≈60%) with little air with low RH (<20%), whereas the subtropical PDFs have a nar-row peak at low RH (<20%) with there is little air with high RH (>60%). Examples, for PDFs of 10◦latitude by 20◦ lon-gitude regions are shown in Fig. 2b, and e. In the second cat-egory, which occur in the eastern Pacific (140◦–80◦W) and the eastern Atlantic (20◦W–0◦E), the tropical and
subtropi-cal PDFs are also different. However, now the tropisubtropi-cal PDF have a peak at low RH (<30%) and the subtropical PDFs are very broad with significant amounts of low and high RH (see, e.g., Fig. 2d and f). The third category occurs over the Indian ocean (0◦–60◦E) where, in contrast the above regions, the tropical and subtropical PDFs are similar, with peaks at intermediate RH (e.g., Fig. 2a).
The PDFs for all 10◦ latitude by 20◦ longitude regions shown in Fig. 2 are unimodal, even if the tropical and sub-tropical PDFs for the same longitude have peaks at very dif-ferent values of RH. This applies for other regions of simi-lar size, and also for the whole tropical region 30◦S–30◦N. This appears to contradict the analysis of Zhang et al. (2003) which showed that PDFs of tropical water vapor are often bi-modal. However, PDFs of AIRS data for lower altitudes can be bimodal (not shown).
The PDFs discussed above have been formed from gridded data, in which individual measurements are averaged within 1◦by 1◦regions. This has the potential to impact the PDFs, e.g. averaging could remove extreme values. However, very similar PDFs are obtained if the individual AIRS measure-ments are used rather than the 1◦by 1◦averages (not shown).
J.-M. Ryoo et al.: Subtropical upper tropospheric humidity 2647
Fig. 3. Longitude-time variations of (a) tropical (5.5◦S–5.5◦N) and (b) subtropical (15.5◦N–25.5◦N) RH at 250 hPa, for two NH winters (December to March; 2002/2003 and 2003/2004). Contours in (b) show PV=1.5 PVU contours.
3.3 Daily variability
To examine the time scales of the variability discussed above we examine the time series of daily data. Figure 3 shows Hovmoller plots of 250 hPa RH averaged over 5◦S–
5◦N (Fig. 3a) and 15◦–25◦N (Fig. 3b) for 2 NH winters
(2002/2003 and 2003/2004). Very similar features are ob-served in the other winters analyzed. The longitudinal vari-ations described in the previous subsections can be clearly seen in these plots, e.g., there is generally high tropical RH around 0◦E, 120◦E and 60◦W and high subtropical RH around 120◦W and 0◦E. Also, the temporal variability is larger in the subtropics, with maximum variability occurring at the same longitudes as maximum mean values.
The time scale of variability also differs between regions: In some regions there is large day-to-day (synoptic) variabil-ity, while in others the variability appears at lower
frequen-cies (week-month). In the subtropical eastern Pacific (around 120◦W) and Atlantic (around 0◦E) there is large day-to-day variability, with rapid transitions between dry and moist air (RH varies from greater than 80% to less than 20% within a few days). These locations with large daily variability are those regions with largest σRH(Fig. 1) and broad PDFs
(Fig. 2). There is much less day-to-day variability in the trop-ics, with a tendency for more lower frequency variations.
The most prominent low frequency variations are between 60◦E to 180◦E where there are eastward propagating fea-tures with periods around 2 months. These feafea-tures occur in both the tropics and subtropics. The tropical and subtropical features move at a similar speed, but are out of phase (e.g., when the RH is high in the tropics it is low in the subtrop-ics) and shifted in longitude, with the low subtropical values appear around 30◦east of the high tropical values.
Fig. 4. Maps of 250 hPa RH (shading), 200 hPa winds (vectors), 350 K PV (white contours), and OLR (black contours) for (a) 30 December
2002, (b) 9 January 2003, (c) 18 February 2003, and (d) 4 March 2003. White curves are PV=1.5 and 2.5 PVU contours and black curves are OLR=240 W/m2contours.
Closer examination of Fig. 3 indicates there is also a con-nection between the temporal variability in the tropics and subtropics in the eastern Pacific (around 100◦W). Here, very low values in tropics appear to be associated with the low subtropical values, which occur to the west and 1 to 2 days earlier.
Figure 3 shows 250 hPa RH, but very similar features are also observed at lower altitudes (down to around 600 hPa), and the daily and lower frequency variability is vertically co-herent (e.g., see Fig. 7 of Gettelman et al. 2006).
4 Transport processes
The spatial variations in RH discussed above suggest that different processes are involved in controlling the humidity distribution. The variations of tropical RH are largely deter-mined by the locations of convection, with high RH in these regions and low RH in the non-convective regions (e.g., com-pare OLR and RH in Fig. 1a). However, there is not such a simple relationship in the subtropics where isentropic trans-port can play an imtrans-portant role. In this section we investi-gate the transport processes that influence subtropical RH by comparing the AIRS RH data with several different meteo-rological quantities.
4.1 Potential vorticity intrusions
Figure 1b shows that the largest variability in tropical-subtropical RH occurs near the tropopause, especially in re-gions where the mean PV contours are furtherest south. This suggests that variability in the PV contours (and dynamical tropopause) is a major cause of the variability in subtropical RH.
One cause of variability in the tropopause is Rossby wave propagation and breaking, which can lead to intrusions of air with high PV into the tropical UT. Waugh (2005) showed that there is low RH within and west of the “intrusions” of high PV, and high RH east of the intrusions. Examples of these intrusions and their impact on RH can be seen in Fig. 4a and b, which show maps of 250 hPa RH for days when there are tongues of high PV in the subtropics over the eastern Pa-cific and the Atlantic (Fig. 4a, b) and over the Indian ocean (Fig. 4b).
Here, we extend the analysis of Waugh (2005) by consider-ing variability at all longitudes and usconsider-ing a longer AIRS data record. The connection between PV intrusions and subtropi-cal UTH can be seen in Fig. 3b where PV=1.5 PVU contours are overlaid on the RH field. Intermittent regions of high PV in Fig. 3b correspond to PV intrusions, e.g., the intru-sions in Fig. 4a, b can be seen as PV contours in Fig. 3b. PV intrusions are common over the eastern Pacific and Atlantic oceans in Fig. 3b, consistent with the analysis of Waugh and
J.-M. Ryoo et al.: Subtropical upper tropospheric humidity 2649
Fig. 5. Vertical cross sections of composite RH for intrusions in
northern subtropical (a) Pacific, (b) Atlantic, and (c) Indian oceans. Relative longitude is the longitude relative to central longitude of the PV intrusions.
Polvani (2000). Regions of high PV also occur over the In-dian ocean region (around 60◦E), but are less frequent and weaker (maximum PV is smaller).
To further investigate the connection between PV intru-sions and RH a composite analysis is performed. PV in-trusion events are identified in the same manner as Waugh (2005): All days where PV≥2.5 PVU at 17.5◦N were
iden-tified, and all occurrences within 10◦ longitude and within
6 days were grouped together as a single intrusion event. The longitude of the maximum PV for each event is defined as the central longitude. Using this criteria there were 174 events in the central-eastern Pacific (170◦E–90◦W), 172 events in the Atlantic (80◦W–0◦E), and 16 events over the Indian Ocean – western Pacific (50◦E–130◦E).
Figure 5a and b shows relative-longitude versus height cross section of composite-mean RH for all intrusions in the eastern Pacific (170◦E–90◦W) and Atlantic (80◦W–0◦E) oceans, respectively. (The relative longitude is the
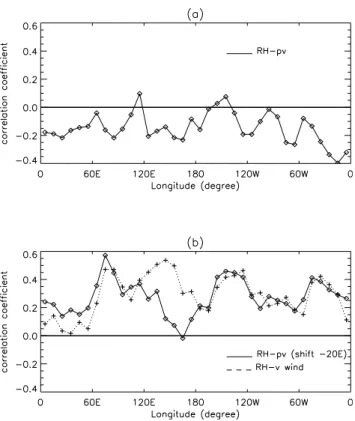
longi-Fig. 6. Longitudinal variations of temporal correlations between
RH and (a) co-located PV and (b) PV shifted to the west by 20◦ (solid) and co-located v (dashed). All fields are averages between 15◦N and 20◦N.
tude relative to the central longitude of each event.) There is a similar mean RH structure for intrusions in both regions, with high RH east of the PV intrusions and low RH west and within the intrusions. Even though the high PV is con-fined to the upper troposphere (not shown), these regions of high/low RH are vertically coherent, and there is high RH down to below 400 hPa. Similar structure is found for in-trusions in the Indian ocean – western Pacific ocean region, although the RH ahead of the intrusions is lower than the mean for the eastern Pacific and Atlantic events, and there is weaker vertical penetration, see Fig. 5c. This is consis-tent with weaker PV intrusions, reduced vertical ascent and weaker convection. The spatial structures shown in these in-trusion composites are similar to those in the climatological mean RH at the mean locations of the intrusions (see Fig. 1), although the magnitude of the variations is larger in the in-trusion composites.
Another way to quantify the relationships between changes in PV and those in RH is to calculate temporal cor-relations. Figure 6a shows the longitudinal variation in the temporal correlation between subtropical RH and PV. In gen-eral there is a negative correlation, indicating that when PV is higher there is lower RH. This is consistent with high PV indicating dry air of stratospheric origin. However, the corre-lations are low and variations of PV do not explain much of
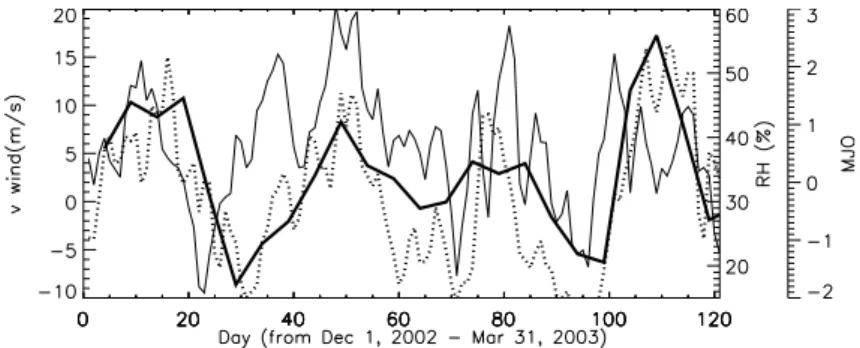
Fig. 7. Time series of subtropical (15.5◦N–25.5◦N) RH (thin solid) and v (thin dashed) averaged between 120◦E and 140◦E, and of value of average between MJO indices at 120◦E and 140◦E (thick solid) for the 2002/2003 winter.
the variability in RH. There are two factors that contribute to these low correlations. First, low RH is found not only within the high PV tongues but also west of these tongues. Second, the highest RH occurs east of high PV tongues. Because of the second factor we also consider the correlation between RH at a given longitude and PV 20◦west of this longitude. As shown in Fig. 6b, this correlation is generally positive, and there are large correlations in regions where intrusions occur (around 70◦E, 140◦W, and 40◦W). Outside these
re-gions the correlation is low, indicating that RH fluctuations are not linked with PV fluctuations in these regions. (The low correlation in these regions could also be due the larger impact of measurement noise in these low humidity regions.) As discussed above the mechanism for high RH ahead of PV intrusions is a combination of convection and poleward advection (both induced by the intrusion, see Kiladis, 1998 and Funatsu and Waugh, 2008). To examine the connection with meridional velocity, v, we also show in Fig. 6b the lon-gitudinal variation of the temporal correlation of co-located subtropical RH and v. The correlations are generally sim-ilar to that between RH and PV shifted west by 20◦, with high correlations in the same three regions where intrusions frequently occur. This adds support to the hypothesis that the intermittent high values of subtropical RH in the Indian, eastern Pacific, and Atlantic oceans are strongly coupled to the occurrence of PV intrusions.
4.2 Subtropical anticyclones and Madden-Julian Oscillation
It is notable in Fig. 6b that there are high correlations be-tween RH and v in the western Pacific (120–150◦E), where there is little correlation between RH and PV (either co-located or shifted in longitude). This correlation between RH and v can be also seen in Fig. 7, which shows the time series of subtropical RH and v in the western Pacific for the 2002/2003 winter. Intrusions seldom occur in this region, and another process must be responsible for variations in the meridional flow and subtropical RH.
One possible process is advection by subtropical anticy-clones. In the upper troposphere there are anticyclones in the subtropics slightly west of the equatorial convection (e.g. Sassi et al., 2002). There is northward flow on the west-ern edge of the subtropical anticyclone, and southward flow on the eastern edge. The northward flow rapidly transports moist air from the equatorial convective region into the sub-tropics, and generally increases the subtropical humidity. In contrast, southward or weak meridional flow brings drier air down from the subtropical jet. Hence when there are strong northward velocities the RH increases whereas when there are weak or southward flow the RH generally decreases. The two cases are illustrated in Fig. 4c and d, which show days when there is high and low subtropical RH at 120◦E, respec-tively. The region of strong equatorial convection in Fig. 4d is further west than in Fig. 4c, and as a result there is a shift in the high/low RH in the subtropics. There is a strong north-ward flow around 120◦E on the first day, but a much weaker meridional flow in the second day.
As discussed above, there is significant low frequency (1– 2 month) variability in the RH in the Indian and western Pa-cific oceans (see Fig. 3). This can also be seen in the RH and v time series in Fig. 7. Examination of maps such as those shown in Fig. 4 suggest that changes in the meridional velocities associated with subtropical anticyclones is a major cause of variability of subtropical RH in the western Pacific. One possible cause of this low frequency variability is the MJO. The MJO is a major feature of intraseasonal variability in the equatorial troposphere with a periodicity of about two months (e.g. Madden and Julian, 1994). The MJO is charac-terized by eastward movement of regions of enhanced or sup-pressed tropical rainfall, which generally originate over the Indian Ocean and propagate into the central Pacific Ocean.
Several previous studies, using AIRS and UARS MLS wa-ter vapor data, have shown a strong link between intrasea-sonal variations in upper tropospheric humidity and the MJO (e.g. Mote et al., 2000; Sassi et al., 2002; Eguchi and Sh-iotani, 2004; Tian et al., 2006). However, these studies have generally focused on variations in the equatorial humidity, and not intraseasonal variations in subtropical humidity.
J.-M. Ryoo et al.: Subtropical upper tropospheric humidity 2651
Fig. 8. Maps of RH (shading), OLR (contours), and wind (vectors) anomalies for composite for MJO indices at (a) 80◦E, (b) 140◦E, and
(c) 40◦W. Black contours are negative OLR anomalies of −5 W/m2and red contours are positive OLR anomalies of 10 W/m2.
To explore the MJO-related variations in RH we use the CPC MJO indices described in Sect. 2. The temporal vari-ation of the average of MJO indices centered at 120◦E and 140◦E is shown in Fig. 7. A negative index corresponds to a time with enhanced rainfall and a positive index to reduced rainfall. The average values of RH and v between 120◦E and 140◦E are also shown in Fig. 7. When the MJO index is pos-itive (reduced tropical rainfall) there is generally northward v and higher RH in the subtropics, and the reverse for negative MJO index. Hence, the MJO appears to explain much of the low frequency variations in the subtropical RH and v.
We examine the MJO-related variations in RH in more de-tail by performing a composite analysis based on the MJO indices. For each of the ten indices we calculate composites of RH, and other fields, by averaging all days when the value of the MJO index <−1. This identifies the days when there is enhanced rainfall at the given index location. To isolate the
low-frequency component a 30–80 day Lanczos filter (e.g. Duchon, 1979) is applied to all data used in the composite analysis.
Figure 8 shows the composite RH (as well as OLR and horizontal wind) anomalies for several different MJO in-dices. Coherent variations in tropical OLR and RH anoma-lies can be seen in these plots. When the negative OLR anomalies are centered at 80◦E (Index 1; Fig. 8a) there are positive RH anomalies in the same region, i.e. increased RH associated with increased convection. The negative OLR and positive RH equatorial anomalies remain co-located and move east as the phase of the MJO moves east, e.g., Fig. 8b. In the MJO phase with enhanced convection at 40◦W (Fig. 8c) there is reduced equatorial convection over
the Indian – western Pacific region and the equatorial OLR and RH anomalies are of the opposite sign to that for the MJO index at 80◦E (Fig. 8a).
Fig. 9. (a) Longitude-time variations of subtropical (15.5◦S–25.5◦S) RH at 250 hPa, for two SH winters (June to August; 2003 and 2004). Contours show PV=1.5 PVU contours. (b,c) Vertical cross sections of composite RH for intrusions in southern subtropical (b) Pacific, and
(c) Atlantic oceans. Relative longitude is the longitude relative to central longitude of the PV intrusions.
As well as the tropical RH anomalies there are also north-ern subtropical RH anomalies at the same longitude. How-ever these anomalies are of the opposite sign to the tropi-cal RH, and extend further to the east. These subtropitropi-cal RH anomalies also move to east with the MJO. These MJO-related variations in subtropical RH occur because the MJO influences not only tropical rainfall/convection but also in-fluences the atmospheric circulation in the tropics and sub-tropics (e.g. Sassi et al., 2002). In particular, the upper tro-pospheric subtropical anticyclones associated with enhanced tropical convection move eastward with the MJO. As a result the meridional flow and subtropical RH changes with phase
of the MJO. The out of phase relationship between tropical and subtropical RH at the same longitude is because the sub-tropical anticyclones are slightly west of the sub-tropical convec-tion, and there is weak or southward meridional flow, and hence reduced subtropical RH, at similar longitude to the en-hanced convection.
There are also MJO anomalies in the subtropical east-ern Pacific. When there are negative OLR anomalies (en-hanced convection) at 80◦E there are positive RH anomalies not only at this location but also in the subtropics around 130◦W (Fig. 8a). Similarly, when there are positive OLR anomalies (reduced convection) at 80◦E there are negative
J.-M. Ryoo et al.: Subtropical upper tropospheric humidity 2653 RH anomalies in the subtropics at 130◦W (Fig. 8c). These
eastern Pacific anomalies were noted by Sassi et al. (2002) in their analysis of UARS MLS data, and were attributed to residuals from previous cycles of the MJO. However, an al-ternative explanation is modulation of PV intrusions by the MJO. During the phase of MJO with enhanced convection over the east Indian Ocean the subtropical jet is weaker and equatorial westerlies stronger over the Pacific (Matthews and Kiladis, 1999; Sassi et al., 2002), which are favorable condi-tions for Rossby wave breaking in the eastern Pacific (Waugh and Polvani, 2000). Thus during this phase there could be more intrusions and increased RH in the subtropical eastern Pacific, and the reverse for the opposite phase.
5 Southern subtropics
The above analysis has considered only the northern subtrop-ics during winter. We now briefly examine the distribution and variability of RH in the southern subtropics (15◦–25◦S) during winter (June to August).
The distribution and variability of tropospheric humidity in the southern subtropics during winter is qualitatively the same as that shown above for the northern subtropics during winter. In particular there are low values of RH except in two localized regions that have higher mean values and variabil-ity of RH, e.g., see Fig. 9a. As in the northern subtropics the regions with higher means and variability are regions where PV intrusions frequently occur (contours in Fig. 9a). How-ever, the intrusions in the southern subtropics are less coher-ent in space than in the Northern Hemisphere and occur in slightly different regions, e.g., over South America (around 60◦W). Also, the intrusions in the southern subtropics are less frequent and weaker than in the northern subtropics (e.g., the area of PV=1.5 PVU contours are smaller than in Fig. 3b). As a result there is lower mean RH and lower variability in the southern subtropics.
The variation in RH relative to the PV intrusions is quali-tatively similar to intrusions in the northern subtropics, e.g., Fig. 9b shows composite-mean RH fields for southern intru-sions. The RH east of the intrusions is, however, much lower then for the northern intrusions (compare with Fig. 3). This is consistent with the weaker magnitude of PV in the southern intrusions.
As discussed above, there is low frequency variability in RH over the subtropical northern Indian and western Pacific Oceans during winter, that is linked to the eastward move-ment of subtropical anticyclones. There is much less vari-ability in the southern winter (JJA) subtropics in these lon-gitudes. The slow eastward propagating features observed in the RH over the northern subtropical Indian and western Pacific oceans (Fig. 3b) are not seen in the southern win-ter subtropics (Fig. 9a), and eastward propagating tropical RH and OLR are also mostly absent during southern winter (not shown). This lack of strong eastward propagating
fea-tures during southern winter is consistent with the MJO be-ing weaker durbe-ing southern summer than northern summer (Salby and Hendon, 1994).
6 Conclusions
The above analysis of AIRS measurements has shown that there are significant longitudinal variations in subtropical RH during winter. These variations occur not only in the clima-tological mean values but also in local distributions and in the time scales of the variability. For example, in the north-ern winter subtropics there are local maxima over the eastnorth-ern Pacific and eastern Atlantic oceans, with maxima in the daily variability and breadth of the PDFs in the same regions. Also, in the subtropical eastern Pacific and Atlantic oceans there is large day-to-day (synoptic) variability, with rapid transitions between dry and moist air (RH varies from greater than 70% to less than 20% within a few days). There is smaller vari-ability, which occurs at lower frequency, in the subtropical Indian and western Pacific oceans.
These differences in the distribution and variability of sub-tropical RH are related to the different transport processes that dominate in the different sectors. Comparison with PV shows that the intermittent high and low values of RH over the Eastern Pacific and Atlantic oceans (and to a smaller ex-tent over the Indian ocean) are due to intrusions of high PV air into the subtropics. There is very dry air west and within these intrusions and moist air east of the intrusions. PV in-trusions seldom occur over the eastern Indian and western Pacific oceans, and here the subtropical RH is more closely linked to the location and strength of subtropical anticy-clones. In these regions there are eastward propagating fea-tures in the northern winter subtropical RH that are out of phase with the tropical RH, and are caused by modulation of the subtropical anticyclones by the MJO.
There are several aspects of the analysis presented here that could be examined further. One aspect is the distribu-tion and variability of RH in the summer subtropics. Rossby wave breaking occurs more frequently during the summer than the winter (Postel and Hitchman, 1999), and would be expected to have some impact on subtropical RH. However, previous studies have shown that summer monsoons play a major role in determining the distribution and synoptic vari-ability in upper tropospheric humidity in the summer sub-tropics (e.g. Randel and Park, 2006; Gettelman et al., 2006), and it is not clear that PV intrusions play as an important role in the summer as the winter. Further analysis is required to determine the relative role of different processes in the sum-mer subtropics.
Another area that deserves further examination is the char-acteristics of PDFs for different regions. The analysis pre-sented here shows some significant differences in the PDFs for different regions, but also suggests that they may be fit by a universal form. One possibility is the theoretical
distribution law derived by Sherwood et al. (2006), which might enable the differences in PDFs to be related to differ-ences in time scales of processes controlling the RH distribu-tions.
Comparison of the results presented here with analysis of other measurements of upper tropospheric humidity would allow the robustness of the results to be assessed. Several recent studies have compared upper tropospheric RH mea-surements from different satellite and/or aircraft instruments. These include Read et al. (2007) who compared AIRS RH with those from the new Microwave Limb Sounder (MLS) instrument on the Aura satellite, and Ekstrom et al. (2007) who compared satellite measurements from the UARS-MLS, Aura-MLS, and Odin-SMR. However, these studies did not examine in detail the spatial and temporal variability of the humidity.
It would also be of interest to examine trajectory-based water vapor simulations in the different regions. Previous studies have shown that these simulations do a good job of re-producing UTH observations (e.g. Pierrehumbert and Roca, 1998; Dessler and Sherwood, 2000; Waugh, 2005). Detailed analysis of these calculations for different longitudes will en-able the role of different processes to be examined and quan-tified.
Yet another extension of this analysis would be compar-isons of the observed variability with that in climate mod-els. Gettelman et al. (2006) compared water vapor from the CAM3 climate model with the AIRS climatology. It would be interesting to extend this to other climate models, and also to include a comparison with dynamical processes. The anal-ysis here suggests that a correct simulation of the subtropi-cal UTH distribution requires models to correctly simulate Rossby wave dynamics along the tropopause and the MJO. Acknowledgements. The NOAA spatially and temporally inter-polated OLR were obtained from the NOAA-CIRES Climate Diagnostics Center (http://www.cdc.noaa.gov/). This work was supported by grants from NASA and NSF. The National Center for Atmospheric Research is sponsored by the National Science Foundation.
Edited by: T. R¨ockmann
References
Aumann, H. H., Chahine, M. T., Gautier, C., et al.: AIRS/AMSU/HSB on the Aqua Mission: Design, science objec-tives and data products, IEEE T. Geosci. Remote, 41, 253–264, 2003.
Bates, J. J., Wu, X., and Jackson, D. L.: Interannual variability of upper-troposphere water vapor band brightness temperature, J. Climate, 9, 427–438, 1996.
Dessler, A. and Sherwood, S. C.: Simulations of tropical upper tro-pospheric humidity, J. Geophys. Res., 105, 20 155–20 163, 2000. Duchon, C. E.: Lanczos filtering in one and two dimensions, J.
Appl. Meteorol., 18, 1016–1022, 1979.
Divakarla, M. G., Barnet, C. D., Goldberg, M. D., et al.: Validation of AIRS temperature and water vapor retrievals with matched radiosonde observations and forecasts, J. Geophys. Res., 111, D09S15, doi:10.1029/2005JD006116, 2006.
Eguchi, N. and Shiotani, M.: Intraseasonal variations of water vapor and cirrus clouds in the tropical upper troposphere, J. Geophys. Res., 109, D12106, doi:10.1029/2003JD004314, 2004.
Ekstrom, M., Eriksson, P., Rydberg, B., and Murtagh, D. P.: First Odin sub-mm retrievals in the tropical upper troposphere: hu-midity and cloud ice signals, Atmos. Chem. Phys., 7, 459–469, 2007,
http://www.atmos-chem-phys.net/7/459/2007/.
Fetzer, E., McMillin, L. M., Tobin, D., et al.: AIRS/AMSU/HSB validation, IEEE T. Geosci. Remote, 41, 418–431, 2003. Funatsu, B. M. and Waugh, D. W.: Connections between
Poten-tial Vorticity Intrusions and Convection in the Eastern Tropical Pacific, J. Atmos. Sci., 65, 987–1002, 2008
Gettelman, A., Weinstock, E. M., Fetzer E. J., et al.: Validation of Aqua satellite data in the upper troposphere and lower strato-sphere with in situ aircraft instruments, Geophys. Res. Lett., 31, L22107, doi:10.1029/2004GL020730, 2004.
Gettelman, A., Collins, W. D., Fetzer, E. J., Eldering, A., Irion, F. W., Duffy, P. B., and Bala, G.: Climatology of Upper-Tropospheric Relative Humidity from the Atmospheric Infrared Sounder and Implications for Climate, J. Climate, 19, 6104– 6121, 2006.
Hagan, D. E., Webster, C. R., Farmer, C. B., et al.: Validating AIRS upper atmosphere water vapor retrievals using aircraft and bal-loon in situ measurements, Geophys. Res. Lett., 31, L21103, doi:10.1029/2004GL020302, 2004.
Held, I. M. and Soden, B. J.: Water vapor feedback and global warming, Ann. Rev. Energy Environ., 25, 441–475, 2000. Kalnay, E., Kanamitsu, M., Kistleret, R., et al.: The NCEP/NCAR
40-year reanalysis project, B. Am. Meteorol. Soc., 77, 437–471, 1996.
Kiladis, G. N.: Observations of Rossby waves linked to convection over the eastern tropical Pacific, J. Atmos. Sci., 55, 321–339, 1998.
Liebmann, B. and Smith, C. A. : Description of a complete (inter-polated) outgoing longwave radiation data set, B. Amer. Meteor. Soc., 77, 1275–1277, 1996.
Madden, R. A. and Julian, P. R.: Observations of the 40–50-Day Tropical Oscillation–A Review, Mon. Weather Rev., 122, 814– 837, 1994.
Matthews A. J. and Kiladis, G. N.: The tropical-extratropical inter-action between high frequency transients and the Madden-Julian Oscillation, Mon. Weather Rev., 127, 661–677, 1999b.
Mote, P. W., Clark, H. L., Dunkerton, T. J., Harwood, R. S., and Pumphrey, H. C.: Intraseasonal variations of water vapor in the tropical upper troposphere and tropopause region, J. Geophys. Res., 105, 17 457–17 470, 2000.
Pierrehumbert, R. T.: Lateral mixing as a source of subtropical wa-ter vapor, Geophys. Res. Lett., 25, 1784–1806, 1998.
Pierrehumbert, R. T. and Rocca, R.: Evidence for control of At-lantic subtropical humidity by large scale advection, Geophys. Res. Lett., 25, 4537–4540, 1998.
Pierrehumbert, R.T., Brogniez, H., and Roca, R.: On the relative humidity of the atmosphere, in: The Global Circulation of the Atmosphere, edited by: Schneider, T. and Sobel, A. H., Princeton
J.-M. Ryoo et al.: Subtropical upper tropospheric humidity 2655 University Press, 2007.
Postel, G. A. and Hitchman, M. N.: A climatology of Rossby wave breaking along the subtropical tropopause, J. Atmos. Sci., 56, 359–373, 1999.
Randel, W. J. and Park, M.: Deep convective influence on the Asian summer monsoon anticycle and associated tracer varaibility ob-served with Atmospherci Infrared Sounder (AIRS), J. Geophys. Res., 111, D12314, doi:10.1029/2005JD006490, 2006.
Read, W. G., Waters, J. W., Flower, D. A., et al.: Upper-tropospheric water vapor from UARS MLS, B. Am. Meteorol. Soc., 76, 2381– 2389, 1995.
Read, W. G., Waters, J. W., Wu, D. L., et al.: UARS Mi-crowave Limb Sounder upper tropospheric humidity measure-ment: Method and validation, J. Geophys. Res., 106, 32 207– 32 258, 2001.
Read, W. G., Lambert, A., Backmeister, J., et al.: Aura Mi-crowave Limb Sounder Upper Tropospheric and Lower Strato-spheric H2O and RHi Validation, J. Geophys. Res., 112, D24S35,
doi:10.1029/2007JD008752, 2007.
Rind D., Chiou, E. W., Chu, W., et al.: Overview of the Strato-spheric Aerosol and Gas Experiment II water vapor observations – Method, validation, and data characteristics, J. Geophys. Res., 98, 4835–4856, 1993.
Salathe, E. P. and Hartmann, D. L.: A Trajectory Analysis of Trop-ical Upper-Tropospheric Moisture and Convection, J. Climate, 10, 2533–2547, 1997.
Salby, M. L. and Hendon H. H.: Intraseasonal Behavior of Clouds, Temperature, and Motion in the Tropics, J. Atmos. Sci., 51, 2207–2224, 1994.
Sassi, F., Salby, M., Pumphrey, H. C., and Read, W. G.: Influence of the Madden-Julain Oscillation on upper tropospheric humidity, J. Geophys. Res., 107(D23), 4681, doi:10.1029/2001JD001331, 2002.
Sherwood, S. C.: Maintenance of the free-tropospheric tropical wa-ter vapor distribution, Part II: Simulation by large-scale advec-tion, J. Climate, 9, 2919–2934, 1996.
Sherwood, S. C., Kursinski, E. R., and Read, W. G.: A distribution law for free-tropospheric relative humidity, J. Climate, 19, 6267– 6277, 2006.
Soden, B. J. and Bretherton, F. P.: Upper-tropospheric relative-humidity from the GOES 6.7 µm channel Method and climatol-ogy for July 1987, J. Geophys. Res., 98, 16 669–16 688, 1993. Spencer, R. W. and W. D. Braswell: How dry is the tropical free
troposphere? implication for global warming theory, B. Am. Me-teorol. Soc., 78, 1097–1106, 1997.
Tian, B. J., Waliser, D. E., Fetzer, E. J., et al.: Vertical moist ther-modynamic structure and spatial-temporal evolution of the MJO in AIRS observations, J. Atmos. Sci., 63, 2462–2485, 2006. Tobin, D. C., Revercomb, H. E., Knuteson, R. O., et al.: ARM
site atmospheric state best estimates for AIRS temperature and water vapor retrieval validation, J. Geophys. Res., 111, D09S14, doi:10.1029/2005JD006103, 2006.
Waugh, D. W.: Impact of potential vorticity intrusions on subtropi-cal upper tropospheric humidity, J. Geophys. Res., 110, D11305, doi:10.1029/2004JD005664, 2005.
Waugh, D. W. and Funatsu, B. M.: Intrusions into Tropical Upper Troposphere: Three Dimensional Structure and accompanying Ozone and OLR distributions, J. Atmos. Sci., 60, 637–653, 2003. Waugh, D. W. and Polvani, L. M.: Intrusions into the tropical upper
troposphere, Geophys. Res. Lett., 27, 3857–3860, 2000. Zhang, C., Mapes, B. E., and Soden, B. J.: Bimodality in tropical