HAL Id: insu-01968751
https://hal-insu.archives-ouvertes.fr/insu-01968751
Submitted on 3 Jan 2019
HAL is a multi-disciplinary open access archive for the deposit and dissemination of sci-entific research documents, whether they are pub-lished or not. The documents may come from teaching and research institutions in France or abroad, or from public or private research centers.
L’archive ouverte pluridisciplinaire HAL, est destinée au dépôt et à la diffusion de documents scientifiques de niveau recherche, publiés ou non, émanant des établissements d’enseignement et de recherche français ou étrangers, des laboratoires publics ou privés.
Photochemical reaction playing a key role in particulate
matter pollution over Central France: Insight from the
aerosol optical properties
Dawei Hu, Ying Chen, Yu Wang, Véronique Daële, Mahmoud Idir, Chenjie
Yu, Jinhe Wang, Abdelwahid Mellouki
To cite this version:
Dawei Hu, Ying Chen, Yu Wang, Véronique Daële, Mahmoud Idir, et al.. Photochemical re-action playing a key role in particulate matter pollution over Central France: Insight from the aerosol optical properties. Science of the Total Environment, Elsevier, 2019, 657, pp.1074-1084. �10.1016/j.scitotenv.2018.12.084�. �insu-01968751�
1
Photochemical reaction playing a key role in particulate matter
pollution over Central France: Insight from the aerosol optical
properties
Dawei Hu1,2*, Ying Chen3, Yu Wang2, Véronique Daële1, Mahmoud Idir1, Chenjie Yu2, Jinhe Wang1,4, Abdelwahid Mellouki1*
5
1Institut de Combustion, Aérothermique, Réactivité et Environnement, ICARE-CNRS/OSUC,
Orléans, France
2School of Earth and Environmental Sciences, University of Manchester, UK. 3Lancaster Environment Centre (LEC), Lancaster University, UK.
4School of Municipal and Environmental Engineering, Shandong Jianzhu University, Shandong,
10
China
*Corresponding authors: [email protected], [email protected]
Abstract
Atmospheric particle is one of the major air pollutants, and believed to be 15
important for air quality, radiative forcing and climate. Measurements of aerosol optical
properties, size distribution and PM10 concentration were conducted at Orleans, central
France during spring (7 March to 25 April) and autumn (25 October to 5 December)
2013. The average values of aerosol scattering coefficient (bsca), absorption coefficient
(babs), single scattering albedo (SSA) at 532 nm and PM10 concentration are 54.9 ± 58.2
20
Mm-1, 10.6 ± 10.9 Mm-1, 0.81 ± 0.10 and 30.6 ± 21.6 μg/m3 for the spring campaign,
and 35.4 ± 36.7 Mm-1, 3.9 ± 4.4 Mm-1, 0.83 ± 0.13 and 17.4 ± 11.8 μg/m3 for the autumn
campaign, respectively. During the whole observation, the air parcel transported from
2
coming from the Eastern Europe induces the pollution events in Orleans. In this study, 25
a simple approach, which based on the diurnal variation of PM10 concentration,
Boundary layer depth (BLD) and the human activity factor derived from anthropogenic
emission rate, was introduced to estimate the contribution of secondary aerosol to
ambient aerosols. Our results show that secondary particles formation trigged by
photochemical reactions and oxidations can contribute maximum of 64% and 32% for 30
PM10 mass concentration during the spring and autumn time, respectively. These results
highlight that photochemical reactions can enhance the atmospheric oxidation capacity
and may faster the secondary particle formation and then play an important role in air
quality.
35
Keywords: Photochemical reactions, Optical properties, Size distribution,
Orleans-France, Secondary formation.
Introduction
Atmospheric particles play an important role in affecting air quality, radiative 40
forcing and climate (Charlson et al., 1992). Aerosol particles influence climate both
directly, by scattering and absorbing solar and infrared radiation (Charlson et al.,
1992;Haywood et al., 1997), and indirectly, by altering the albedo and lifetime of clouds
3
impact of air pollution, is highly dependent on the aerosol loading, and can be calculated 45
by aerosol extinction coefficient (bext), i.e., Vis=3.912/bext (Seinfeld and Pandis, 2006).
The new particle formation (NPF) and secondary particle (including inorganic and
organic) formation processes in the atmosphere can lead to increase of particle
number/mass. NPF is one of the main sources of the atmospheric aerosols under the
clean environment (such as forest (Makela et al., 1997) and Arctic marine boundary 50
layer (Covert et al., 1996)). Binary nucleation of H2SO4-H2O and ternary H2SO4-H2
O-NH3 were considered as the commonly way for NPF (Seinfeld and Pandis, 2006).
Recent study reported that the presence of amine (Kurten et al., 2008;Paasonen et al.,
2012;Lv et al., 2015) or organic compounds (Zhang et al., 2004;Schobesberger et al.,
2013;Wang et al., 2017) may play an important role in NPF events. NPF can lead to 55
significant increase of ultrafine particle number concentration (Kulmala et al., 2004),
however, further studies are needed to quantify its contribution to total particle mass
loading. Secondary organic aerosols (SOA) are major contributors to aerosol mass
loading, as reported by previous measurements (Zhang et al., 2007;Jimenez et al.,
2009;Huang et al., 2014). The common mechanism of SOA formation is the oxidation 60
of volatile organic compounds (VOCs), forming products of lower volatility that
subsequently condense to the pre-existing particles. Organic aerosols account for a
4
et al., 2005;Zhang et al., 2007). There is growing evidence to show that the organic
aerosols, especially SOA particles, play important role in affecting the air quality. On 65
the other hand, secondary inorganic aerosols (SIA), mainly nitrate and sulfate,
constitute also a major contributor to particle mass loading, as reported by previous
observational (Liu et al., 2017;Wu et al., 2018) and modelling studies (Chen et al.,
2016a;Chen et al., 2018). SIA is usually formed from the oxidation of SO2 and NOx in
heterogeneous reactions (Lelieveld and Heintzenberg, 1992;Riemer et al., 2003;Brown 70
and Stutz, 2012;Chen et al., 2016a;Chen et al., 2018) and gaseous reactions followed
by neutralization with ammonia and condense on pre-existing particle surface (Seinfeld
and Pandis, 2006). Therefore, the oxidation of VOCs is a critical process of SOA
formation, the oxidation of SO2 and NOx are an important process of SIA formation.
Photochemical reactions are important source of oxidizing agents in the 75
atmosphere, e.g., ozone and OH radical. Aerosol optical properties are suggested to be
good indicators of photochemical reaction events. Aerosol optical properties are
believed to be related to their chemical composition. It is well known that light
absorption by dust and black carbon aerosols has a warming effect on climate (Jacobson,
2001;Yang et al., 2009;Bond et al., 2013) while light scattering from inorganic aerosols 80
such as sulfate, nitrate, and sea salt has a cooling effect. Field and laboratory studies
5
of them exhibit light absorption properties. Chow et al. (2009) observed increasing light
absorption toward shorter wavelengths during afternoon hours at the Fresno supersite
when the SOA formed by photochemical reactions dominated the total aerosol carbon 85
mass. All those studies suggest that the aerosol absorption related parameters, such as
absorption coefficient (babs) and especially the aerosol concentration independent
parameter single scattering albedo (SSA), are good indicators of the atmospheric
photochemical reaction events.
In the last decade, aerosol optical properties have been investigated intensively in 90
the world (Table 1), especially in China, but only limited studies were conducted in
Europe, and generally those limited works were most concentrated in the Mediterranean
area (see Table 1). In March 2014, a heavy pollution episode has occurred in the central
interior of France, the observed PM10 concentration in Paris was higher than its “alert
level”, i.e. 80µg/m3. The central interior of France is under the influence of both
95
polluted air masses from industrial countries (Eastern Europe) and clean ones from
Atlantic Ocean (Birmili et al., 2001;Hu et al., 2014). The mixing of these different types
of air masses may lead to complex aerosol optical properties in this region. Our previous
studies (Hu et al., 2014) have measured the aerosol extinction coefficient in this region
(Orleans, France) during autumn time in 2012. The average aerosol extinction 100
6
values of the air masses from Atlantic Ocean. However, up to now, the knowledge of
aerosol optical properties, especially SSA, in the central region of France is very limited.
Moreover, the contribution of air masses from Atlantic Ocean and industrial countries
(Eastern Europe) to the atmospheric aerosols in the central interior of France is still 105
unclear.
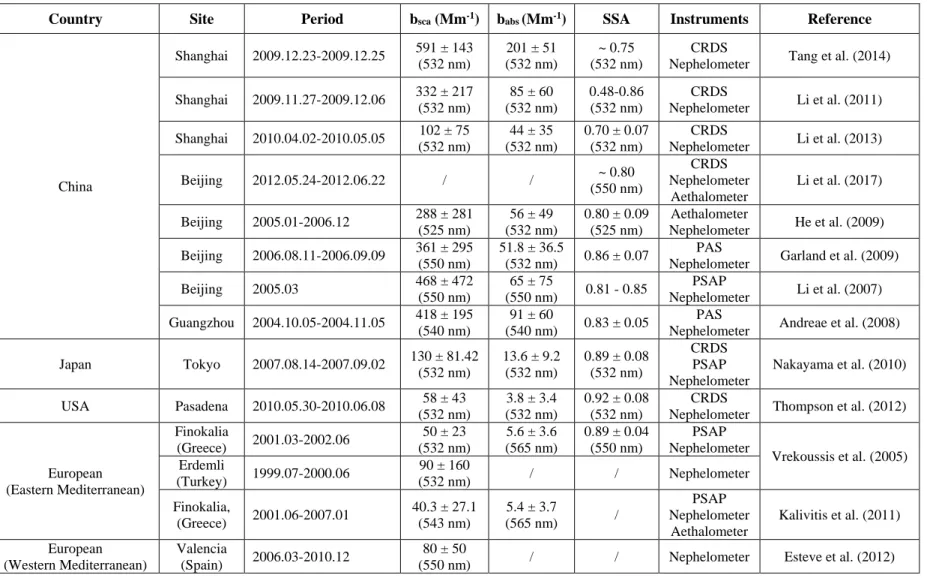
Table 1 Summary of the reported atmospheric aerosol optical property measurement
studies.
110
In this study, aerosol scattering and extinction coefficient were measured in
Orleans, a central region of France, during spring and autumn time of 2013.
Simultaneous measurements of PM10 and gaseous pollutants such as NOx and O3 were
also conducted during this period. The influences of air masses from Atlantic Ocean
and industrial countries on the air quality of the central region of France were explored 115
based on those data and the air masses back trajectory analysis. In addition, the
contribution of photochemical reaction process to the atmosphere aerosol mass
concentration was estimated according to the data of particle size distribution, boundary
layer, human activity factor and PM10 concentration.
2. Experimental setup and methods
7
2.1. Sampling site and period
The measurements presented in this study were made during the period from 7
March to 25 April and from 25 October to 5 December, 2013 at the campus of the
Centre National de la Recherche Scientifique (CNRS) in Orleans, France
(47°50′16.80″N, 1°56′39.34″E). Orleans city is located in the central France, about 120 125
km southwest of Paris. The typical average concentrations of O3, NO2, NO and PM10
from May 2012 to March 2013 in Orleans are 52.8 ± 12.7, 24.0 ± 14.4, 4.3 ± 3.4 and
18.0 ± 5.9 μg/m3, respectively (http://www.ligair.fr/). Our sampling site, positioned at
the CNRS campus, is mostly surrounded by residential dwellings and about 8 km south
of the Orleans city center. There are no obstructing buildings around the sampling site 130
within 50 m. During the measurement, Cavity Ring-down Spectrometer (CRDS) and
nephelometer (Model 3563, TSI, USA) sampled the ambient aerosols from an inlet
located 1 m above the roof of the site (~3.5 m above the ground). Before entering the
instruments, the ambient aerosols passed through a 2 m stainless steel tube and a silica
drier. In this study, the desiccant was replaced 2 times per week and the relative 135
humidity (RH) of the sample before and after changing the desiccant was monitored for
each replacement. The recorded data reveal that the RH of the dehydrated aerosol is
less than 15%. Particle number size distribution was also measured by using a scanning
8
2.2. Aerosol Optical Properties
140
To quantify aerosol optical effects, aerosol optical properties have commonly been
determined by measuring scattering coefficient (bsca) using integrated nephelometers
(Heintzenberg and Charlson, 1996;Li et al., 2011;Esteve et al., 2012;Li et al., 2013),
measuring absorption coefficients (babs) using the particle/soot absorption photometer
(PSAP) (Vrekoussis et al., 2005;Li et al., 2007;Kalivitis et al., 2011), Aethalometer 145
(Hansen et al., 1984;Arnott et al., 2005;He et al., 2009;Kalivitis et al., 2011) and
photoacoustic spectrometer (PAS) (Andreae et al., 2008;Garland et al., 2009), as well
as measuring extinction coefficient using cavity ring-down spectroscopy (CRDS)
(Nakayama et al., 2010;Li et al., 2011;Li et al., 2013;Hu et al., 2014). According to
those optical parameters, a useful variable to describe the relative effects of scattering 150
compared with absorption, i.e., single scattering albedo (SSA), can be derived by the
equation of SSA= bsca/bext.
In this study, light extinction coefficients of ambient particles were measured
using a CRDS at 532 nm. The CRDS system is a self-built and has been described in
detail elsewhere (Hu et al., 2014). Briefly, laser light at 532 nm, generated by a pulsed 155
Nd:YAG laser (EXPL-532-200-E, Spectra-Physics Inc., USA), is firstly introduced into
a cavity cell and then bounced numerous times between two highly reflective mirrors
9
USA). Each time the pulse interacts with the back mirror, a small amount of light (e.g.,
0.003%) leaks out and is detected by a photomultiplier tube (PMT, R928, Hamamatsu 160
Inc., Japan). After getting the decay time of the cavity filled with (
) and without (
0)aerosols, the aerosol extinction coefficient (bext) can be calculated according to the
following equation:
(1)
where L is the length between the mirrors (m), is the effective sample path length (m), 165
c is the speed of light (m/s). During the experiments, the CRDS was operated at the
sample flow rate of 2 lpm (liter per minute), resulting a residence time of around 32 s.
In addition, in order to avoid interferences from NO2 and other absorbing trace gas
species, blank checks of the CRDS system were performed automatically every 2 h by
turning the 3-way valve to the filter direction allowing the measurement of bext for the
170
particle-free ambient air. Before each measurement, CRDS was calibrated by
polystyrene latex spheres (PSL) particles.
Light scattering coefficients of ambient particles were measured using a
three-wavelength (450, 550, 700 nm) integrating nephelometer (TSI model 3563, USA). In
this study, it was operated at the sample flow rate of 2.5 lpm with a minute averaging 175
time. To avoid the interference of the gas-phase compounds, a 10 min zero check was
done automatically by measuring bsca of the particle-free ambient air every 2 h. Before
0 1 1 ( ) ext L b cl l
10
each field campaign, the nephelometer was calibrated in the laboratory using CO2 and
the filtered air. Due to the design limitations, the scattered light in the nephelometer
3563 was integrated over an angular range of 7-170º, and did not cover the full angular 180
range (0-180º). Thus, a truncation correction developed by Anderson and Ogren (1998)
was applied to the measurement data. In addition, to derive the SSA data, the scattering
coefficient at 532 nm was calculated by the following equation:
(2)
where the Ångstrom exponent (Å) can be derived from the measurement of at two 185
different wavelengths and through the following equation:
(3)
2.3 Particle Number Size Distribution
The SMPS was described in detail elsewhere (Heim et al., 2004). Herein, only a
brief description is presented. In the SMPS system used in this work (TSI Inc., USA), 190
the particles are firstly neutralized with Kr85 diffusion charger and size selected using a
differential mobility analyzer (DMA, Model 3081). The selected monodisperse
particles subsequently go to a butanol-based condensation particle counter (CPC,
Model 3022A), which determines the particle concentration at that size. In this study,
the detectable aerosol mobility diameters ranged from 10.7 to 487.3 nm with a sheath 195 ,532 , 532 ( ) sca sca Å b b , sca b 1
2 1 2 , , 1 2 log( / ) log( / ) sca sca b b Å 11
and sample flow rates of 5 lpm and 0.5 lpm, respectively. The total counting time
required for each sample was about 130 s, consisting of a 120 s up scan and a 10 s
retrace. Before measurements, SMPS was calibrated with PSL particles.
2.4 Assessment of secondary particles
In this study, we calculated PM10 concentration (PM10_calc) with respect of
200
boundary layer dilution and fresh anthropogenic emissions from human activities (as
described in the following) by using equation (4), and compare PM10_calc with the
measured PM10 concentration (PM10_meas) to investigate the potential influence of
secondary particles formation on PM loading.
𝑃𝑀10_𝑐𝑎𝑙𝑐 = 𝑃𝑀10_𝑚𝑒𝑎𝑠 × 𝑓(anthropogenic emission) × 𝑓(𝐵𝐿𝐷) (4) 205
where 𝑓(anthropogenic emission) is the human activity factor in term of PM emission which was derived from the anthropogenic emission flux of PM at the
measurement site, and 𝑓(𝐵𝐿𝐷) is the dilution factor of boundary layer change. Both factors are described below in detail.
The anthropogenic emission flux of PMat the measurement site (Kuenen et al., 210
2014) is presented in Fig S-2. The emission data from TNO (Nederlandse Organisatie
voor Toegepast Natuurwetenschappelijk Onderzoek) with consideration of emissions
12
we assume the particle loading during the period from 00:00 to 07:00 (local time) is
influenced by the anthropogenic emissions (Fig S-1) and photochemical reaction very 215
slightly (PM10 concentration was stable during this time period which is showed by the
red curves in Fig.2,). While after 07:00, these emissions become stronger and could be
a main source of ambient aerosols. To better understand the contribution of
anthropogenic emission to the ambient aerosol during the day time, anthropogenic
emission flux during 00:00-07:00 were chosen as the reference and normalized to 1, the 220
human activity factor (𝑓(anthropogenic emission)) in term of PM emission during the rest hours (07:00-00:00) is calculated as a ratio to the reference value, assuming that
the fresh emitted PM is mixed in the boundary layer during the rest hours of the day.
The dilution effect of boundary layer mixing is also considered as following.
During the night (00:00-07:00), PM10 and Boundary layer depth (BLD) are stable for
225
both campaigns (Fig. 2). The data in this time period are averaged and used as the
reference to calculate the variation of PM10 concentration which is only due to the
dilution effect of boundary layer changing for the remaining hours (07:00-00:00).
3. Results and discussion
3.1 Impact of air mass origination on air quality
230
Fig. 1 illustrates the bext, bsca, babs, SSA at 532 nm, PM10, O3, NO, NO2, NOx, RH
13
7 March to 25 April and during the autumn time from 25 October to 5 December 2013,
the corresponding averaged values are summarized in Table 2. The different terms
appearing in the second and third rows of Table 2 are further defined and explained in 235
the text. During the whole measurements, the particle optical parameters such as bext,
bsca and babs are in good agreement with the PM10 concentration (R2 = 0.95, 0.95 and
0.75, respectively). For the spring campaign (Fig. 1(a)), the average values of bext, bsca
and babs at 532 nm were 65.6 ± 67.8 Mm-1, 54.9 ± 58.2 Mm-1 and 10.6 ± 10.9 Mm-1,
respectively. This result is comparable with those observed in Eastern and Western 240
Mediterranean (as shown in Table 1), but much lower than those observed in the Mega
cities of China (Beijing, Shanghai and Guangzhou) and Japan (Tokyo). During this
period, two pollution episodes were observed from 24 March to 1 April (represented as
“pollution days”, noted as “P-1”) and from 2 April to 7 April (noted as “P-2”). The maximum values of PM10 and bext during “P-1” and “P-2” periods reached up to 93.4
245
μg/m3, 317.8 Mm-1 and 73.8 μg/m3, 249.1 Mm-1, respectively. It is noteworthy that (see
Fig. 1(a)) the northeast (NE) wind was dominant during these two pollution events and
the air parcel was mainly coming from Eastern Europe (Fig. S-1, calculated by
HYSPLIT trajectory model, NOAA, http://ready.arl.noaa.gov/HYSPLIT.php). This
result suggests that the air parcel transported from Eastern Europe may be responsible 250
14
2016b). As shown in Fig. 1(a), the air quality during the period from 16 March to 19
March (represented as “clean days”, noted as “C-1”) and from 9 April to 13 April (noted
as “C-2”) is much better than during the other days. The average PM10 and bext for
“C-1” and “C-2” periods are only 10.0 μg/m3, 23.5 Mm-1 and 11.7 μg/m3, 10.1 Mm-1,
255
respectively. Meteorology (Fig. 1(a)) and air parcel back trajectory (Fig. S-1(a)) reveal
that the wind direction during the period of “C-1” and “C-2” was almost southwest (SW), and the air parcel was mainly coming from the Atlantic Ocean. This result is
consistent with our previous observations (Hu et al., 2014), i.e. air parcel transported
from Atlantic Ocean could improve the air quality of Orleans. In addition, to better 260
understand the influence of air masses from Atlantic Ocean and Eastern Europe on the
air quality in Orleans, the period from 20 March to 23 March (noted as “L-1”) was
selected to represent the local pollution conditions in Orleans since the wind speed is
almost zero during this period. As can be seen in Table 2, the average PM10 and bext
values during “L-1” period are 30.4 μg/m3 and 77.9 Mm-1, respectively, about 2.0 and
265
2.1 times lower than “P-1”, 1.5 and 1.7 times lower than “P-2”, while about 3.0 and 3.3 times higher than “C-1”, 2.6 and 7.7 times higher than “C-2”.
Fig. 1. Time series of bext, bsca, babs, SSA at 532 nm, PM10, O3, NO, NO2, NOx, RH and T
from: (a) 7 March to 25 April, (b) 25 October to 5 December 2013. 270
15
Table 2. Summary of the average and maximum values of bext, bsca, babs, SSA, PM10, O3,
NO, NO2 and NOx during the different period.
For the autumn campaign (Fig. 1(b)), the average values of bext, bsca, babs at 532 nm
275
and PM10 were 37.5 ± 37.8 Mm-1, 35.4 ± 36.7 Mm-1, 3.9 ± 4.4 Mm-1 and 17.4 ± 11.8
μg/m3 respectively, about 2 times lower than the values observed during the spring
campaign. As shown in Fig. 1(b), the air quality during the period from 25 October to
9 November, represented as “clean days” and noted as “C”, was much better than other
days. The averages of PM10 and bext during the “C” period were only 3.8 μg/m3 and 7.5
280
Mm-1, respectively. As expected, the SW wind was dominant (Fig. 1(b)) for those clean
days and the air parcel was coming from Atlantic Ocean (Fig. S-1(b)). While for other
days, from 10 November to 5 December (noted as “M”), the wind direction (Fig. 1(b))
was complex and the air masses came from several different sources (Fig. S-1(b)). The
mixing of these different types of air masses can be representative of the typical 285
atmosphere mixing conditions in the Orleans area. As shown in Table 2, the average
PM10 and bext values during the “M” period were 22.0 ± 12.7 μg/m3 and 52.7 ± 40.5
Mm-1, respectively, about 1.3 and 1.4 times larger than the average values during the
16
3.2 Diurnal variations of PM10, O3, NOx and particles optical properties
290
Fig. 2 shows the statistic diurnal variation of the PM10, BLD, NOx, O3 and
photolysis rate of NO2 (JNO2) during the spring and autumn time. In this “box” diagrams,
the mean value is represented by a dot. The dividing segment in the box is the median.
The top and bottom box limits represent the 75 and 25 percentile, respectively. The
error bars are related to the percentiles 95th and 5th. As shown in Fig 2, the BLD 295
(calculated by Archived Meteorology, GDAS (1 deg. 3hourly. Global), NOAA,
http://ready.arl.noaa.gov/READYamet.php) is stable at night while increases
consistently in the daytime. The maxima of the average BLD in the daytime are around
1200 and 900 m for the spring and autumn campaigns, respectively, about 5 and 2 times
larger than the corresponding night time values. Since the particles concentration is 300
highly influenced by the BLD, the fast increases of BLD in the daytime should decrease
the PM10 concentration quickly. However, in the real conditions of our measurements
(Fig. 2), the daily PM10 concentration is stable and only shows a slight decrease during
afternoon hours. A reasonable explanation for this phenomenon is that the formed or
produced particles from the atmospheric chemical reactions in the daytime may 305
17
Fig. 2. Statistic diurnal variation of PM10, Boundary layer depth (BLD), NOx, O3 and JNO2
from: (a) 7 March to 25 April, (b) 25 October to 5 December 2013.
310
Several field studies have shown that atmospheric photochemical reactions are the
main source of atmospheric particles in the daytime. In this study (Fig. 2), a distinct
diurnal photochemical reaction process, i.e. strong O3 formation, was observed in both
campaigns. Moreover, there are limited industries in the central region of France and
our sampling site is mostly surrounded by residential dwellings, the photochemical 315
reaction processes should be proposed to be the main source of ambient aerosols in
Orleans. To further support this point, the statistic diurnal variation of aerosols optical
properties (including babs, bsca and SSA) during the spring and autumn time are present
in Fig. 3. In these figures, the SSA exhibits a clear daily pattern, with three “drop down” within a day at 8:00, 14:00 and 18:00 for the spring campaign and at 8:00, 12:00 and 320
17:00 for the autumn campaign. The daily variability of SSA occurs in the morning,
and in the evening is mostly due to the rush hours (Esteve et al., 2012). There is a large
amount of black carbon particles emitted during this period. Whereas for the SSA
variation occurs in the early afternoon, it is supposed to be derived by the SOA which
are formed through photochemical reaction processes because: (1) Field and laboratory 325
18
aerosols formed by photochemical reactions are another light-absorber in the
atmosphere apart from black carbon and mineral dust; (2) the SSA second “drop down”
appears at the highest solar intensity (highest JNO2) time. The peak of JNO2 is measured
at 13:00 and 12:00 within a day for the spring and autumn campaigns, respectively. 330
Fig. 3. Statistic diurnal variation of babs, bsca and SSA at 532 nm from: (a) 7 March to 25
April, (b) 25 October to 5 December 2013.
To better understand the impact of photochemical reactions on the air quality in the 335
central region of France, the contribution of photochemical reaction processes to the
atmosphere aerosols needs to be estimated. As shown in Fig.2, the PM10 and BLD are
stable during the night (00:00-07:00) for both campaigns. We assume the variation of
PM10 concentration is only due to the dilution effect (BLD changes) for the remaining
hours (07:00-00:00) and can be calculated according to this stable condition. The 340
difference of PM10 between the calculated and measured values can be considered as
the contribution of the atmosphere photochemical reaction processes. Actually, this
value was overestimated because not only the photochemical reaction processes, but
other processes like emissions from human activities can also contribute to the
atmospheric aerosol pollution. To avoid the influence of this, the human activity factor 345
19
derived from anthropogenic emission rate of PM2.5 (from TNO-MACC-II inventory,
(Kuenen et al., 2014)) was considered in this work (as shown in Fig. S2). The calculated
variation of PM10 concentration which considered both BLD dilution and human
activities effects is presented as the green curve in Figure 2 (the detailed calculation and
parameters was described in part 2.4). Based on the above estimations, the fraction of 350
the photochemical reaction formed particles in PM10 was calculated ((PM10_meas–
PM10_calc)/ PM10_meas) and presented in Fig.4. It reveals that particles formed from
photochemical reactions can account maximum of 64% and 32% for PM10
concentration during the spring and autumn times, respectively. These results indicate
that photochemical reactions may play an important role in impacting air quality in 355
Orleans.
It is worth to clarify that, in this section, we use the statistical analysis, which based
on the data during the whole period in spring or autumn, to show the photochemical
reactions can enhance the atmospheric oxidation capacity and may faster the secondary
particle formation and then play an important role in air quality. But in section 3.1, we 360
give the case studies to show the air parcel transported from Atlantic Ocean plays a role
in cleaning up the ambient air in Orleans, while the air mass coming from the Eastern
20
limited times and short period. The results get from those 2 different analysis methods
are not contradictory. 365
Fig. 4. The estimated fraction of photochemical reaction producing particles in PM10.
3.3. Particles formation and growth events during the typical photochemical
reaction process.
370
To better understand the influence of atmospheric photochemical reaction
processes on the air quality in Orleans, the statistic diurnal variation of particles size
distribution, NOx, O3 and JNO2 during the period from 31 October to 9 November, 2013
are presented in Fig. 5. As shown in Fig. 1(b), the air quality is much better during these
days. The southwestern wind is dominant during this period and the air parcel comes 375
from Atlantic Ocean (Fig. S-1(b)). This atmospheric meteorological condition is
suitable for the observation of new particle formation and growth events since particles
transported from Atlantic Ocean are mainly of the micrometer-level (sea salt aerosols).
This latter can be easily distinguished with the newly formed nanometer-level particles.
21
Fig. 5. Statistic diurnal variation of the particle size distribution, NOx, O3 and JNO2 from
31 October to 9 November, 2013.
As shown in Fig. 5, a clear new particles formation process was observed around
13:00, the maximum particle number concentration reached up to 3488 #/cm-3. As
385
expected, a typical photochemical reaction process with O3 formation was observed
during this period, and O3 approached its peak value of 60 µg/m3 (median and mean
values) around 13:00. This suggests that photochemical reactions enhance the new
particle formation, which may play an important role in impacting air quality in
Orleans. Furthermore, the highly humid condition (RH = 92 % in average) during this 390
period also favors the new particle formation process.”
4. Conclusions
In this study, the aerosols optical properties, size distribution and PM10
concentration measurements were conducted at Orleans, France during spring (7 March
to 25 April) and autumn (25 October to 5 December) 2013. The average values of bsca,
395
babs, SSA at 532 nm and PM10 concentration are 54.9 ± 58.2 Mm-1, 10.6 ± 10.9 Mm-1,
0.81 ± 0.10, 30.6 ± 21.6 μg/m3 and 35.4 ± 36.7 Mm-1, 3.9 ± 4.4 Mm-1, 0.83 ± 0.13, 17.4
± 11.8 μ/m3 for the spring and autumn, respectively. During the whole observation, the
22
in Orleans, while the air mass coming from the Eastern Europe induces pollution events 400
in Orleans. In addition, a distinct diurnal pattern of photochemical reaction and ozone
formation were observed in pollution cases. Further analysis reveals that particles
formation triggered by photochemical reactions in daytime can account for a maximum
of 64% and 32% of PM10 mass loading during the spring and autumn, respectively. Our
results highlight that photochemical reactions may play an important role in secondary 405
particles formation and new particles formation and then impacting air quality in the
central region of France, and possibly other regions as well.
Acknowledgment
This work was supported by FP7 project (AMIS, No.PIRSES-GA-2011), ARD
PIVOTS program (supported by the Centre-Val de Loire regional council), Labex 410
VOLTAIRE (ANR-10-LABX-100-01), the National Natural Science Foundation of
China (Nos. 41305124). Dawei Hu thanks Shanghai Tongji Gao Tingyao
Environmental Science & Technology Development Foundation for a fellowship
support.
References
415
Anderson, T. L., and Ogren, J. A., 1998. Determining aerosol radiative properties using
23
Andreae, M. O., and Gelencser, A., 2006. Black carbon or brown carbon? The nature
of light-absorbing carbonaceous aerosols. Atmospheric Chemistry and Physics. 6,
3131-3148. 420
Andreae, M. O., Schmid, O., Yang, H., Chand, D., Yu, J. Z., Zeng, L. M., et al., 2008.
Optical properties and chemical composition of the atmospheric aerosol in urban
Guangzhou, China. Atmospheric Environment. 42, 6335-6350.
Arnott, W. P., Hamasha, K., Moosmuller, H., Sheridan, P. J., and Ogren, J. A., 2005.
Towards aerosol light-absorption measurements with a 7-wavelength Aethalometer: 425
Evaluation with a photoacoustic instrument and 3-wavelength nephelometer. Aerosol
Science and Technology. 39, 17-29.
Birmili, W., Wiedensohler, A., Heintzenberg, J., and Lehmann, K., 2001. Atmospheric
particle number size distribution in central Europe: Statistical relations to air masses
and meteorology. Journal of Geophysical Research-Atmospheres. 106, 32005-32018. 430
Bond, T. C., Doherty, S. J., Fahey, D. W., Forster, P. M., Berntsen, T., DeAngelo, B.
J., et al., 2013. Bounding the role of black carbon in the climate system: A scientific
assessment. Journal of Geophysical Research-Atmospheres. 118, 5380-5552.
Brown, S. S., and Stutz, J., 2012. Nighttime radical observations and chemistry.
Chemical Society Reviews. 41, 6405-6447. 435
Charlson, R. J., Schwartz, S. E., Hales, J. M., Cess, R. D., Coakley, J. A., Hansen, J. E.,
et al., 1992. Climate forcing by anthropogenic aerosols. Science. 255, 423-430.
Chen, Y., Cheng, Y. F., Ma, N., Wolke, R., Nordmann, S., Schuttauf, S., et al., 2016a.
Sea salt emission, transport and influence on size-segregated nitrate simulation: a case
study in northwestern Europe by WRF-Chem. Atmospheric Chemistry and Physics. 16, 440
24
Chen, Y., Cheng, Y. F., Nordmann, S., Birmili, W., van der Gon, H., Ma, N., et al.,
2016b. Evaluation of the size segregation of elemental carbon (EC) emission in Europe:
influence on the simulation of EC long-range transportation. Atmospheric Chemistry
and Physics. 16, 1823-1835. 445
Chen, Y., Wolke, R., Ran, L., Birmili, W., Spindler, G., Schroder, W., et al., 2018. A
parameterization of the heterogeneous hydrolysis of N2O5 for mass-based aerosol
models: improvement of particulate nitrate prediction. Atmospheric Chemistry and
Physics. 18, 673-689.
Chow, J. C., Watson, J. G., Doraiswamy, P., Chen, L. W. A., Sodeman, D. A., 450
Lowenthal, D. H., et al., 2009. Aerosol light absorption, black carbon, and elemental
carbon at the Fresno Supersite, California. Atmospheric Research. 93, 874-887.
Covert, D. S., Wiedensohler, A., Aalto, P., Heintzenberg, J., McMurry, P. H., and Leck,
C., 1996. Aerosol number size distributions from 3 to 500 nm diameter in the arctic
marine boundary layer during summer and autumn. Tellus Series B-Chemical and 455
Physical Meteorology. 48, 197-212.
Esteve, A. R., Estelles, V., Utrillas, M. P., and Martinez-Lozano, J. A., 2012. In-situ
integrating nephelometer measurements of the scattering properties of atmospheric
aerosols at an urban coastal site in western Mediterranean. Atmospheric Environment.
47, 43-50. 460
Garland, R. M., Schmid, O., Nowak, A., Achtert, P., Wiedensohler, A., Gunthe, S. S.,
et al., 2009. Aerosol optical properties observed during Campaign of Air Quality
Research in Beijing 2006 (CAREBeijing-2006): Characteristic differences between the
inflow and outflow of Beijing city air. Journal of Geophysical Research-Atmospheres.
114. 465
25
Hansen, A. D. A., Rosen, H., and Novakov, T., 1984. The aethalometer - an instrument
for the real-time measurement of optical-absorption by aerosol-particles. Science of the
Total Environment. 36, 191-196.
Haywood, J. M., Roberts, D. L., Slingo, A., Edwards, J. M., and Shine, K. P., 1997.
General circulation model calculations of the direct radiative forcing by anthropogenic 470
sulfate and fossil-fuel soot aerosol. Journal of Climate. 10, 1562-1577.
He, X., Li, C. C., Lau, A. K. H., Deng, Z. Z., Mao, J. T., Wang, M. H., et al., 2009. An
intensive study of aerosol optical properties in Beijing urban area. Atmospheric
Chemistry and Physics. 9, 8903-8915.
Heim, M., Kasper, G., Reischl, G. P., and Gerhart, C., 2004. Performance of a new 475
commercial electrical mobility spectrometer. Aerosol Science and Technology. 38,
3-14.
Heintzenberg, J., and Charlson, R. J., 1996. Design and applications of the integrating
nephelometer: A review. Journal of Atmospheric and Oceanic Technology. 13,
987-1000. 480
Hu, D. W., Li, L., Idir, M., Mellouki, A., Chen, J. M., Daele, V., et al., 2014. Size
Distribution and Optical Properties of Ambient Aerosols during Autumn in Orleans,
France. Aerosol and Air Quality Research. 14, 744-755.
Huang, R. J., Zhang, Y. L., Bozzetti, C., Ho, K. F., Cao, J. J., Han, Y. M., et al., 2014.
High secondary aerosol contribution to particulate pollution during haze events in 485
China. Nature. 514, 218-222.
Jacobson, M. Z., 2001. Strong radiative heating due to the mixing state of black carbon
26
Jimenez, J. L., Canagaratna, M. R., Donahue, N. M., Prevot, A. S. H., Zhang, Q., Kroll,
J. H., et al., 2009. Evolution of Organic Aerosols in the Atmosphere. Science. 326, 490
1525-1529.
Kalivitis, N., Bougiatioti, A., Kouvarakis, G., and Mihalopoulos, N., 2011. Long term
measurements of atmospheric aerosol optical properties in the Eastern Mediterranean.
Atmospheric Research. 102, 351-357.
Kanakidou, M., Seinfeld, J. H., Pandis, S. N., Barnes, I., Dentener, F. J., Facchini, M. 495
C., et al., 2005. Organic aerosol and global climate modelling: a review. Atmospheric
Chemistry and Physics. 5, 1053-1123.
Kaufman, Y. J., Koren, I., Remer, L. A., Rosenfeld, D., and Rudich, Y., 2005. The
effect of smoke, dust, and pollution aerosol on shallow cloud development over the
Atlantic Ocean. Proceedings of the National Academy of Sciences of the United States 500
of America. 102, 11207-11212.
Kuenen, J. J. P., Visschedijk, A. J. H., Jozwicka, M., and van der Gon, H., 2014.
TNO-MACC_II emission inventory; a multi-year (2003-2009) consistent high-resolution
European emission inventory for air quality modelling. Atmospheric Chemistry and
Physics. 14, 10963-10976. 505
Kulmala, M., Vehkamaki, H., Petaja, T., Dal Maso, M., Lauri, A., Kerminen, V. M., et
al., 2004. Formation and growth rates of ultrafine atmospheric particles: a review of
observations. Journal of Aerosol Science. 35, 143-176.
Kurten, T., Loukonen, V., Vehkamaki, H., and Kulmala, M., 2008. Amines are likely
to enhance neutral and ion-induced sulfuric acid-water nucleation in the atmosphere 510
27
Lelieveld, J., and Heintzenberg, J., 1992. Sulfate cooling effect on climate through
in-cloud oxidation of anthropogenic SO2. Science. 258, 117-120.
Li, C., Marufu, L. T., Dickerson, R. R., Li, Z. Q., Wen, T. X., Wang, Y. S., et al., 2007.
In situ measurements of trace gases and aerosol optical properties at a rural site in 515
northern China during East Asian Study of Tropospheric Aerosols: An International
Regional Experiment 2005. Journal of Geophysical Research-Atmospheres. 112.
Li, L., Chen, J. M., Chen, H., Yang, X., Tang, Y., and Zhang, R. Y., 2011. Monitoring
optical properties of aerosols with cavity ring-down spectroscopy. Journal of Aerosol
Science. 42, 277-284. 520
Li, L., Chen, J. M., Wang, L., Melluki, W., and Zhou, H. R., 2013. Aerosol single
scattering albedo affected by chemical composition: An investigation using CRDS
combined with MARGA. Atmospheric Research. 124, 149-157.
Li, R., Hu, Y. J., Li, L., Fu, H. B., and Chen, J. M., 2017. Real-time aerosol optical
properties, morphology and mixing states under clear, haze and fog episodes in the 525
summer of urban Beijing. Atmospheric Chemistry and Physics. 17, 5079-5093.
Liu, Y. C., Wu, Z. J., Wang, Y., Xiao, Y., Gu, F. T., Zheng, J., et al., 2017.
Submicrometer Particles Are in the Liquid State during Heavy Haze Episodes in the
Urban Atmosphere of Beijing, China. Environmental Science & Technology Letters. 4,
427-432. 530
Lv, S. S., Miao, S. K., Ma, Y., Zhang, M. M., Wen, Y., Wang, C. Y., et al., 2015.
Properties and Atmospheric Implication of Methylamine Sulfuric Acid-Water Clusters.
28
Makela, J. M., Aalto, P., Jokinen, V., Pohja, T., Nissinen, A., Palmroth, S., et al., 1997.
Observations of ultrafine aerosol particle formation and growth in boreal forest. 535
Geophysical Research Letters. 24, 1219-1222.
Moise, T., Flores, J. M., and Rudich, Y., 2015. Optical Properties of Secondary Organic
Aerosols and Their Changes by Chemical Processes. Chemical Reviews. 115,
4400-4439.
Nakayama, T., Hagino, R., Matsumi, Y., Sakamoto, Y., Kawasaki, M., Yamazaki, A., 540
et al., 2010. Measurements of aerosol optical properties in central Tokyo during
summertime using cavity ring-down spectroscopy: Comparison with conventional
techniques. Atmospheric Environment. 44, 3034-3042.
Paasonen, P., Olenius, T., Kupiainen, O., Kurten, T., Petaja, T., Birmili, W., et al., 2012.
On the formation of sulphuric acid - amine clusters in varying atmospheric conditions 545
and its influence on atmospheric new particle formation. Atmospheric Chemistry and
Physics. 12, 9113-9133.
Riemer, N., Vogel, H., Vogel, B., Schell, B., Ackermann, I., Kessler, C., et al., 2003.
Impact of the heterogeneous hydrolysis of N2O5 on chemistry and nitrate aerosol
formation in the lower troposphere under photosmog conditions. Journal of 550
Geophysical Research-Atmospheres. 108.
Saxena, P., and Hildemann, L. M., 1996. Water-soluble organics in atmospheric
particles: A critical review of the literature and application of thermodynamics to
identify candidate compounds. Journal of Atmospheric Chemistry. 24, 57-109.
Schobesberger, S., Junninen, H., Bianchi, F., Lonn, G., Ehn, M., Lehtipalo, K., et al., 555
29
and large oxidized organic molecules. Proceedings of the National Academy of
Sciences of the United States of America. 110, 17223-17228.
Seinfeld, J. H., and Pandis, S. N.: Atmospheric Chemistry and Physics: From Air
Pollution to Climate Change, John Wiley & Sons, New York., 2006. 560
Tang, Y., Huang, Y. L., Li, L., Chen, H., Chen, J. M., Yang, X., et al., 2014.
Characterization of aerosol optical properties, chemical composition and mixing states
in the winter season in Shanghai, China. Journal of Environmental Sciences. 26,
2412-2422.
Thompson, J. E., Hayes, P. L., Jimenez, J. L., Adachi, K., Zhang, X. L., Liu, J. M., et 565
al., 2012. Aerosol optical properties at Pasadena, CA during CalNex 2010. Atmospheric
Environment. 55, 190-200.
Vrekoussis, M., Liakakou, E., Kocak, M., Kubilay, N., Oikonomou, K., Sciare, J., et
al., 2005. Seasonal variability of optical properties of aerosols in the Eastern
Mediterranean. Atmospheric Environment. 39, 7083-7094. 570
Wang, Z. B., Wu, Z. J., Yue, D. L., Shang, D. J., Guo, S., Sun, J. Y., et al., 2017. New
particle formation in China: Current knowledge and further directions. Science of the
Total Environment. 577, 258-266.
Wu, Z. J., Wang, Y., Tan, T. Y., Zhu, Y. S., Li, M. R., Shang, D. J., et al., 2018. Aerosol
Liquid Water Driven by Anthropogenic Inorganic Salts: Implying Its Key Role in Haze 575
Formation over the North China Plain. Environmental Science & Technology Letters.
5, 160-166.
Yang, M., Howell, S. G., Zhuang, J., and Huebert, B. J., 2009. Attribution of aerosol
30
atmospheric measurements during EAST-AIRE. Atmospheric Chemistry and Physics. 580
9, 2035-2050.
Zhang, Q., Jimenez, J. L., Canagaratna, M. R., Allan, J. D., Coe, H., Ulbrich, I., et al.,
2007. Ubiquity and dominance of oxygenated species in organic aerosols in
anthropogenically-influenced Northern Hemisphere midlatitudes. Geophysical
Research Letters. 34. 585
Zhang, R. Y., Suh, I., Zhao, J., Zhang, D., Fortner, E. C., Tie, X. X., et al., 2004.
Atmospheric new particle formation enhanced by organic acids. Science. 304,
31
Table 1 Summary of the reported atmospheric aerosol optical property measurement studies.
Country Site Period bsca (Mm-1) babs (Mm-1) SSA Instruments Reference
China Shanghai 2009.12.23-2009.12.25 591 ± 143 (532 nm) 201 ± 51 (532 nm) ~ 0.75 (532 nm) CRDS
Nephelometer Tang et al. (2014) Shanghai 2009.11.27-2009.12.06 332 ± 217 (532 nm) 85 ± 60 (532 nm) 0.48-0.86 (532 nm) CRDS Nephelometer Li et al. (2011) Shanghai 2010.04.02-2010.05.05 102 ± 75 (532 nm) 44 ± 35 (532 nm) 0.70 ± 0.07 (532 nm) CRDS Nephelometer Li et al. (2013) Beijing 2012.05.24-2012.06.22 / / ~ 0.80 (550 nm) CRDS Nephelometer Aethalometer Li et al. (2017) Beijing 2005.01-2006.12 288 ± 281 (525 nm) 56 ± 49 (532 nm) 0.80 ± 0.09 (525 nm) Aethalometer Nephelometer He et al. (2009) Beijing 2006.08.11-2006.09.09 361 ± 295 (550 nm) 51.8 ± 36.5 (532 nm) 0.86 ± 0.07 PAS
Nephelometer Garland et al. (2009)
Beijing 2005.03 468 ± 472 (550 nm) 65 ± 75 (550 nm) 0.81 - 0.85 PSAP Nephelometer Li et al. (2007) Guangzhou 2004.10.05-2004.11.05 418 ± 195 (540 nm) 91 ± 60 (540 nm) 0.83 ± 0.05 PAS
Nephelometer Andreae et al. (2008) Japan Tokyo 2007.08.14-2007.09.02 130 ± 81.42 (532 nm) 13.6 ± 9.2 (532 nm) 0.89 ± 0.08 (532 nm) CRDS PSAP Nephelometer Nakayama et al. (2010) USA Pasadena 2010.05.30-2010.06.08 58 ± 43 (532 nm) 3.8 ± 3.4 (532 nm) 0.92 ± 0.08 (532 nm) CRDS
Nephelometer Thompson et al. (2012)
European (Eastern Mediterranean) Finokalia (Greece) 2001.03-2002.06 50 ± 23 (532 nm) 5.6 ± 3.6 (565 nm) 0.89 ± 0.04 (550 nm) PSAP Nephelometer Vrekoussis et al. (2005) Erdemli (Turkey) 1999.07-2000.06 90 ± 160 (532 nm) / / Nephelometer Finokalia, (Greece) 2001.06-2007.01 40.3 ± 27.1 (543 nm) 5.4 ± 3.7 (565 nm) / PSAP Nephelometer Aethalometer Kalivitis et al. (2011) European (Western Mediterranean) Valencia (Spain) 2006.03-2010.12 80 ± 50
32
Table.2 Summary of the average and maximum values of bext, bsca, babs, SSA, PM10, O3, NO, NO2 and NOx during the different period.
bext (Mm-1) bsca (Mm-1) babs (Mm-1) SSA PM10 (μg/m3) O3 (μg/m3) NO (μg/m3) NO2 (μg/m3) NOx (μg/m3) Spring All Ave 65.6 54.9 10.6 0.81 30.6 66.3 1.2 5.7 6.8 Std 67.8 58.2 10.9 0.10 21.6 23.9 4.1 4.2 6.2 Max 317.8 256.0 68.3 1.00 93.4 137.8 79.7 25.8 95.0 C-1 Ave 23.5 21.5 2.0 0.91 10.0 78.8 0.6 4.3 4.9 Std 12.7 11.9 1.2 0.06 5.4 7.1 0.8 1.8 2.3 Max 44.0 41.8 13.1 1.00 20.5 89.8 4.3 9.4 12.2 P-1 Ave 164.8 140.4 24.4 0.85 62.1 67.3 1.3 6.3 7.6 Std 54.3 46.9 11.0 0.05 15.0 21.7 4.0 3.3 4.7 Max 317.8 256.0 68.3 1.00 93.4 110.0 35.4 21.3 41.2 P-2 Ave 136.3 116.5 19.8 0.86 44.8 60.3 1.1 5.7 6.8 Std 56.8 46.3 12.0 0.05 13.6 24.9 2.4 2.7 3.0 Max 249.1 205.0 60.0 1.00 73.8 107.4 13.5 12.5 15.6 C-2 Ave 10.1 8.1 2.0 0.81 11.7 77.8 0.3 2.9 3.1 Std 8.1 4.3 4.7 0.11 6.8 10.0 0.4 1.0 1.0 Max 191.9 74.3 131.1 1.00 43.9 92.6 2.0 5.2 5.5 L-1 Ave 77.9 66.8 11.1 0.84 30.4 45.1 0.8 5.5 6.2 Std 74.0 64.4 11.0 0.10 25.1 28.8 1.0 4.0 4.2 Max 303.3 244.2 59.0 1.00 93.4 98.9 5.6 21.6 22.3
33 Autumn Ave 37.5 35.4 3.9 0.83 17.4 37.0 15.3 34.4 49.7 All Std 37.8 36.7 4.4 0.13 11.8 20.4 13.0 11.6 20.9 Max 251.2 221.8 53.2 1.00 77.5 87.2 130.7 84.5 197.4 C Ave 12.3 9.8 2.9 0.77 9.9 50.3 12.6 28.2 40.8 Std 7.5 6.5 2.7 0.14 3.8 15.6 2.8 7.1 9.2 Max 59.9 52.4 28.9 1.00 21.4 87.2 41.8 59.7 101.5 M Ave 52.7 50.5 4.8 0.88 22.0 28.8 17.4 39.4 56.8 Std 40.5 38.7 5.3 0.10 12.7 18.6 17.0 12.1 24.6 Max 251.2 221.8 53.2 1.00 77.5 74.6 130.7 84.5 197.4
34
Figure Captions
Fig. 1. Time series of bext, bsca, babs, SSA at 532 nm, PM10, O3, NO, NO2, NOx, RH and
T from: (a) 7 March to 25 April, (b) 25 October to 5 December 2013.
Fig. 2. Statistic diurnal variation of PM10, Boundary layer depth (BLD), NOx, O3 and
JNO2 from: (a) 7 March to 25 April, (b) 25 October to 5 December 2013.
Fig. 3. Statistic diurnal variation of babs, bsca and SSA at 532 nm from: (a) 7 March to
25 April, (b) 25 October to 5 December 2013.
Fig. 4. The estimated fraction of photochemical reaction producing particles in PM10.
Fig. 5. Statistic diurnal variation of the particle size distribution, NOx, O3 and JNO2 from
35
36
Fig. 2
37
38
39