HAL Id: hal-00304962
https://hal.archives-ouvertes.fr/hal-00304962
Submitted on 1 Jan 2004HAL is a multi-disciplinary open access archive for the deposit and dissemination of sci-entific research documents, whether they are pub-lished or not. The documents may come from teaching and research institutions in France or abroad, or from public or private research centers.
L’archive ouverte pluridisciplinaire HAL, est destinée au dépôt et à la diffusion de documents scientifiques de niveau recherche, publiés ou non, émanant des établissements d’enseignement et de recherche français ou étrangers, des laboratoires publics ou privés.
nitrogen fluxes in northern catchments of Norway and
Finland
Ø. Kaste, K. Rankinen, A. Lepistö
To cite this version:
Ø. Kaste, K. Rankinen, A. Lepistö. Modelling impacts of climate and deposition changes on nitro-gen fluxes in northern catchments of Norway and Finland. Hydrology and Earth System Sciences Discussions, European Geosciences Union, 2004, 8 (4), pp.778-792. �hal-00304962�
Modelling impacts of climate and deposition changes on nitrogen
fluxes in northern catchments of Norway and Finland
Ø. Kaste
1, K. Rankinen
2and A. Lepistö
21Norwegian Institute for Water Research, Southern Branch, Televeien 3, N-4879 Grimstad, Norway 2Finnish Environment Institute SYKE, P.O.Box 140, FIN-00251 Helsinki, Finland
Email for corresponding author: [email protected]
Abstract
The Integrated Nitrogen model for Catchments (INCA) was applied to three upland catchments in Norway and Finland to assess the possible impacts of climate change and nitrogen (N) deposition on concentrations and fluxes of N in streamwater in cold regions of Europe. The study sites cover gradients in climate and N deposition from the southern boreal Øygard Brook (2.6 km2) in SW Norway, via the southern/middle
boreal Simojoki River (3610 km2) in northern Finland to the sub-arctic Dalelva Brook (3.2 km2) in northern Norway. The INCA scenario
simulations included future N deposition scenarios (current legislation and maximum feasible reduction) and climate scenarios for 2050 (ECHAM4/OPYC3; HadCM3) treated separately and in combination. As a result of climate change, the INCA model predicted markedly reduced duration and amounts of snow cover in all catchments. The occurrence of winter rainfall and melting periods was predicted to become more frequent so that more frequent floods in winter will, to a large extent, replace the regular snowmelt flood in spring. At the northernmost catchment, Dalelva, the predicted temperature increase might result in a doubling of the net mineralisation rate, thereby greatly increasing the amount of available inorganic N. At all catchments, the increased N supply was predicted to be largely balanced by a corresponding increase in N retention, and relatively small increases in NO3 leaching rates were predicted. This dynamic relationship is, however, strongly
dependent on the temperature responses of the key N transformation processes modelled. A future reduction in N emissions and deposition, as agreed under current legislation, would have pronounced effects on concentrations of NO3 in streamwater at the southernmost catchment,
Øygard, even following a climate change around 2050. At the more remote Dalelva and Simojoki catchments, the N emission reductions will be small compared to the internal N recycling processes, and climate change will to a large extent offset the effects of reduced N deposition.
Keywords: catchments, surface water, scenarios, climate, hydrology, nitrogen deposition, nitrate leaching
Introduction
Both nitrogen (N) deposition and global change can affect retention and loss of N from catchments to upland surface waters. During the last two decades, there have been substantial national and international efforts to reduce the emissions of S and N compounds in Europe (UN/ECE, 2000; Bull et al., 2001; Skeffington, 2002). Assuming implementation of the Gothenburg protocol and relevant EU directives, the emissions of oxidised and reduced N compounds will be reduced to 196070 levels by 2010 (Schöpp et al., 2003). Many of the scenarios developed for future climate in the Nordic countries predict both long-term increases in temperature and precipitation amounts, as
well as increased frequency and severity of extreme events such as floods and storms (Førland et al., 2000; Palmer and Räisänen, 2002). Given that many of the key processes active in terrestrial ecosystems such as the release of N and C from soil organic matter by mineralisation are temperature and moisture dependent, climate-induced changes in N retention and losses from semi-natural ecosystems may be expected (Kirschbaum, 1995; Van Breemen et al., 1998; Wright, 1998). A warmer climate can enhance both acidification and eutrophication by increasing the release of N from soil organic matter to runoff (Wright and Schindler, 1995).
At present the northern parts of Norway and Finland are characterised by long (57 months), cold winters with
continuous snow cover and ice cover over rivers and lakes. A snowmelt-induced spring flood in late April-May usually dominates the annual hydrological pattern, whereas less pronounced flow peaks often occur in autumn due to rainfall events. In these areas, a major fraction of the annual NO3
loss occurs during these high flow periods (Kaste and Skjelkvåle, 2002; Rankinen et al., 2004). In low-lying near-coastal areas of southern and southwestern Scandinavia, on the other hand, the climate is maritime and winters are often mild with little snow accumulation. In such regions flood peaks occur frequently in all seasons and, usually, there is no distinct spring flood. These temporal patterns change considerably in the future, given the predictions of a warmer and wetter climate in northern Europe.
Nitrogen concentrations and fluxes in rivers are the net result of catchment N sources (non-point sources, atmospheric N deposition, direct effluent discharges, mineralisation) and sinks (plant uptake, immobilisation, denitrification). The process-oriented Integrated Nitrogen model for Catchments (INCA) attempts, quantitatively, to describe these factors by linking hydrology and N inputs from atmospheric deposition, agriculture and populated areas with the microbial processes controlling N behaviour in soils and river reaches (Whitehead et al., 1998; Wade et
al., 2002; Wade, 2004). After calibration to a river
catchment, the INCA model might be used as a management tool, e.g. to assess the contribution of various N sources to catchment N pools and river NO3 concentrations.
Additionally, it can be used in assessments of land-phase and in-stream responses to various scenarios of environmental change, including climate change (Wade et
al., 2002).
The INCA model has previously been calibrated to two catchments in Norway (Øygard Brook, Dalelva Brook) (Kaste, 2004) and one in Finland (Simojoki River) (Lepistö
et al., 2004; Rankinen et al., 2002, 2004). These catchments
are typical of upland areas in Norway and Finland with little anthropogenic influence and, together, they provide a good coverage of the climate and deposition gradients observed in the cold regions of Europe. Climate scenarios for this region predict increases over the next 50 years in annual temperatures (1.53.0 oC) and precipitation (020%)
(Hanssen-Bauer, 1999; Førland et al., 2000; FINSKEN, 2003). This may entail significant changes in hydrology, biogeochemical cycling and surface water quality in catchments. In this paper, the INCA model has been applied to the Dalelva, Øygard and Simojoki catchments in Norway and Finland, to evaluate possible impacts of the predicted change in climate and N deposition on snow accumulation, flow patterns, streamwater concentrations and fluxes of N.
Materials and methods
STUDY SITES
Dalelva Brook and Øygard Brook
The Norwegian study sites are located in diametrically opposite parts of the country, Øygard in the south at 58o35N
and Dalelva in the north at 69o45N (Fig. 1). Nevertheless,
their catchment characteristics are comparable in many respects (Table 1). Both Øygard and Dalelva are relatively small (2.6 and 3.2 km2, respectively), undisturbed
catchments dominated by heathland and mountains. At Øygard, about 20 km from the estuary of the Bjerkreim River (685 km2), the bedrock geology consists of Precambrian
migmatites, banded gneisses and anorthosite covered by glacial sediments. Soils are thin and patchy, especially in the upper parts of the catchment, which consists largely of heathland with minor areas of bare rocks (83%); approximately 7% of the total catchment area is occupied by several small lakes (Fig. 1). At Dalelva the bedrock geology is mica schist and micaceous gneiss covered by glacial sediments of similar lithology (Wright and Traaen, 1992). Soils are podsolic, thin and patchy in the upper parts of the catchment. Vegetation is dominated by birch forest up to about 150 m elevation with heathlands and moorlands above. About 15% of the Dalelva catchment is covered with lakes.
Simojoki River
The Simojoki river basin in northern Finland is much larger than the Norwegian study catchments (3160 km2) and lies
partly in the southern boreal- and partly in the middle boreal
Table 1. Site characteristics and climate at the study sites. The
mean climatic data from Dalelva, Øygard and Simojoki cover the periods 19902000, 19932000, and 19712000, respectively (Kaste and Skjelkvåle, 2002; Drebs et al., 2002).
Dalelva Øygard Simojoki
Catchment area (Ac) km2 3.2 2.55 3160 Altitude m a.s.l. 0241 185544 0200 Land cover: - Forest % of Ac 20 4 39 - Heath/mountains 61 83 0 - Peatland 4 6 531 - Agriculture 0 0 3 - Lakes 15 7 6
Climate (ann. averages)
- Air temperature oC 0.2 6.7 0.51.5
- Precipitation m yr1 0.63 2.15 0.60
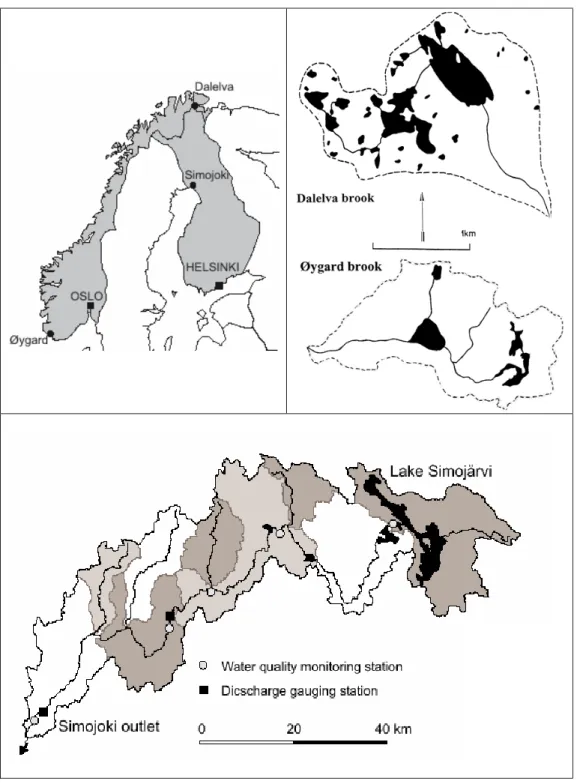
Fig. 1. Maps of Norway and Finland showing the locations of the study sites.
vegetation zone (Fig. 1).The Simojoki River discharges to the Gulf of Bothnia in the Baltic Sea; it is a salmon river without any major point load sources of pollutants. The dominant human impacts in the area are forestry, mainly forest drainage and cutting, agriculture and atmospheric deposition. On average, about 0.5% of the total catchment area is felled annually. The most common bedrock types in
the area are granites and gneisses. Bedrock is covered by till and near the outlet of the river also by river deposits, mainly sand. The land cover is typical for northern Finland, i.e. more dominated by peatlands and forest than the Norwegian study catchments. Peatlands and peatland forests constitute 53% of the Simojoki catchment, whereas nearly 40% is covered by forest on mineral soil (Table 1). Cut areas
cover about 5% of the total forested area, with 1% on organic soil and 4% on mineral soil. Further, about 6% of the river basin area is covered by lakes, whereas agricultural fields cover only 2.7% (Perkkiö et al., 1995). Here, grass cultivation for animal husbandry is the most common form of agricultural production.
CHEMICAL AND HYDROMETEOROLOGICAL CHARACTERISATION
Streamwater chemistry
The period 199395 was selected as the basis for the Norwegian INCA calibrations (Kaste, 2004). Water chemistry data from this period comprise weekly samples at Dalelva and fortnightly samples from Øygard. The samples were analysed unfiltered at the Norwegian Institute for Water Research (NIVA) for several hydrochemical determinands. Nitrate (NO3) and ammonium (NH4+) were
analysed by automated colorimetry, NO3 after reduction
with cadmium amalgam, NH4+ after reaction with
hypochlorite and phenol, and total nitrogen (TN) after oxidation with peroxodisulphate. Detection limits for NO3,
NH4+, and TN are 1, 5, and 10 µg N L1, respectively. NH4+
was not analysed during 199395, but the concentration levels are documented by monitoring in 1988, 2000 and during the first half of 2001 (Kaste and Skjelkvåle, 2002). The Finnish INCA application was based on the period 19941996, because these years overlap with the completion of the land-use classification. For the Simojoki River, the N concentration data were obtained from the water quality database operated by the Finnish Environment Institute (SYKE) and regional environment centres. Water samples (1216 samples yr1) were taken at the outlet and along the
Simojoki River during 19941996. Samples were analysed for NO3, NH4+, and TN by the same methods as at NIVA.
Climate and hydrology
At Øygard and Dalelva, daily data on air temperature, precipitation and snow depth were obtained from the nearest monitoring stations operated by the Norwegian Meteorological Institute (met.no, 2001; Kaste and Skjelkvåle, 2002). At the Øygard catchment, mild winters in combination with large precipitation amounts generate a highly variable runoff pattern with frequent flood episodes at all seasons. The Dalelva catchment has a mean annual air temperature around 0oC and annual precipitation amounts
around 600 mm yr1, whereas the corresponding numbers
for the Øygard catchment are around 7oC and 2100 mm yr1,
respectively (Table 1). The Dalelva catchment is usually covered with snow for 67 months of the year, ranging from the middle of October to late May. Thus, the seasonal runoff
pattern is characterised by very low flows during winter and a distinct snowmelt flood in MayJune. At their outlets, both catchments have weirs where discharge is monitored continuously by pressure transducers and loggers operated by NIVA (Kaste and Skjelkvåle, 2002).
In the Simojoki basin, mean annual precipitation was 650 750 mm and mean annual runoff 350450 mm over the period 19611975. There are about 170180 winter days and the mean annual temperature is +0.5 to +1.5 oC. The
duration of the snow cover is from the middle of November to early May. The Simojoki River freezes up at the end of October or the beginning of November, and the ice cover usually breaks up in the middle of May. The Simojoki River has two discharge gauging stations; one at the river outlet and one at the Hosionkoski rapids, in the middle reach of the main river. Mean daily flow at the outlet was 37 m3 s1
during 19651990 (Perkkiö et al., 1995).
Atmospheric N deposition and land use
Both the Norwegian catchments have atmospheric deposition as the only external N input (other than N fixation) (Table 2). N deposition data were obtained from the nearest monitoring stations in the Norwegian monitoring programme on long-range transported air pollutants (cf. Kaste and Skjelkvåle, 2002). The data are wet and dry deposition of total inorganic N (TIN), the sum of NO3 and
NH4+: the wet deposition is determined by the chemical
composition and the amount of precipitation, whereas dry deposition is estimated from ambient air concentrations and dry deposition velocities for individual components (Tørseth and Semb, 1998). Whereas N deposition loads at Dalelva are among the lowest in Norway, Øygard is in the part of
Table 2. N deposition scenarios: Present level and estimated future
N deposition of oxidised N species (oxi-N) and reduced N species (red-N) given the current legislation (CLE) and maximum feasible reduction (MFR) of N emissions with current technology. The present day is measured deposition during 199395 at Dalelva and Øygard and 19941996 at Simojoki. The CLE scenario includes the Gothenburg protocol (UN/ECE, 2000) and the National Emission Ceilings (NEC) directive adopted by the European Union. Estimates of future N deposition are modelled by EMEP/IIASA (Schöpp et al., 2003).
Dalelva Øygard Simojoki
(kg N ha1 yr1) oxi-N red-N oxi-N red-N oxi-N red-N
Present day 1.40 1.30 9.50 7.40 1.51 0.78
CLE 1.02 1.20 5.79 6.63 1.25 0.75
Norway receiving the highest amount of long-range transported air pollution; average N deposition during 1993-95 (~17 kg N ha yr1) was six times that at Dalelva. The
percentages of each land cover type modelled at the Dalelva and Øygard catchments were obtained from topographic maps, thematic maps and aerial photographs (Kaste and Skjelkvåle, 2002).
In the forested areas of the Simojoki river basin, atmospheric deposition and N fixation are the only external N inputs but agricultural areas are fertilised (Rankinen et
al., 2004). Inorganic N deposition (Ndep) was estimated using
the areal deposition model DAIQUIRI (Kangas and Syri, 2002). Average atmospheric N deposition was 2.3 kg ha1
yr1 during 199496. For the model application, the most
recent satellite image-based land use and forest classification data for Finland were utilised (Vuorela, 1997), supplemented with satellite image-based maps of forest cuttings on mineral and organic soils, provided by the Finnish Forest Research Institute (FFRI).
SCENARIOS USED FOR MODELLING Atmospheric N deposition
Two scenarios for future changes in N deposition were included: (i) deposition assuming implementation of current legislation (CLE) and (ii) deposition resulting from implementation of maximum feasible reduction (MFR) of emissions. The CLE scenario includes the obligations agreed within the multi-pollutant, multi-effect protocol signed in Gothenburg in 1999 (UN/ECE, 2000) and the limits set by the National Emission Ceilings (NEC) directive that has been adopted by the European Union. The MFR scenario is based on the maximum reduction of N emissions that could be obtained with the currently available technology. N deposition estimates for each study site were derived from a gridded dataset (150 × 150 km) generated by EMEP and IIASA (Schöpp et al., 2003). The CLE scenario entails a 1327% reduction of N deposition at the study sites compared to the levels in 199396 (Table 2). With the MFR scenario, the deposition might be reduced by 3849%.
Climate
At Øygard and Dalelva, climate scenarios are obtained from the Norwegian RegClim project, which applies dynamic and empirical downscaling techniques to derive regional climate scenarios from global climate models (Hanssen-Bauer, 1999; Førland et al., 2000). The climate scenarios applied at the Norwegian catchments were based on the ECHAM4/ OPYC3 model from the Max Planck Institute in Germany and the GSDIO integration, which includes the effects of greenhouse gases, tropospheric ozone, and direct as well as
indirect sulphur aerosol forcing (Roeckner et al., 1999). In the Simojoki application, two climate change scenarios (low and high) were based on the Hadley Centre model HadCM3-gg and the IS92a emission scenario (Carter et al., 1996). The implication of these scenarios for seasonal temperature and precipitation in Finland has been interpreted by Jylhä (unpubl.) within the FINSKEN project (FINSKEN, 2003; Table 3). Using these seasonal changes, three-year daily temperature and precipitation values were generated for the 2050s and added as input to the Watershed Forecasting and Simulation System (WSFS). The growing season length at the study sites was assumed to increase by nine days for every degree increase in mean annual temperature (Kuusisto et al., 1996).
In Scandinavia, the two global climate models (ECHAM4 and HadCM3) give strong similarities albeit with slightly different projections of seasonal temperature and precipitation changes (Christensen et al., 2001; Haugen and Ødegaard, 2003). According to the Norwegian scenarios for 20002050, the mean annual air temperatures are expected to increase slightly more at Dalelva (2.6oC) than
at Øygard (1.8 oC). The highest temperature increase is
expected to take place in winter (Table 3). Further, the mean annual precipitation is expected to increase by about 8% at Dalelva and about 14% at Øygard, with the largest increase during autumn (September to November). At Simojoki, the mean annual air temperatures are expected to increase by
Table 3. Climate scenarios: Estimated change of air temperature
(T) and precipitation (P) for each of four seasons (DFJ= December, January, February; etc.) in the year 2050 relative to 2000. Data for Dalelva and Øygard are scaled down from the ECHAM4/ OPYC3-GSDIO integration (Hanssen-Bauer, 1999; Førland et al., 2000), whereas the Simojoki application is based on downscaled data from the global HadCM3-gg model from the Hadley Centre, UK (Jylhä, unpubl.; FINSKEN, 2003). The HadCM3-gg data includes two possible scenarios (high/low).
DJF MAM JJA SON Year
DT (°C) Dalelva 3.5 2.5 1.6 2.6 2.6 Øygard 2.0 1.6 1.6 1.8 1.8 Simojoki, low 2.2 1.1 1.2 1.4 1.5 Simojoki, high 6.0 3.0 3.2 3.8 4.0 DP (%) Dalelva 5.2 5.0 1.5 18.2 7.8 Øygard 9.3 1.2 18.2 23.5 13.5 Simojoki, low 8.6 -0.1 4.4 4.7 4.4 Simojoki, high 23.4 -0.2 12.0 12.9 12.0
1.5oC (low scenario) to 4.0oC (high scenario) by 2050. As
at Dalelva and Øygard, the largest increase is expected in winter (Table 3). Annual precipitation amounts at the Finnish site might increase by 4% (low scenario) to 12% (high scenario), mostly in winter (December-February).
MODELLING APPROACH The INCA model
A new version of the process-based and semi-distributed INCA model (Whitehead et al., 1998) has been developed and described in detail by Wade et al., 2002; Wade, 2004). The model integrates hydrology, catchment and river N processes, and simulates daily NO3 and NH4+ concentrations
as time series at key sites, as profiles down the river system, or as statistical distributions. The INCA model requires input of daily time series of air temperature (AT), actual precipitation (P), soil moisture deficit (SMD), and hydrologically effective rainfall (HER; the fraction of P that contributes directly to runoff). Water inputs from melting snow were estimated by a separate snow accumulation and snowmelt model (Vehviläinen, 1992; Rankinen et al., 2004). Additionally, the model requires information about sub-catchment structure (number, size, reach length), physical properties of the selected sub-catchments, and inputs of N from atmospheric deposition, fertiliser application and effluent discharges. The model version INCA 1.7.12, used in this study, includes an improved procedure to calculate soil temperature under snow cover in winter (Rankinen et
al., 2004).
Model calibration and scenario runs
The INCA model was calibrated to both Øygard and Dalelva (Kaste, 2004) and to the Simojoki river basin (Lepistö et
al., 2004; Rankinen et al. 2002, 2004). The principles for
model calibration were somewhat different. In the Norwegian catchments, the simulated mineralisation rates were set close to observed net mineralisation values (Kaste, 2004) while in the Finnish catchment, the goal was to model gross mineralisation immobilisation (= net mineralisation) close to observed values.
In the present study, the calibrated INCA applications have been used as a basis for various scenario simulations. For the N deposition scenarios, N deposition time series for the periods 199395 (Øygard; Dalelva) and 19941996 (Simojoki) were modified to simulate possible future changes (Table 2). In this procedure, the daily deposition estimates were changed proportionally to the expected changes in annual deposition.
In the case of climate scenarios, the 199395 temperature, precipitation and derived SMD and HER time series were
modified according to the seasonal changes indicated in Table 3 (delta change method). Except for growing season length, the parameter values from the original calibrations (hydrological constants, N process rates, etc.) were retained unchanged for these simulations. The hydrological input data for the Simojoki River were derived from the results of the Watershed Forecasting and Simulation System (WSFS), a conceptual hydrological model that simulates runoff using precipitation, potential evaporation and temperature as inputs. The principles of the WSFS are based on the HBV model (Bergström, 1976). Calibration of the hydrological sub-model of INCA for the Simojoki River has been described by Rankinen et al. (2002).
Based on the climate change scenarios in Table 3, three-year daily temperature and precipitation values were generated for the 2050s and added as input to the WSFS model, the original input data for which cover the period 19902000. Observations from seven precipitation stations and three temperature stations were used, as well as water level observations for Lake Simojärvi and discharge measurements at Hosionkoski rapids and the Simojoki outlet. Before the actual climate change was simulated, a run with the original input data was conducted and model output data were scaled to obtain a water balance. Then the corrected areal precipitation values were used in the actual climate change simulation by multiplying them with the predicted change for each season (Table 3).
Results
CATCHMENT RESPONSES TO ALTERED N DEPOSITION
The two northernmost catchments, Dalelva and Simojoki, are far from the main European N emission sources and, thus, receive low levels of N deposition (23 kg N ha yr1).
Nevertheless, the N deposition scenarios associated with the current legislation (CLE) and maximum feasible reduction (MFR) imply a further reduction of N deposition loads (Table 2). At Øygard, where the present N deposition is much higher (~17 kg N ha1 yr1), the CLE and MFR
scenarios will entail a substantial reduction in external N inputs.
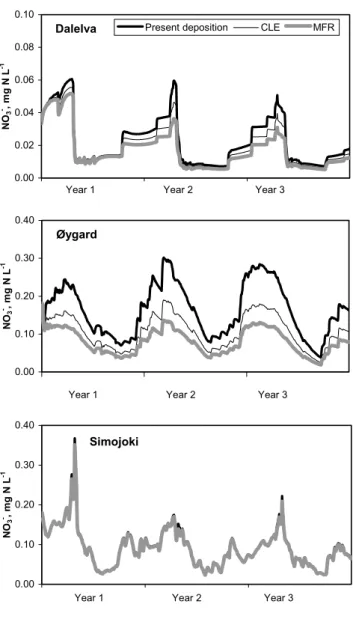
Given the N deposition scenarios, the INCA model indicated an overall reduction of streamwater NO3
concentrations at Øygard and Dalelva but not at Simojoki (Fig. 2). The reduction was most pronounced during the dormant season when NO3 concentrations usually peak due
to low plant demand for N. At Øygard, the NO3
concentrations during the dormant season were predicted to be reduced by 3040% under the CLE scenario and about
50% under the MFR scenario. During the growing season, when plant demand for N is high, the reduction in terms of absolute concentrations was somewhat less. At Dalelva, the change in NO3 concentration was minor and restricted
mainly to the dormant season. The CLE scenario gave reductions in annual fluxes of NO3 of approximately 35
and 15% at Øygard and Dalelva, respectively. The corresponding numbers for the MFR scenario were about 50 and 25%.
At Simojoki, the responses to N deposition scenarios have
been discussed by Rankinen et al. (2004). The changes in the N fluxes to the sea were minor. When atmospheric deposition was reduced under the CLE scenario, the annual NO3 flux decreased about 1% whereas the NH4+ flux did
not change at all. Reducing the atmospheric deposition under the MFR scenario decreased the NO3 flux about 3% and
the NH4+ flux less than 1%. The main reason for the slight
response at the Simojoki catchment is that N deposition is low compared to effective vegetation uptake by northern N limited forests (Table 3).
POTENTIAL IMPACTS OF CLIMATE CHANGE Hydrology
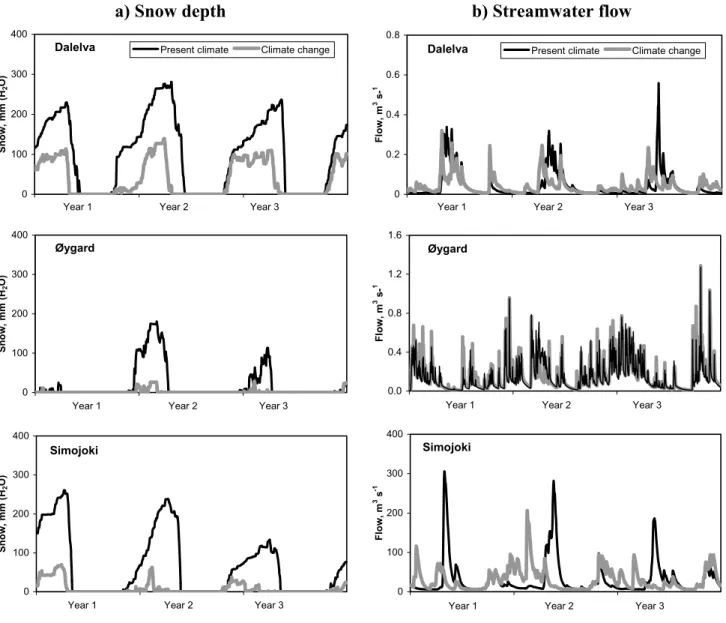
Given the climate change scenarios, the INCA model simulated rather dramatic changes in snow accumulation and subsequently also in the seasonal flow patterns at the study sites (Fig. 3a). The most pronounced changes are to be expected at the northernmost catchments, where the maximum snow depth during winter might decrease by 50 60% at Dalelva and as much as 7080% at Simojoki. The climate change scenario applied to Simojoki, however, implied a substantially higher increase in winter temperatures than that at Dalelva. At Øygard, the irregular snow accumulation characterising the present situation will become even more dominant under the climate change predicted.
Streamwater flow patterns, especially at Dalelva and Simojoki, would be heavily affected by the reduced snow accumulation and snowmelt might occur during the whole winter season. Additionally, the regular snowmelt flood will be less distinct and will be earlier in the spring. In many aspects, the hydrological patterns might show many similarities with the present situation at Øygard, where floods occur frequently at all seasons, and there is no distinct snowmelt flood (Fig. 3b). The flow pattern at Øygard may not change very much under a changed climate, but the flow peaks are expected to increase, especially in autumn.
The annual simulated water discharge does not necessarily reflect the annual increase in precipitation amounts, because evapotranspiration rates will increase as well, as a response to the predicted rise in air temperatures (Table 4). At Dalelva and Simojoki (high scenario), annual runoff might be slightly less because of the relatively large increase in temperature. Based on the low scenario at Simojoki, annual discharge would remain at the present level, while annual evaporation would increase by 11% under the low scenario and by 31% under the high scenario. At Øygard, the INCA model simulated a 10% increase in annual water discharge due to climate change by 2050.
Fig. 2. Predicted changes in daily NO3- concentrations at Dalelva,
Øygard and Simojoki in response to altered N deposition according to a) current legislation (CLE), and b) maximum feasible reduction (MFR) of N emissions. The simulations based on time series for the years 1993-95 (Dalelva and Øygard) and 1994-96 (Simojoki) modified to simulate the possible future changes given in Table 2. Note the different scales.
Øygard 0.00 0.10 0.20 0.30 0.40 1993 1994 1995 NO 3 -, m g N L -1
Year 1 Year 2 Year 3
Dalelva 0.00 0.02 0.04 0.06 0.08 0.10 1993 1994 1995 NO 3 -, m g N L -1
Present deposition CLE MFR
Year 1 Year 2 Year 3
Simojoki 0.00 0.10 0.20 0.30 0.40 1994 1995 1996 NO 3 -, m g N L -1
Fig. 3. Predicted changes in year 2050 in snow depth and streamwater flow following scenarios of climate change at the study sites. The
simulations based on time series for the years 1993-95 (Dalelva and Øygard) and 1994-96 (Simojoki) modified to simulate the possible future changes given in Table 3. The Simojoki application is based on the HadCM3-gg high scenario.
Table 4. Predicted changes in water discharge (three-year mean;
mm yr-1), given the climate change scenarios indicated in Table 3.
Present day is measured data from 1993-95 at Dalelva/Øygard and from 1994-1996 at Simojoki.
Present Future
(1993-96) (2050)
Dalelva 423 421
Øygard 1790 1978
Simojoki 315 317/3021
1 Low / high scenario
Land-phase and in-stream N transformation rates
N transformation rates, both within the terrestrial catchment and in the stream, are temperature dependent. In addition, the terrestrial processes will be dependent on soil moisture content. Hence, predicted climate change might have significant impacts on the internal N processing rates within the catchments. Table 5 (scenario A) shows the simulated response of terrestrial N process rates to the changes in air temperature and precipitation predicted in 2050. The most significant change simulated by the INCA model was an increase in N net mineralisation rates; these almost doubled at Dalelva and increased by about 20% at Øygard and Simojoki (high scenario). The increased N mineralisation
a) Snow depth
b) Streamwater flow
Øygard 0.0 0.4 0.8 1.2 1.6 1993 1994 1995 Fl ow , m 3 s-1
Year 1 Year 2 Year 3
Øygard 0 100 200 300 400 1993 1994 1995 Sn ow , mm ( H2 O)
Year 1 Year 2 Year 3
Dalelva 0 100 200 300 400 1993 1994 1995 Sn ow , m m ( H2 O)
Present climate Climate change
Year 1 Year 2 Year 3
Simojoki 0 100 200 300 400 1994 1995 1996 S now , mm (H 2 O)
Year 1 Year 2 Year 3
Dalelva 0 0.2 0.4 0.6 0.8 1993 1994 1995 Fl ow, m 3 s-1
Present climate Climate change
Year 1 Year 2 Year 3
Simojoki 0 100 200 300 400 1994 1995 1996 Flow , m 3 s -1
was largely balanced by increased immobilisation but, at Dalelva, the model predicted a small increase in nitrification, plant uptake and NO3 leaching. At Simojoki, vegetation
uptake, nitrification and denitrification increased, by 13%, 16% and 36%, respectively
Streamwater N concentrations and fluxes
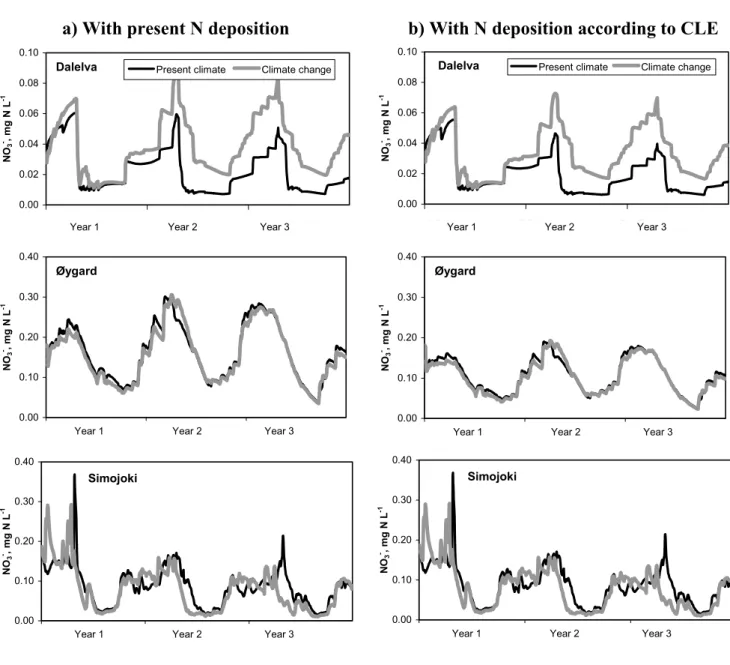
The largest relative change in streamwater NO3
concentrations was simulated at Dalelva (Fig. 4a). Here, the predicted peak concentrations in winter were 2060% higher, and the simulated summer concentrations 23 times higher. The latter indicates that the climate-induced increase in N mineralisation rates might exceed the sum of immobilisation and plant N demand during parts of the growing season. This, of course, depends strongly on the length of the growing season following a climate change and the actual temperature response of the N transformation processes involved. The predicted changes in NO3
concentrations and seasonal patterns were less clear at Øygard and Simojoki; future NO3 maxima and minima were
near the present levels but the timing was different. At Simojoki, the N-limited forest vegetation effectively takes up available nitrogen during the growing season.
At Dalelva, the annual NO3 export might increase 23
times in response to the scenario for climate change towards 2050 (Table 5). However, both the present and predicted NO3 fluxes (<0.1 kg N ha1 yr1) are negligible compared
to the present N losses at Øygard (3.5 kg N ha1 yr1). The
modest temperature increase predicted for the Øygard area did not imply any change in the simulated NO3 export. This
may indicate that N deposition is a more significant contributor to the catchment N pools than the small increase in N mineralisation caused by the altered climate. At Simojoki, increased mineralisation rates following climate change were mostly balanced by internal N retention processes and only a 6% increase in NH4+ export was
simulated.
COMBINED EFFECTS OF CHANGED CLIMATE AND N DEPOSITION
Finally, a combination of the climate scenario and the CLE N deposition scenario was used (Table 5; Fig. 4b). Both factors are expected to undergo changes during the next 50 years. Addition of the CLE scenario to the climate change scenario had minor effects on simulated land-phase and
in-Table 5. Predicted changes in N sources and sinks (three-year mean; kg N ha-1 yr-1) with different scenarios including climate and N deposition change. Present day is calibrated data from 1993-95 at Dalelva/Øygard and from 1994-1996 at Simojoki. Scenarios at Dalelva and Øygard: A changed climate and present N deposition; B changed climate and N deposition according to current legislation (CLE). Scenarios at Simojoki: Climate change; low and high. All scenarios are described in Table 2 and 3.
DALELVA ØYGARD SIMOJOKI
Present Scen.A Scen.B Present Scen.A Scen.B Present Low High
N SOURCES TIN deposition 2.7 2.7 2.3 16.9 16.9 13.2 2.3 2.3 2.3 Fertiliser input - - - 2.6 2.6 2.6 Net mineralisation1 3.6 6.9 6.9 15.0 18.2 18.2 26.7 28.6 31.5 N fixation - - - 0.30 0.30 0.31 Total 5.8 8.8 8.4 31.4 34.6 30.9 31.9 33.8 36.7 N SINKS Plant uptake 2.3 2.7 2.5 3.2 3.3 2.2 31.3 32.8 35.4 Denitrification 0.7 0.8 0.7 3.5 3.5 2.3 0.73 0.84 0.99 Immobilisation2 2.6 5.0 5.0 20.5 23.5 22.9 - - -NO3- export 0.06 0.17 0.15 3.5 3.5 2.3 0.41 0.40 0.41 NH4+ export 0.00 0.00 0.00 0.1 0.1 0.1 0.31 0.32 0.33 Total 5.7 8.7 8.4 30.8 33.9 29.8 32.8 34.4 37.1 Error in balance 0.6 0.9 0.8 1.1 1.2 1.6 -0.9 -0.6 -0.4 1Ammonification + nitrification
2Estimated differently at the Norwegian and Finnish study catchments (see details in Model calibration chapter). Finnish immobilisation estimates (gross
Fig. 4. Predicted changes in daily NO3- concentrations at Dalelva, Øygard and Simojoki under climate change: (A) With present N deposition;
(B) With N deposition according to current legislation (CLE). The scenarios for altered N deposition and climate are described in Tables 2 and 3. The Simojoki application is based on the HadCM3-gg high scenario.
stream N transformation rates at Dalelva and Simojoki but significant effects at Øygard where N deposition is an important N source under present conditions (Table 5). Here, the model simulations suggested that reduced N deposition (according to the CLE scenario) will offset the climatic effects, such that future NO3 leaching might decrease below
the present levels. The simulation of streamwater NO3
concentrations under such conditions suggested lower concentrations all year round, but most pronounced during the dormant season (Fig. 4b).
Discussion and conclusions
Over the next few decades, large-scale changes in climate and N deposition levels may entail significant changes in the N cycle of many terrestrial and aquatic ecosystems (e.g. Vitousek et al., 1997; Schindler, 2001). If the recent agreements to control N emissions (the Gothenburg Protocol and the NEC directive) are fulfilled, there will be substantial reductions of potentially harmful N deposition over large parts of Europe. There is presently a relatively large scatter in climate scenarios produced by various global climate models (Allen et al., 2000), but most model predictions for
a) With present N deposition
b) With N deposition according to CLE
Øygard 0.00 0.10 0.20 0.30 0.40 1993 1994 1995 NO 3 -, mg N L -1
Year 1 Year 2 Year 3
Øygard 0.00 0.10 0.20 0.30 0.40 1993 1994 1995 NO 3 -, mg N L -1
Year 1 Year 2 Year 3
Dalelva 0.00 0.02 0.04 0.06 0.08 0.10 1993 1994 1995 NO 3 -, mg N L -1
Present climate Climate change
Year 1 Year 2 Year 3
Dalelva 0.00 0.02 0.04 0.06 0.08 0.10 1993 1994 1995 NO 3 -, mg N L -1
Present climate Climate change
Year 1 Year 2 Year 3
Simojoki 0.00 0.10 0.20 0.30 0.40 1994 1995 1996 NO 3 -, mg N L -1
Year 1 Year 2 Year 3
Simojoki 0.00 0.10 0.20 0.30 0.40 1994 1995 1996 NO 3 -, mg N L -1
northern Europe imply significant increases in air temperatures and precipitation over the next 50100 years (Benestad, 2002).
The combined effects of climate change and altered N deposition on N cycling and losses in terrestrial and aquatic ecosystems are difficult to predict. Both long-term water chemistry records and catchment-scale experiments indicate that reduction of N inputs from deposition results almost immediately in reduced concentrations of NO3 in runoff
(Wright et al., 1993; Kopácek et al., 1998; Tietema et al., 1998). On the other hand, a future climate change may cause increased NO3 production from mineralisation of soil
organic matter and, thus, offset decreases in N leaching obtained by decreased N deposition (Nadelhoffer et al., 1992; Kirschbaum, 1995; Stottlemyer and Toczydlowski 1999a,b). Process-oriented catchment models are useful in assessing the possible impacts of these two driving forces in combination. The reliability of model outputs, however, depends strongly on the parameterisation of key N transformation processes and on their responses to altered temperature and soil moisture contents. Here, catchment-scale experiments and long-term data sets provide important constraints for the modelling of the whole-ecosystem response.
Under future climate change scenarios for the Norwegian and Finnish study catchments, the INCA model predicts markedly reduced snow accumulation over the next 50 years, both in terms of duration and quantity (Fig. 3a). Moreover, the occurrence of winter rainfall and melting periods will be more frequent. Thus, several small floods may well replace the large snowmelt flood occurring regularly in late spring. These predictions are in accordance with other model simulations (Hessen and Wright, 1993; Lepistö and Kivinen, 1997) and also with observations from long-term records (e.g. Reihan, 2002). In summer, increased air temperature will lead to higher evapotranspiration rates. At Simojoki and Dalelva, an increase in soil moisture deficit and a decrease in streamwater flow (mean; 32% and 56%, respectively) will occur from June to August. At Øygard, the predicted increase in summer precipitation outweighs the effects from increased evapotranspiration.
The predicted changes in snow accumulation and annual flow patterns have several implications for N cycling and losses in the study catchments. Paradoxically, increased air temperatures following global warming can lead to colder soils because of reduced snow cover in winter (e.g. Groffman
et al., 2001). This effect will probably be most pronounced
in the northernmost catchments, Simojoki and Dalelva, currently characterised by long and stable winters. In an experiment conducted in a temperate deciduous forest at Hubbard Brook, USA, Groffman et al. (2001) found that
snow removal promoted soil freezing which in turn led to significant increases in root mortality, soil NO3
concentrations and hydrological fluxes of carbon, nitrogen and phosphorus. This general pattern is also observed in long-term records, where high NO3 concentrations and
drainage losses have been observed following anomalously cold periods in winter (Mitchell et al., 1996; Monteith et
al., 2000; Kaste and Skjelkvåle, 2002). Another effect of a
more irregular snow cover in the future is more frequent freezing and thawing cycles that might affect N transformation processes during winter. Several studies have indicated very high, episodic rates of mineralisation, nitrification and denitrification associated with such periods (e.g. Goodroad and Keeney, 1984; Ryan et al., 2000).
These mechanisms are difficult to simulate within INCA, because the responses of each N process included in the model are positively correlated with temperature, whereas direct freezing effects on soils and episodic N transformations during freezingthawing cycles are not accounted for. Therefore, the simulated NO3 leaching by
the model will depend on the pre-set temperature response of each individual process and the hydrology that drives N through the various compartments of the system. Field measurements and isotope studies in seasonally snow-covered alpine catchments indicate that N is accumulated in the soil water during the dormant season, and is then flushed during an early phase of the snowmelt flood (Arheimer et al., 1996; Williams et al., 1998; Campbell et
al., 2002). This suggests that N production (N deposition,
mineralisation) dominates over N retention (denitrification, uptake, immobilisation) during this season, and that hydrology to a large extent controls the magnitude of NO3
leaching from these ecosystems.
Besides the effects on the hydrological regime, the predicted temperature increase will affect several aspects of N production, uptake and mobility in catchments. Most N transformation processes are temperature and moisture dependent and increased temperatures in all instances lead to higher process rates. There are, however, indications that the various processes have different temperature responses (Q10 values; i.e. the factor change in rate following a
10-degree change in temperature) along the temperature gradient. In a review of several laboratory-based experiments, Kirschbaum (1995) found that the temperature sensitivity of decomposition relative to net primary productivity was much greater at low soil temperatures. Along a temperature gradient of 01020 oC, the Q
10 value
of decomposition decreased from nearly 8 to 4.5 and 2.5, respectively. Hence, the sensitivity of decomposition around 20 oC was more similar to that of net primary production.
decomposers near 0 oC has important implications for the
effects of climate change on N mineralisation and losses in northern catchments.
A catchment-scale experiment, CLIMEX, performed at Risdalsheia in southernmost Norway, demonstrated that a three-year increase in CO2 level and temperature (25 oC
above ambient) in an enclosed forested catchment increased the inorganic N leaching by a factor of three (Wright, 1998). This was explained by increased decomposition of soil organic matter and mineralisation of organic nitrogen to inorganic species (Van Breemen et al., 1998; Verburg and Van Breemen, 2000). These results suggest that N mineralisation and nitrification may have a more pronounced response to a 25 oC increase in temperature than e.g. N
uptake, denitrification or N immobilisation. The temperature response (Q10) of N mineralisation was about 3, which is
within the range reported by Kirschbaum (1995). Examination of long-term records has also revealed a strong temperature control on the leaching of inorganic N. Warm and dry summers can generate high NO3 peak discharges,
especially when followed by a hydrological flushing period (Reynolds et al., 1992; Murdoch et al., 1998; Van Miegroet
et al., 2001).
Both laboratory and large-scale experiments, thus, suggest that decomposition and N mineralisation respond more quickly to a temperature increase than the corresponding N retention processes, at least during an initial phase of the warming process. In the recently adapted version of the INCA model used here (Rankinen et al., 2004), it is possible to apply individual temperature response functions (Q10
values) to different land cover classes, but not to individual N transformation processes. This option is included in a recently developed (but not yet implemented) test version of INCA. Still, the dynamic temperature response suggested by Kirschbaum (1995) will be difficult to simulate, because each temperature response function is based on a fixed Q10
value along the entire temperature gradient. Further, there will always be a high degree of uncertainty associated with the temperature response of various N processes (especially N immobilisation) on a catchment scale.
According to the INCA simulated climate change scenarios, the largest changes are expected in the northernmost catchment, Dalelva. Here, the predicted temperature increase might involve a doubling of the mineralisation rate (from 3.6 to 6.9 kg N ha1 yr1), which
may greatly increase the availability of inorganic nitrogen in the soils (Table 5). This is more than twice the level of the present atmospheric deposition in this region. According to the model simulation, the increased N supply will be balanced largely by increased plant uptake (longer growing season, increased growth rates) and immobilisation.
However, small increases in denitrification and NO3
leaching rates are also predicted. Compared to the low initial NO3 leaching level, the NO3 export rates might increase
by a factor of nearly three. At the Simojoki and Øygard catchments, the relative increase in mineralisation rates due to climate change were less pronounced (approximately 20%). Here, the increased N availability was to a large extent balanced by internal N sinks in the model. No increases in NO3 leaching were predicted, and only a slight increase
(6%) in NH4+ leaching at Simojoki. However, these
relationships between climate-induced N production and subsequent N retention depend strongly on anticipated temperature response functions for the processes involved. Given a slower or ineffective response from one of the N sink processes, as demonstrated for example in the CLIMEX project (Van Breemen et al., 1998, Wright, 1998), a larger fraction of the extra N mobilised by mineralisation might be exported to freshwaters and, thus, to marine coastal waters. Here, catchments enriched with N from several decades with elevated N deposition (e.g. the Øygard catchment) seem to be more susceptible to climate-induced N leaching than N limited ecosystems such as Simojoki and Dalelva (Wright et al., 1998).
A large fraction of the increased NO3 export following
climate change is expected to take place during the dormant season when plant demands for N are low (Fig. 4a). In addition, NO3 peaks might occur earlier in spring, as
indicated for the Simojoki River. In the Dalelva Brook, slightly elevated NO3 concentrations were also predicted
during the growing season. At present, both Dalelva Brook and Simojoki River can be classified as N-limited (stage 0 of Stoddards classification; Stoddard, 1994), whereas the Øygard catchment falls between stage 1 and 2, which denotes an N-saturated system with moderate to high annual losses (Stoddard, 1994; Kaste and Skjelkvåle, 2002). If N emissions are reduced in accordance with the current legislation, this will have a major effect on streamwater NO3
concentrations at the Øygard catchment, even in combination with future climate change (Fig. 4). As such, significant improvements with respect to streamwater acidity and coastal N input might be expected within this region following this N reduction scenario. At the more remote Dalelva and Simojoki catchments, the expected N deposition reductions will be small compared to the internal N recycling processes and climate change might to a large extent offset the effects of reduced N deposition.
Several factors will determine the N status of the study catchments in the next 50 years. In addition to the possible short-term effects from climate and deposition change discussed above, the long-term effects might be even more important (e.g. N accumulation v. storage capacity; size of
N pools available for mineralisation, retention processes). Besides transient climate scenarios, a simulation of such long-term climate change effects requires more research and model development, because INCA in its present state lacks a dynamic soil organic pool resulting from the long-term balance between N accumulation and release processes.
Acknowledgements
This work was financed in part by the The European Commission (INCA Project EVK1-1999-00011). The Norwegian part of this work has been supported by the Research Council of Norway (NFR) and the Norwegian Institute for Water Research (NIVA) through the research project N retention and acidification in mountains and
heathlands and the strategic institute programme Impacts of climate change on surface waters and fjords. Chemical
data were collected as part of the Nitrogen from Mountains
to Fjord programme (funded by NFR and NIVA) and the Norwegian monitoring programme for long-range transported air pollutants (funded by the Norwegian
Pollution Control Authority [SFT]). The Finnish part has been supported by the Finnish Environment Institute (SYKE). Dr Bertel Vehviläinen and Mr Kalle Sippel are thanked for providing the hydrological model runs (WSFS) and scenarios and Dr Richard F. Wright for useful comments on the manuscript.
References
Allen, M.R., Stott, P.A., Mitchell, J.F.B., Schnur, R. and Delworth, T.L., 2000. Quantifying the uncertainty in forecasts of anthropogenic climate change. Nature, 407, 617620. Arheimer, B., Andersson, L. and Lepistö, A., 1996. Variation of
nitrogen concentration in forest streams - influences of flow, seasonality and catchment characteristics. J. Hydrol., 179, 281 304.
Benestad, R.E., 2002. Empirically downscaled temperature scenarios for northern Europe based on a multi-model ensemble.
Climate Res., 21, 105125.
Bergström, S., 1976. Development and application of a conceptual
runoff model for Scandinavian catchments, Swedish
Meteorological and Hydrological Institute (SMHI), Report no. RH7, Norrköping, Sweden.
Bull, K.R., Achermann, B., Bashkin, V., Chrast, R., Fenech, G., Forsius, M., Gregor, H.D., Guardans, R., Haussmann, T., Hayes, F., Hettelingh, J.P., Johannessen, T., Krzyzanowski, M., Kucera, V., Kvaeven, B., Lorenz, M., Lundin, L., Mills, G., Posch, M., Skjelkvåle, B.L. and Ulstein, M.J., 2001. Coordinated effects monitoring and modelling for developing and supporting international air pollution control agreements. Water Air Soil
Pollut., 130, 119130.
Campbell, D.H., Kendall, C., Chang, C.C.Y., Silva, S.R. and Tonnessen, K.A. 2002. Pathways for nitrate release from an
alpine watershed: Determination using d15N and d18O. Water
Resour. Res., 38, 10/110/9.
Carter, T.R., Posch, M. and Tuomenvirta, H., 1996. The SILMU scenarios: specifying Finlands future climate for use in impact assessment. Geophysica 32, 235260.
Christensen, J.H., Räisänen, J., Iversen, T., Bjørge, D., Christensen, O.B. and Rummukainen, M., 2001. A synthesis of regional climate change simulations. Geophys. Res. Lett., 28, 10031006. Drebs, A., Nordlund, A., Karlsson, P., Helminen, J. and Rissanen, P., 2002. Climatological statistics of Finland 1971-2000. Finnish Meteorological Institute, Climatic statistics of Finland No. 2002:1, Helsinki. 99pp.
FINSKEN, 2003. FINSKEN-project. Developing consistent global
change scenarios for Finland. http://www.ymparisto.fi/eng/
research/projects/finsken/
Førland, E.J., Benestad, R.E., Hanssen-Bauer, I., Iden, K.A. and Tveito, O.E., 2000. Local Climate Scenarios for Norway based
on empirical downscaling, RegClim Project, General Technical
Report No. 5, the Norwegian Meteorological Institute (met.no), Oslo, Norway. 1328.
Goodroad, L.L. and Keeney, D.R., 1984. Nitrous oxide emissions from soils during thawing. Can. J. Soil Sci., 64, 187194. Groffman, P.M., Driscoll, C.T., Fahey, T.J., Hardy, J.P., Fitzhugh,
R.D. and Tierney, G.L., 2001. Colder soils in a warmer world: A snow manipulation study in a northern hardwood forest ecosystem. Biogeochemistry, 56, 135150.
Hanssen-Bauer, I., 1999. Downscaling of temperature and
precipitation in Norway based upon multiple regression analyses of the principal components of the SLP field. KLIMA report
21/99, the Norwegian Meteorological Institute (met.no), Oslo, Norway. 40pp.
Haugen, J.E. and Ødegaard, V., 2003. Evaluation of MPI and
Hadley simulations with HIRHAM and sensitivity to integration domains. RegClim report GTR 7, the Norwegian Meteorological
Institute (met.no), Oslo, Norway. 1929.
Hessen, D.O. and Wright, R.F., 1993. Climatic effects on freshwaters; model predictions on acidification, nutrient loading and eutrophication. In: Impact of climatic change on natural
ecosystems with emphasis on boreal and arctic/alpine areas,
W. Oechel, J. Holten and G. Paulsen (Eds.). Norwegian Institute for Nature Research (NINA) and the Directorate for Nature Management (DN), Trondheim, Norway. 154167.
Kangas, L. and Syri, S., 2002. Regional nitrogen deposition model for integrated assessment of acidification and eutrophication.
Atmos. Environ., 36, 11111122.
Kaste, Ø., 2004. Simulation of nitrogen dynamics and losses in an arctic brook and a boreal river system in Norway by applying the Integrated Nitrogen model for CAtchments (INCA). Water
Air Soil Pollut.:Focus, 4, 8696.
Kaste, Ø. and Skjelkvåle, B.L., 2002. Nitrogen dynamics in runoff from two small heathland catchments representing opposite extremes with respect to climate and N deposition in Norway.
Hydrol. Earth Syst. Sci., 6, 351362.
Kirschbaum, M.U.F., 1995. The temperature dependence of soil organic matter decomposition, and the effect of global warming on soil organic C storage. Soil Biol. Biochem., 27, 753760. Kopácek, J., Hejzlar, J., Stuchlík, E., Fott, J. and Veselý, J., 1998.
Reversibility of acidification of mountain lakes after reduction in nitrogen and sulphur emissions in Central Europe. Limnol.
Oceanogr., 43, 357361.
Kuusisto, E., Kauppi, L. and Heikinheimo, P., 1996. Climate
change and Finland [in Finnish]. Helsinki University Press,
Finland. 265pp.
Lepistö, A. and Kivinen, Y., 1997. Effects of climatic change on hydrological patterns of a forested catchment: a physically based modeling approach. Boreal Envir. Res., 2, 1931.
Lepistö, A., Granlund, K. and Rankinen, K., 2004. Integrated nitrogen modelling in a boreal forestry dominated river basin:N fluxes and retention in lakes and peatlands, Water Air Soil
Pollut.:Focus, 4, 113-123.
Met.no 2001. Daily precipitation volumes and snow depths at the
monitoring stations Lanabukt and Helleland; Daily mean temperatures at the monitoring stations Kirkenes, Ualand, and Eik-Hove, the Norwegian Meteorological Institute (met.no),
Oslo, Norway.
Mitchell, M.J., Driscoll, C.T., Kahl, J.S., Likens, G.E., Murdoch, P.S. and Pardo, L.H., 1996. Climatic control of nitrate loss from forested watersheds in the northeast United States. Environ. Sci.
Technol., 30, 26092612.
Monteith, D.T., Evans, C.D. and Reynolds, B., 2000. Are temporal variations in the nitrate content of UK upland freshwaters linked to the North Atlantic Oscillation? Hydrol. Process., 14, 1745 1749.
Murdoch, P.S., Burns, D.A. and Lawrence, G.B., 1998. Relation of climate change to the acidification of surface waters by nitrogen deposition. Environ. Sci. Technol., 32, 16421647. Nadelhoffer, K.J., Giblin, A.E., Shaver, G.R. and Linkins, A.E.,
1992. Microbial processes and plant nutrient availability in arctic soils. In: Arctic ecosystems in a changing climate an
ecophysiological perspective, F.S. Chapin III, R.L. Jeffries, J.F.
Reynolds, G.R. Shaver, and J. Svoboda (Eds.). San Diego, Academic Press, USA. 281300.
Palmer, T.N. and Räisänen, J., 2002. Quantifying the risk of extreme seasonal precipitation events in a changing climate.
Nature, 415, 512514.
Perkkiö, S., Huttula E. and Nenonen, M., 1995. Water protection
plan for the Simojoki river basin [in Finnish]. Publ. Water and
Environment Administration - series A 200. Finland. 102pp. Rankinen, K., Lepistö, A. and Granlund, K., 2002. Hydrological
application of the INCA model with varying spatial resolution and nitrogen dynamics in a northern river basin. Hydrol. Earth
Syst. Sci., 6, 339350.
Rankinen, K., Lepistö, A. and Granlund, K., 2004. Integrated nitrogen and flow modelling (INCA) in a boreal river basin dominated by forestry: scenarios of environmental change,
Water Air Soil Pollut.:Focus, 4, 161174.
Reihan, A., 2002. Long-term water discharge analysis in Estonia. In: XXII Nordic Hydrological Conference, Röros, Norway, 4-7
August 2002, Å. Killingtveit (Ed.). Nordic Hydrological
Programme (NHP), Report no. 47. 597603.
Reynolds, B., Emmett, B.A. and Woods, C., 1992. Variations in streamwater nitrate concentrations and nitrogen budgets over 10 years in a headwater catchment in mid-Wales. J. Hydrol., 136, 155175.
Roeckner, E., Bengtsson, L., Feichter, J., Lelieveld, and Rodhe, H., 1999. Transient climate change simulations with a coupled
atmosphere-ocean GCM including the trophospheric sulphur cycle. Report no. 266, Max-Planck-Institut für Meteorologie,
Hamburg, Germany.
Ryan, M.C., Kachanoski, R.G. and Gillham, R.W., 2000. Overwinter soil nitrogen dynamics in seasonally frozen soils.
Can. J. Soil Sci., 80, 541550.
Schindler, D.W., 2001. The cumulative effects of climatic warming and other human stresses on Canadian freshwaters in the new millenium. Can. J. Fisheries Aquat. Sci., 58, 1829.
Schöpp, W., Posch, M., Mylona, S. and Johansson, M., 2003. Long-term development of acid deposition (1880-2030) in sensitive freshwater regions in Europe. Hydrol. Earth Syst. Sci., 7, 436446.
Skeffington, R. 2002. European nitrogen policies, nitrate in rivers and the use of the INCA model. Hydrol. Earth Syst. Sci., 6, 315324.
Stoddard, J.L., 1994. Long term changes in watershed retention of nitrogen. Its causes and aquatic consequences. In:
Environmental chemistry of lakes and reservoirs, L.A. Baker
(Ed.). Advances in Chemistry Series no. 237, American Chemical Society, Washington DC, USA. 223284.
Stottlemyer, R. and Toczydlowski, D., 1999a. Nitrogen mineralization in a mature boreal forest, Isle Royale, Michigan.
J. Environ. Qual., 28, 709720.
Stottlemyer, R. and Toczydlowski, D., 1999b. Seasonal Relationships Between Precipitation, Forest Floor, and Streamwater Nitrogen, Isle Royale, Michigan. Soil Sci. Soc.
Amer. J., 63, 389398.
Tietema, A., Boxman, A.W., Bredemeier, M., Emmett, B.A., Moldan, F., Gundersen, P., Schleppi, P. and Wright, R.F., 1998. Nitrogen saturation experiments (NITREX) in coniferous forest ecosystems in Europe: A summary of results. Environ. Pollut., 102, 433437.
Tørseth, K. and Semb, A., 1998. Deposition of nitrogen and other major inorganic compounds in Norway, 1992-1996. Environ.
Pollut., 102, 299304.
UN/ECE, 2000. Protocol to the 1979 Convention on Long-range
Transboundary Air Pollution to Abate Acidification, Eutrophication and Ground-level Ozone, ECE/EB.AIR/72,
United Nations, New York and Geneva. 219pp.
Van Breemen, N., Jenkins, A., Wright, R. F., Arp, W. J., Beerling, D. J., Berendse, F., Beier, C., Collins, R., van Dam, D., Rasmussen, L., Verburg, P. S. J. and Wills, M. A., 1998. Impacts of elevated carbon dioxide and temperature on a boreal forest ecosystem (CLIMEX project). Ecosystems, 1, 345351. Van Miegroet, H., Creed, I.F., Nicholas, N.S., Tarboton, D.G.,
Webster, K.L. Shubzda, J., Robinson, B., Smoot, J., Johnson, D.W., Lindberg, S.E., Lovett, G.M., Nodvin, S. and Moore, S., 2001. Is there synchronicity in nitrogen input and output fluxes at the Noland Divide watershed, a small N-saturated forested catchment in the Great Smoky Mountains National Park? In: Optimizing Nitrogen Management in Food and Energy Production and Environmental Protection: Proceedings of the
2nd International Conference on Science and Policy. The
Scientific World, 1(S2), 480492.
Vehviläinen, B., 1992. Snow cover models in operational
watershed forecasting. Doctoral Thesis, National Board of
Waters and the Environment, Helsinki, Finland. 112pp. Verburg, P.S.J. and Van Breemen, N., 2000. Nitrogen
transformations in a forested catchment in southern Norway
subjected to elevated temperature and CO2. For. Ecol. Manage.,
129, 3139.
Vitousek, P.M., Aber, J.D., Howarth, R.W., Likens, G.E., Matson, P.A., Schindler, D.W., Schlesinger, W.H. and Tilman, D.G., 1997. Human alteration of the global nitrogen cycle: Sources and consequences. Ecol. Appl., 7, 737750.
Vuorela, A., 1997. Satellite image based land cover and forest classification of Finland. In: Proc. Finnish-Russian Seminar
on Remote Sensing, Helsinki, Finland, 29 August-1 September 1994, R. Kuittinen (Ed.). Reports of the Finnish Geodetic
Institute 97 2, 4252.
Wade, A.J., Durand, P., Beaujouan, V., Wessel, W.W., Raat, K.J., Whitehead, P.G., Butterfield, D., Rankinen, K. and Lepistö, A., 2002. A nitrogen model for European catchments: INCA, new model structure and equations. Hydrol. Earth Syst. Sci., 6, 559
582. (Seelso Errata. Hydrol. Earth Syst. Sci., 8,858859.)
Whitehead, P.G., Wilson, E.J. and Butterfield, D., 1998. A semi-distributed Integrated Nitrogen model for multiple source assessment in Catchments (INCA): Part I model structure and process equations. Sci. Total Envir., 210/211, 547558.
Williams, M.W., Brooks, P.D. and Seastedt, T., 1998. Nitrogen and carbon soil dynamics in response to climate change in a high-elevation ecosystem in the Rocky Mountains, USA. Arctic
Alp. Res., 30, 2630.
Wright, R.F., 1998. Effect of increased carbon dioxide and temperature on runoff chemistry at a forested catchment in southern Norway (CLIMEX Project). Ecosystems, 1, 216225. Wright, R.F. and Schindler, D.W., 1995. Interaction of acid rain and global changes: Effects on terrestrial and aquatic ecosystems. Water Air Soil Pollut., 85, 8999.
Wright, R.F. and Traaen, T.S., 1992. Dalelva, Finnmark,
northernmost Norway: prediction of future acidification using the MAGIC model. Report 2728, Norwegian Institute for Water
Research, Oslo, Norway. 17pp.
Wright, R.F., Beier, C. and Cosby, B.J., 1998. Effects of nitrogen deposition and climate change on nitrogen runoff at Norwegian boreal forest catchments: the MERLIN model applied to Risdalsheia (RAIN and CLIMEX projects). Hydrol. Earth Syst.
Sci., 2, 399414.
Wright, R.F., Lotse, E., and Smith, A., 1993. RAIN project: results after 8 years of experimentally reduced acid deposition to a whole catchment. Can. J. Fisheries Aquat. Sci., 50, 258268.