HAL Id: hal-00299432
https://hal.archives-ouvertes.fr/hal-00299432
Submitted on 7 Jun 2007
HAL is a multi-disciplinary open access
archive for the deposit and dissemination of
sci-entific research documents, whether they are
pub-lished or not. The documents may come from
teaching and research institutions in France or
abroad, or from public or private research centers.
L’archive ouverte pluridisciplinaire HAL, est
destinée au dépôt et à la diffusion de documents
scientifiques de niveau recherche, publiés ou non,
émanant des établissements d’enseignement et de
recherche français ou étrangers, des laboratoires
publics ou privés.
M. Zappa, C. Kan
To cite this version:
M. Zappa, C. Kan. Extreme heat and runoff extremes in the Swiss Alps. Natural Hazards and Earth
System Science, Copernicus Publications on behalf of the European Geosciences Union, 2007, 7 (3),
pp.375-389. �hal-00299432�
Extreme heat and runoff extremes in the Swiss Alps
M. Zappa1and C. Kan2
1Swiss Federal Research Institute WSL, Birmensdorf, Switzerland 2Swiss Federal Office for the Environment FOEN, Berne, Switzerland
Received: 13 December 2006 – Revised: 14 May 2007 – Accepted: 23 May 2007 – Published: 7 June 2007
Abstract. The hydrological response of Swiss river basins to the 2003 European summer heatwave was evaluated by a combined analysis of historical discharge records and spe-cific applications of distributed hydrological modeling. In the summer of 2003, the discharge from headwater streams of the Swiss Central Plateau was only 40%–60% of the long-term average. For alpine basins runoff was about 60%–80% of the average. Glacierized basins showed the opposite be-havior. According to the degree of glacierization, the average summer runoff was close or even above average. The hydro-logical model PREVAH was applied for the period 1982– 2005. Even if the model was not calibrated for such extreme meteorological conditions, it was well able to simulate the hydrological responses of three basins. The aridity index φ describes feedbacks between hydrological and meteorologi-cal anomalies, and was adopted as an indicator of hydrologi-cal drought. The anomalies of φ and temperature in the sum-mer of 2003 exceeded the 1982–2005 mean by more than 2 standard deviations. Catchments without glaciers showed negative correlations between φ and discharge R. In basins with about 15% glacierization, φ and R were not correlated. River basins with higher glacier percentages showed a po-sitive correlation between φ and R. Icemelt was popo-sitively correlated with φ and reduced the variability of discharge with larger amounts of meltwater. Runoff generation from the non-glaciated sub-areas was limited by high evapotrans-piration and reduced precipitation. The 2003 summer heat-wave could be a precursor to similar events in the near future. Hydrological models and further data analysis will allow the identification of the most sensitive regions where heatwaves may become a recurrent natural hazard with large environ-mental, social and economical impacts.
Correspondence to: M. Zappa
1 Introduction
The 2003 summer was the hottest recorded summer in cen-tral Europe since the existence of instrumented observations (Sch¨ar et al., 2004). From Rome to London, thermometers climbed above historical highs, forced by persistent anticy-clonic conditions (Black et al., 2004). Studies relying on the reconstruction of time series suggest that it is rather un-likely that comparable events affecting Europe ever occurred since the 16th century (Luterbacher et al., 2004). The unique-ness of this event has been confirmed by the analysis of data from different sources, such as excessive deaths (Conti et al., 2005; Grize et al., 2005), phenological records (Menzel, 2005; Gehrig, 2006), permafrost (Gruber et al., 2004) and productivity rates (Ciais et al., 2005).
From a statistical point of view, the 2003 European sum-mer heatwave (“2003 heatwave” hereafter) has to be conside-red an extremely unlikely event. The temperature anomaly of +5.1◦K for the period from June to August, as determined by Sch¨ar et al. (2004) on the basis of a long-term homogenized time series from four Swiss stations (Begert et al., 2005), ex-ceeded by far the temperature anomaly of +2.7◦K recorded during the second warmest summer in 1947. The effects of the 2003 heatwave were also amplified by concomitant low precipitation amounts (Black et al., 2004; BUWAL et al., 2004).
A large community of scientists believes and predicts that this event is a forerunner of similar events in the years to come, as a result of global climate warming and increased variability in temperature and precipitation (Beniston, 2004; Frei and Sch¨ar, 2001).
The coincidence of unusually warm and dry weather caused by the particular atmospheric circulation in this case is highly interesting from the hydrometeorological point of view. The conditions observed during the summer of 2003 agree with the climate change projections for Central Eu-rope for summers in the second half of the 21st century
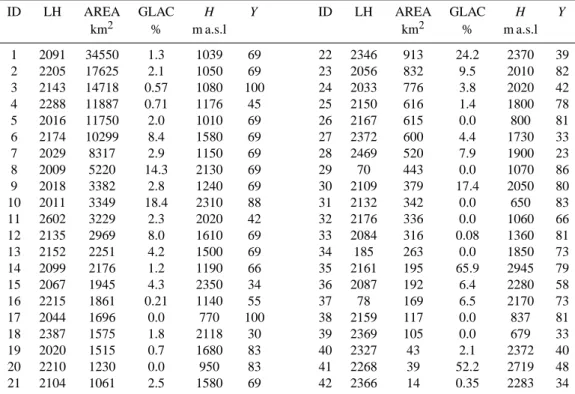
Table 1. Selected characteristics for the analysed 42 streamflow gauges of the Swiss FOEN.
ID LH AREA GLAC H Y ID LH AREA GLAC H Y
km2 % m a.s.l km2 % m a.s.l 1 2091 34550 1.3 1039 69 22 2346 913 24.2 2370 39 2 2205 17625 2.1 1050 69 23 2056 832 9.5 2010 82 3 2143 14718 0.57 1080 100 24 2033 776 3.8 2020 42 4 2288 11887 0.71 1176 45 25 2150 616 1.4 1800 78 5 2016 11750 2.0 1010 69 26 2167 615 0.0 800 81 6 2174 10299 8.4 1580 69 27 2372 600 4.4 1730 33 7 2029 8317 2.9 1150 69 28 2469 520 7.9 1900 23 8 2009 5220 14.3 2130 69 29 70 443 0.0 1070 86 9 2018 3382 2.8 1240 69 30 2109 379 17.4 2050 80 10 2011 3349 18.4 2310 88 31 2132 342 0.0 650 83 11 2602 3229 2.3 2020 42 32 2176 336 0.0 1060 66 12 2135 2969 8.0 1610 69 33 2084 316 0.08 1360 81 13 2152 2251 4.2 1500 69 34 185 263 0.0 1850 73 14 2099 2176 1.2 1190 66 35 2161 195 65.9 2945 79 15 2067 1945 4.3 2350 34 36 2087 192 6.4 2280 58 16 2215 1861 0.21 1140 55 37 78 169 6.5 2170 73 17 2044 1696 0.0 770 100 38 2159 117 0.0 837 81 18 2387 1575 1.8 2118 30 39 2369 105 0.0 679 33 19 2020 1515 0.7 1680 83 40 2327 43 2.1 2372 40 20 2210 1230 0.0 950 83 41 2268 39 52.2 2719 48 21 2104 1061 2.5 1580 69 42 2366 14 0.35 2283 34
ID = Label in Fig. 1; LH = Identifier for the FOEN database (FOEN, 2004); AREA = catchment area; GLAC = glacierization; H = Average elevation of the basin; Y = length in years of the historical time series by 2003.
(IPCC, 2001). In contrast to the high uncertainty of the cli-mate projections (Jasper et al., 2004; Horton et al., 2006), the 2003 heatwave was monitored and high quality observed time series of meteorological conditions and, especially, of the actual response of hydrological systems are available. Thus, this well documented extreme event is a valuable con-trol event to evaluate if current hydrological models (Beven, 2001), are actually able to provide reliable projections on hy-drological impacts of climate change when forced by time se-ries modified by climate scenarios (e.g. Kleinn et al., 2004; Wang et al., 2006). Furthermore, this event represents a unique chance to estimate the reliability of hydrological models outside of calibration conditions (Seibert, 2003).
Other questions arise about the varied hydrological im-pacts of summer heatwaves, especially in very sensitive en-vironments like mountainous regions in central Europe (Hu-ber et al., 2005; Viviroli and Weingartner, 2004). The Swiss Federal Office for the Environment FOEN recorded runoff extremes at several streamflow gauges of its network during 2003 (FOEN, 2004). Two antithetic behaviours were identi-fied: a) extreme low-flows in mesoscale rivers of the Swiss Plateau, and b) extremely high runoff in highly glacierized headwater basins.
The consequences of such anomalous conditions on water resources management and the environment are numerous: shortage in freshwater supply for population and irrigation,
enhanced demand of electricity supply for cooling purposes, impediments in the transportation of goods by navigation (low water levels in large downstream rivers), and starving of fish as a result of warm stream temperatures are only a se-lection of potential hazards triggered by an event such as the 2003 heatwave (BUWAL et al., 2004).
This study focuses on the response of Swiss rivers to the 2003 heatwave by combining an analysis of discharge records with specific applications of distributed hydrologi-cal modelling. Data from 42 streamflow gauges are used to quantify the regional discharge anomalies. The spatially distributed hydrological model PREVAH (Gurtz et al., 2003; Zappa, 2002) is then applied to three basins for in order to analyze the mechanisms triggering the different regional im-pacts.
The following main topics are discussed hereafter: a) lo-cal and regional characterization of the 2003 flow rates in Switzerland with respect to historical data; b) analysis of the impacts of the 2003 heatwave by means of distributed hy-drological modeling; c) quantification of the contribution of icemelt to total discharge; and d) evaluation of the hydrolog-ical model’s capability to cope with unprecedented climate conditions.
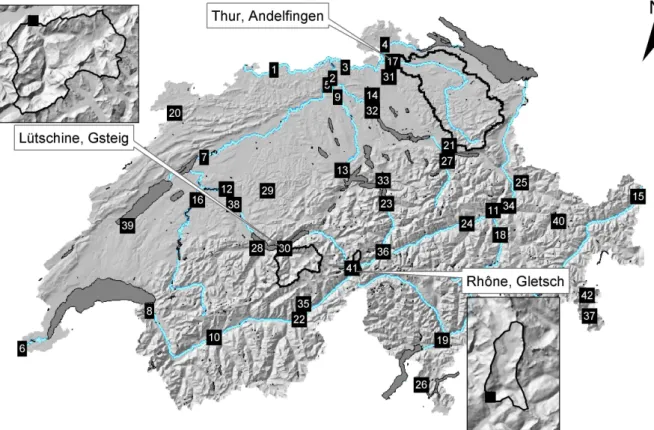
Fig. 1. Location of the 42 investigated Swiss FOEN discharge gauges and shape of the three basins considered for distributed hydrological
simulations. Labels are declared in Table 1.
2 Methods
2.1 Streamflow data
Monthly streamflow records from 42 gauges operated by the Swiss Federal Office for the Environment (FOEN, 2004) are used in this study. Stations with high quality data and at least 30 years of continuous observations have been selected. Dur-ing the investigated time frame, some time series has been af-fected by anthropogenic perturbations (lake regulation, river corrections and hydropower).
Birsan et al. (2005) investigated streamflow trends in Switzerland and considered virtually only headwater basins. Here we are interested in relative changes in runoff responses of the headwater regions in the high mountains and all the way down to the gauges after the large lakes in the Swiss Plateau, where the alpine rivers and torrents become large streams with drainage areas exceeding 10 000 km2. Thus, particular sets of nested basins were considered for the three main Swiss river systems (Rhˆone, Rhine and Aare).
Table 1 provides some basic information on the 42 gauges, including the drainage areas and the duration of the available time series. The spatial distribution of the stations is rea-sonably representative of regions with different climatology across Switzerland (Fig. 1). The gauges are also
representa-tive of the broad spectrum of hydrological regimes that can be identified in Switzerland (Pfaundler et al., 2006).
2.2 Hydrological modelling
The distributed hydrological model PREVAH (Precipitation-Runoff-evapotranspiration HRU Model; Gurtz et al., 1999) is used in this study. PREVAH serves since the mid 1990s as a research tool for studies on water resources and hydro-logical extremes within mountainous environments (Zappa et al., 2003; Verbunt et al., 2006; W¨ohling et al., 2006). The spatial discretization of PREVAH relies on the aggregation of gridded spatial information into clusters with similar hy-drological response, the HRUs (Zappa, 2002). Hyhy-drological similarity is determined according to elevation, land use, ex-position and soil depth of the grid cells. The equilibrium line of glaciers is considered to define accumulation or abla-tion areas of the glaciers. The implemented runoff generaabla-tion module is based on concepts from the HBV-model (Lind-str¨om et al., 1997), adapted to a spatially distributed applica-tion (Gurtz et al., 2003). The model incorporates modules for the simulation of snow and glacier melt (Hock, 1999; Zappa et al., 2003), and for the estimation of soil water losses by evapotranspiration (Penman, 1948; Monteith, 1981; Gurtz et al., 1999; Zappa and Gurtz, 2003).
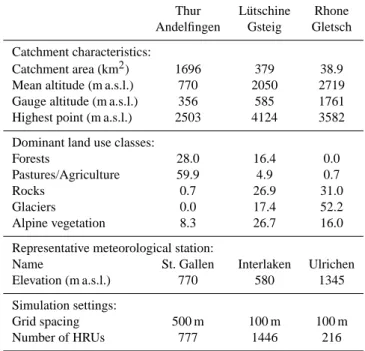
Table 2. Main characteristics of the three basins investigated with
distributed hydrological modelling.
Thur L¨utschine Rhone Andelfingen Gsteig Gletsch Catchment characteristics:
Catchment area (km2) 1696 379 38.9 Mean altitude (m a.s.l.) 770 2050 2719 Gauge altitude (m a.s.l.) 356 585 1761 Highest point (m a.s.l.) 2503 4124 3582 Dominant land use classes:
Forests 28.0 16.4 0.0 Pastures/Agriculture 59.9 4.9 0.7 Rocks 0.7 26.9 31.0 Glaciers 0.0 17.4 52.2 Alpine vegetation 8.3 26.7 16.0 Representative meteorological station:
Name St. Gallen Interlaken Ulrichen Elevation (m a.s.l.) 770 580 1345 Simulation settings:
Grid spacing 500 m 100 m 100 m Number of HRUs 777 1446 216
PREVAH is forced by standard meteorological variables with high temporal resolution. For its application, data on air temperature, precipitation, water vapour pressure, global radiation, wind speed and sunshine duration are required. In this study we use hourly meteorological information ob-tained from the Swiss Federal Office of Meteorology and Climatology (Begert et al., 2005). Local information on precipitation is obtained from a complementary network of pluviometers sampling with a one day sampling frequency (7:00 to 7:00 of the next day). Similarly to the schemes de-scribed in Garen and Marks (2001) and Klok et al. (2001), the adopted algorithms for spatial interpolation are simple elevation de-trended inverse distance weighting.
2.3 Study areas
PREVAH was applied to three Swiss Rivers (Table 2 and Fig. 1): the Thur (Gurtz et al., 1999; Jasper et al., 2006), the Rhˆone (Verbunt et al., 2003), and the L¨utschine.
The Thur basin is located in north-eastern Switzerland. It drains into the Rhine shortly after the Andelfingen gauge (1696 km2, LH-2044, Table 1; FOEN, 2004). The discharge regime reflects both the snowmelt governed runoff genera-tion from its Alpine areas and the reduced contribugenera-tion to runoff generation from the areas located in the Swiss plateau. The Rhˆone basin down to the Gletsch gauge (38.9 km2, LH-2268) is a heavily glacerized (52% of its total area) high-Alpine catchment located in the Wallis canton. This small basin is the source of the large river Rhˆone that drains into
the Lake of Geneva and flows into the Mediterranean Sea. The equilibrium line of the glacier is at about 3050 m a.s.l. (Klok et al., 2001).
The L¨utschine basin (379 km2, LH-2109) is located in the Alps above Berne and drains into the Lake of Brienz, which is a large alpine lake that collects water from the sources of the Aare River. About 17% of the basin consists of glaciers. An equilibrium line of 3000 m a.s.l. was used in this study.
2.4 Experimental setup
The application of PREVAH requires thorough calibration and verification. The most sensitive tunable parameters are the adjustment factors for scaling snowfall and rain-fall (Zappa, 2002), the parameters of the snowmelt module (Zappa et al., 2003), the non-linearity factor controlling the soil moisture recharge (Zappa and Gurtz, 2003) and the para-meters of the runoff generation module (Gurtz et al., 2003). In the case of glaciated basins, two additional parameters controlling the melt of glacerized areas are introduced and require calibration (Klok et al., 2001).
Calibration parameters for the three investigated basins were obtained from previous work with the model. The tu-nable parameters for the Rhˆone basin were estimated for the period 1990–1992 and verified for the period 1993 to 1996 (Klok et al., 2001). The calibration for the Rhˆone basin was completed manually. Model outputs were compared with ob-served values and evaluated by means of objective statistical criteria (Nash and Sutcliffe, 1970; Legates and McCabe Jr., 1999). A graphical comparison between observations and simulations was made in the calibration phase as an addi-tional subjective assessment of model performance.
The calibration procedure adopted for the Thur and L¨utschine basins relied on the maximization of an index of agreement based on nine different scores derived by compa-ring observed and simulated daily discharges (Sonderegger, 2004; Verbunt et al., 2006). A total of about 200 model runs is needed to calibrate PREVAH. The result of all model runs provides information on parameter sensitivity and related un-certainties (Pappenberger and Beven, 2006). The setup of calibrated model parameters from the Thur river basin is the same setup used by Verbunt et al. (2006). In that study the Thur is one of 23 basins analyzed in a coupled application of hydrological and numerical weather prediction models for the alpine section of the Rhine. The calibration included the period from 1997 to 1998. The calibration of the L¨utschine river basin was completed by Corti (2003). The calibration period was 1982 to 1985.
Appendices A and B provide additional information on the calibration procedure and the index of agreement.
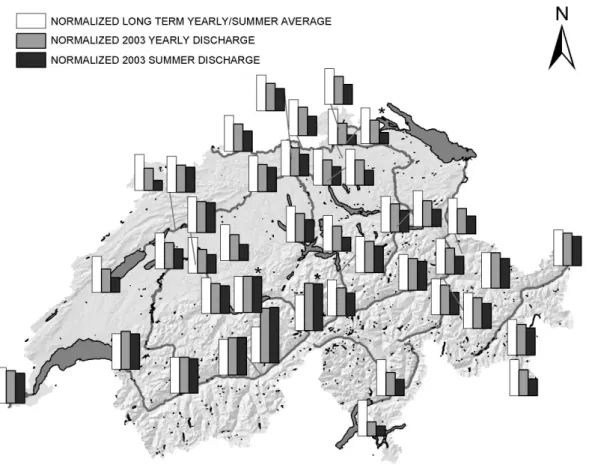
Fig. 2. Normalized deviation of the 2003 observed discharge from the long term average at the 42 FOEN gauges. The 2003 yearly discharge
at each has been normalized by the correspondent long term average. The discharge for summer 2003 has been normalized by the long term summer average. Summer has been defined from 1 June to 30 September. The white bars represent the norm value at each gauge. The value of the white bars is always 1. Asterisks indicate the three gauges investigated by means of distributed hydrological modelling.
3 Results and discussion
3.1 Analysis of long-term records
The average runoff in 2003 and the average runoff for the 4 month period from June to September 2003 are compared to long-term averages (Fig. 2). The length of the bars in the charts of Fig. 2 is proportional to the discharge anomalies of the 2003 time series, both for the summer season (black bars) and for the full year (grey bars). The white bars are introduced to evaluate the 2003 values with respect to the long term average. If the grey and black bars are higher that the white bar, then the 2003 discharge exceeded the average. If the grey and black bars are smaller than the white bar, then there was a deficit in the discharge.
Headwater basins of the Swiss Plateau showed a uniform response in terms of discharge anomalies. The yearly dis-charge was far below average (about 60% to 80 % of the long-term average). The very low flows throughout summer (40% to 60% of the summer average) were the main rea-son for the low annual means. In response to the heatwave, the soils dried out and evapotranspiration was limited by the
scarce availability of water in the unsaturated zone of the soil. The same applies for the generation of surface runoff components and groundwater recharge. Similar responses occurred in most of the basins with average elevations be-low 1500 m a.s.l. (Fig. 3b and Table 1). The effects of the 2003 heatwave were slightly less evident in basins with more pronounced Alpine environments and mean elevations above 1500 m a.s.l. The 2003 discharges were in this case on the order of 80% to 90% of the long-term yearly average. Cor-responding values for the summer period were 60% to 80%. Regional differences could be detected at the scale of the large river systems: the Rhine (Rekingen, LH-2143, Ta-ble 1), the Aare (Untersiggenthal, LH-2205) and the Rhˆone (Chancy, LH-2174). The Rhine 2003 discharge was −21% (full year) and −46% (summer) of the long-term average. The discharge anomalies for the Aare were −23% (full year) and −38% (summer), while for the Rhˆone the anomalies were smaller and on the order of −9% (full year) and −16% (summer). This varied response relates to the difference in the portion of glacerized areas (Table 1), which is highest in the Rhˆone (Chancy, 8.4%) and lowest for the Rhine (Rekin-gen, 0.57%).
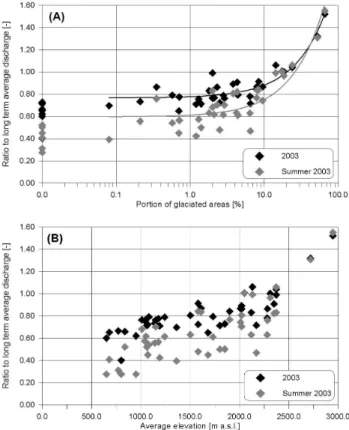
Fig. 3. Relation between catchment characteristics and ratio of the
2003 discharge (summer and full year) to the historical mean. (A) Relation to the degree of glacierization. (B) Relation to the average elevation of the basins.
In Fig. 3 the response of the basins to the 2003 heatwave, expressed as the ratio between the 2003 discharge and the long-term average is correlated to the physiographical char-acteristics of the areas. A significant dependence between the basin response and the presence of glaciers can be illus-trated if the ratios are plotted against the portion of glaciated areas (Fig. 3a). Basins with >25% glacier portions showed above average discharge both over the whole year and during the summer. For basins with a glacier coverage of 10% to 25%, the observed discharges in 2003 nearly corresponded to the long-term average. A full compensation of the 2003 heatwave effects on discharge volume was achieved in these rivers by increased melting from glaciated areas.
The magnitude of the anomalies presents a significant trend with elevation (Fig. 3b). Such a trend may be explained by differences in soil depths, evapotranspiration (Gurtz et al., 1999), snow accumulation during the previous winter, and the distribution of precipitation.
Two simple multiple regression models were developed in order to determine how significantly the hydrological re-sponse to the 2003 summer heatwave is correlated to the a-verage elevation (H in m a.s.l., Fig. 3b), and to the degree of glaciated areas (GLAC in percent, Fig. 3a). The cross-correlation between GLAC and H is 0.63. Table 3 shows
Fig. 4. Ratio between the 2003 summer discharge and the historical
summer mean from the high-alpine headwaters to the main outlet in Switzerland for three river systems. Labels refer to the LH identi-fiers declared in Table 1 and reported in FOEN (2004).
that both the regression model for 2003 and the model for the summer only are highly significant at a 95% level with
p-values smaller than 0.001. The coefficients of determina-tion R2are above 0.8.
Figure 4 depicts the discharge anomaly trends from high alpine headwater basins down to the main Swiss gauges of three large river systems (Aare, Rhˆone and Rhine). The ef-fects of the 2003 heatwave are less pronounced in the Rhˆone basin. The portion of glaciated areas is clearly above 10% up to the Porte-Du-Scex gauge (LH-2009). Icemelt com-pensates for reduced runoff generation from the remaining areas. Only the final inflow from contributing areas within the Swiss Plateau close to the Lake of Geneva (regulated to maintain a constant water level) caused a decrease in a-verage runoff at the Chancy gauge to 15% below aa-verage. The discharges of the other two large river systems were more affected by the 2003 heatwave since their portion of glaciated area is much smaller than that of the Rhˆone. If the responses of basins between 1000 and 10 000 km2are consi-dered, then the anomalies in the Rhine were 0.2 to 0.3 less than the anomalies of the Rhˆone. A last interesting comment from Fig. 4 concerns the flow of the Aare into the Rhine after the stations Untersiggenthal 2205) and Rekingen (LH-2143), respectively. The shape of the curve demonstrates that the Aare positively influenced the discharges of the down-stream part of the Rhine up to the Rhinefelden gauge (LH-2091).
3.2 Case studies with distributed hydrological modelling
3.2.1 Calibration and verification
For a further analysis of the hydrological mechanisms which triggered such varied responses of Swiss streams to the 2003 heatwave, the distributed hydrological model PREVAH was applied to three representative basins (Table 2) for the period 1981 to 2005. The first year is used for model initialization
0.564+0.009078×GLAC+0.000119×H Full year 0.850 ≪0.001 0.296+0.012052×GLAC+0.000175×H Summer 0.812 ≪0.001
GLAC = glacierization [%]; H = Average elevation of the basin [m a.s.l]; R2= coefficient of determination; p-value = empirical significance level of F -test (95% level).
Table 4. Calibration and verification of PREVAH for the investigated basins.
Basin Run Period NSE log(NSE) VOL Thur Calibration 1997–1998 0.887 0.861 −3.2 Thur Verification 1982–1996/1999–2005 0.864 0.883 5.6 Thur Full period 1982–2005 0.866 0.882 −2.6 L¨utschine Calibration 1982–1985 0.919 0.927 −0.2 L¨utschine Verification 1986–2005 0.911 0.919 0.2 L¨utschine Full period 1982–2005 0.912 0.920 −0.16 Rhˆone Calibration 1990–1996 0.925 0.927 −3.3 Rhˆone Verification 1982–1989/1997–2005 0.906 0.904 1.0 Rhˆone Full period 1982–2005 0.912 0.901 −0.3
NSE, log(NSE) and VOL [%] are defined in Appendix B. VOL below 0 indicate that the model underestimate the observed discharge.
and is disregarded for data analysis, which eventually in-cluded the 24 year period 1982–2005. This decision mini-mized the uncertainty of the initial values of the snow water equivalent and the initial water storages within the basin. The available time series was evaluated separately for the calibra-tion and verificacalibra-tion periods (Table 4).
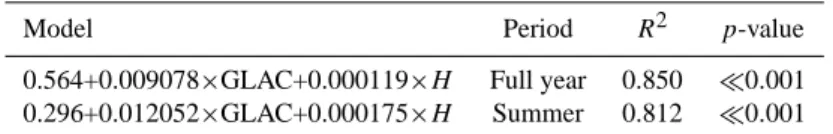
In general the discharge simulated with PREVAH corres-ponds well with the observations. The obtained Nash and Sutcliffe efficiencies (NSE and log(NSE)) are above 0.85 in the calibration and verification periods. The error in the obtained discharge volumes (VOL) for the whole period of model application is less than 3%. However, the volume er-ror is above 5% in the verification period of the Thur, due to the shortness of the calibration period which was only two years (Verbunt et al., 2006). Figure 5 shows that the model is well able to reproduce the dynamics of the discharge hydro-graphs of the three investigated basins for two of the years within the verification period (2002 and 2003). The NSE agreement is in all basins for both years above 0.85. Figure 5 also demonstrates the reduced rainfall activity throughout the 2003 summer. In 2002 several rainfall-triggered runoff peaks can be identified for the Thur and L¨utschine Rivers, whereas there are no relevant rainfall-triggered runoff peaks through-out the 2003 summer.
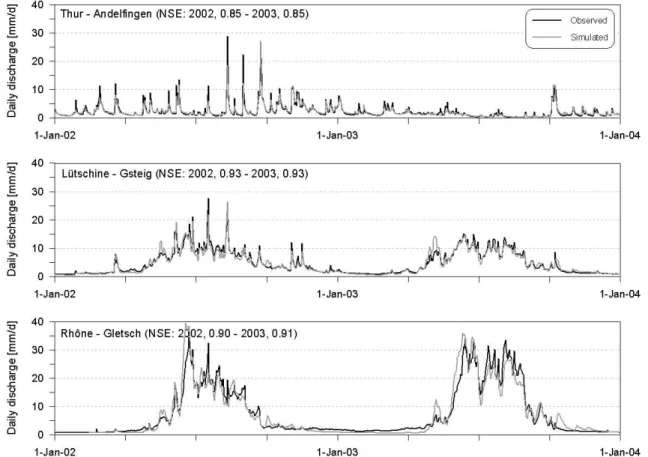
Cumulative observed and simulated hydrographs are shown in Fig. 6. The long-term average cumulative hydro-graphs (1982–2005) are well simulated by the model (Ta-ble 4 and Fig. 5). The shapes of the 2003 cumulative
hydro-graphs are indicators of the different impacts of the heatwave on these three rivers. The L¨utschine shows hardly any dif-ference from the long-term cumulative hydrograph (Table 5 and Fig. 6). At a first glance, 2003 looks like an average year. The model captures this behavior well.
The shape of the cumulative average discharge plot for the Thur shows that more than 50% of the discharge accumulates by the end of May. At this time in year the cumulative 2003 discharge for the other two rivers is less than 20% of the total annual yield. Starting from early April, the cumulative dis-charge of the Thur basin shows an increasing negative bias with respect to the long-term average. During late spring the model underestimates runoff generation. A relative constant error of about 25 to 30 mm in the cumulative discharge volu-mes is observed between mid-May and mid-September.
The Rhˆone basin shows the opposite behavior. Starting in early January, a positive cumulative bias accumulates be-tween the 2003 data and the long-term average. That bias strongly increases during the heatwave. High temperatures in June accelerate snowmelt. The glacerized areas are free of snow earlier in the season and yield additional water. High temperatures at very high elevations (Koboltschnig et al., 20071) cause the melting of firn from the glacier accumu-lation area (Klok et al., 2001). The hydrological model is
1Koboltschnig, G., Schoener, W., Zappa, M., and Holzmann, H.:
Contribution of glacier melt to stream runoff under extreme climate conditions, Hydrol. Processes, submitted, 2007.
Fig. 5. Observed and simulated discharge in the verification years 2002 and 2003 for the three investigated basins. The agreement NSE after
Nash and Sutcliffe (1970) is indicated for both years.
Table 5. Simulated mean annual water balance of the investigated
catchments. All terms are expressed in mm per year.
Basin Period P ET 1S RS RO Thur 1982–2005 1386 526 −5 865 887 Thur 2003 1098 554 −19 563 583 L¨utschine 1982–2005 1632 270 −237 1599 1602 L¨utschine 2003 1271 312 −605 1564 1577 Rhˆone 1982–2005 2039 215 −565 2389 2395 Rhˆone 2003 1622 265 −1542 2899 2948
P = precipitation; ET = evapotranspiration; 1S = storage change; RS = simulated runoff, RO = observed runoff.
capable of adequately reproducing this kind of hydrological response. During the second part of the heatwave, the model simulates less discharge than observed in the river stream. A similar study on other high elevation catchments showed analogous problems. Koboltschnig et al. (2007)1used PRE-VAH to analyze the effects of the 2003 summer heatwave on the hydrological response of the Goldbergkees glacier in Austria. Data samples at Goldbergkees described in Sch¨oner
et al. (2004) indicate that a layer of sand from the Sahara was deposited on the glacier surface shortly after the begin-ning of the snow accumulation period in November 2002. A higher icemelt/firnmelt as compared to model estimations was observed. Paul et al. (2005) also reports evidence of Sahara sand deposition on Swiss glaciers in the 2002/2003 winter. PREVAH does not account for albedo reductions as a consequence of sand and debris deposition in the ac-cumulation and ablation areas of glaciers. This could explain why the model underestimates discharge in the period of the year when icemelt and firnmelt are the highest contributing sources of discharge within highly glacerized basins (Verbunt et al., 2003).
3.2.2 Water balance estimations
Table 5 summarizes water balance estimates. In the Thur, 37% of precipitation leaves the system as evapotranspira-tion ET. This agrees with the results obtained by Gurtz et al. (1999), who estimated for the period 1993 and 1994 that ET is about 39% of precipitation. Storage change is slightly negative. In 2003, evapotranspiration was more than 50% of precipitation. Rainfall was 20% below average, ET was 5% above average, and discharge was 35% below average. The
Fig. 6. Cumulative observed and simulated discharge in 2003 for three basins (continuous lines). For comparison, observed and simulated
mean cumulative runoff for the period 1982–2005 is plotted with dashed lines.
negative water balance is 4 times the average. This is due to high water losses from the soils during the heatwave and missing groundwater recharge throughout the summer.
PREVAH simulations of the L¨utschine water balance pro-vide quantitative measures for interpreting the apparent neu-tral response (in terms of discharge volumes) to the heat-wave. The large average negative water balance of −237 mm per year is due to icemelt. By relating this value to the por-tion of glaciers (Table 2), it can be determined that glaciers thin by about −1.3 meters per year. This value is higher than the estimated average losses of −0.6 m water equiva-lent (m w.e.) for alpine glaciers (Frauenfelder et al., 2005). In 2003 a precipitation anomaly of −22% was registered. ET was 15% above the average, while runoff was only 2.2% be-low average (Fig. 6 and Table 5). Icemelt compensated for the missing rainfall. PREVAH estimated for 2003 a water balance of −605 mm. This corresponds to −3.5 m w.e. for the glaciers. This value is close to the glacier mass balance value of −2.5 to −3.0 m w.e. reported in the 8th Glacier mass balance bulletin (IUGG, 2005), which analyzed the response of the European glaciers to the 2003 heatwave.
The mean water balance of the Rhˆone is also strongly negative (Table 5). Model estimations indicate that about 565 mm of water is leaving the system in the form of icemelt, which is not compensated for by a corresponding accumula-tion of snow masses in the firn areas. This value is equivalent to −1.1 m w.e. per year. ET is about 10% of precipitation. In 2003 ET was more than 20% above the mean, while pre-cipitation was 20% below average (Table 5). Simulated and observed runoffs were 20% above the mean. The balance for 2003 is on the order of -1542 mm, which represent a melting of about −3.0 m w.e. for the glaciers.
3.2.3 Normalized anomalies of hydrometeorological vari-ables
Sch¨ar et al. (2004) defined T′/σ as a normalization of the temperature anomalies T′ by the standard deviation σ of the data sample. T′/σ is used to quantify the difference of the 2003 summer temperatures anomalies from the cli-matic mean. The length of the climatology presented here was constrained by the availability of input for the hydro-logical simulations (1982–2005). Table 6 reports the cli-matological mean, the standard deviations and normalized anomalies in the summer of 2003 (June–September) for dif-ferent hydrometeorological variables. Anomalies and stan-dard deviations are computed for average and accumulated data within the time frame June–September. For snow accu-mulation, the time frame is October to March.
Temperature anomalies T′at the representative stations of our areas (Table 2) range between +2.6◦K for Interlaken and +3.2◦K for Ulrichen. T′/σ is larger than 2 at all stations. Sch¨ar et al. (2004) and Koboltschnig et al. (2007)1also inves-tigated T′/σ for the period June–August 2003 and obtained anomalies exceeding 4 standard deviations from the clima-tology of time series longer than 120 years. At the Basel station (Beniston, 2004) the mean monthly summer temper-ature for the period 1982–2005 is about 0.75◦C higher than the average for the period 1864–2005. The last 25 years have been the warmest since instrumented observations exist (e.g. Begert et al., 2005). The anomalies obtained from the in-vestigated time series show that the summer of 2003 was ex-tremely warm also in comparison to the summers observed since 1982.
For the hydrological characterization of the 2003 heat-wave, the aridity index φ after Budyko (1974) is used. The value of φ is computed as the ratio between simulated
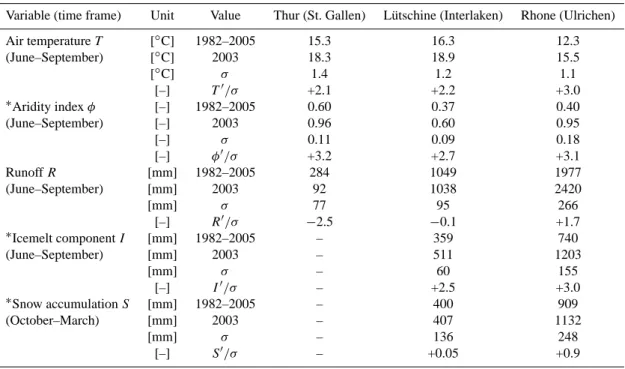
Table 6. Summary of statistical values for five hydrometeorological variables. For each basin and variable the following are listed: the
average (1982–2005), the value for 2003, the standard deviation σ and normalized anomalies for 2003. The anomalies T′, φ′, R′, I′and
S′, are obtained as the difference between the 2003 value and the period average. Asterisks denote modelled variables. The considered time frame for the analysis and computations of standard deviations is declared in brackets for each variable.
Variable (time frame) Unit Value Thur (St. Gallen) L¨utschine (Interlaken) Rhone (Ulrichen) Air temperature T [◦C] 1982–2005 15.3 16.3 12.3 (June–September) [◦C] 2003 18.3 18.9 15.5 [◦C] σ 1.4 1.2 1.1 [–] T′/σ +2.1 +2.2 +3.0 ∗Aridity index φ [–] 1982–2005 0.60 0.37 0.40 (June–September) [–] 2003 0.96 0.60 0.95 [–] σ 0.11 0.09 0.18 [–] φ′/σ +3.2 +2.7 +3.1 Runoff R [mm] 1982–2005 284 1049 1977 (June–September) [mm] 2003 92 1038 2420 [mm] σ 77 95 266 [–] R′/σ −2.5 −0.1 +1.7 ∗Icemelt component I [mm] 1982–2005 – 359 740 (June–September) [mm] 2003 – 511 1203 [mm] σ – 60 155 [–] I′/σ – +2.5 +3.0 ∗Snow accumulation S [mm] 1982–2005 – 400 909 (October–March) [mm] 2003 – 407 1132 [mm] σ – 136 248 [–] S′/σ – +0.05 +0.9
potential evapotranspiration ETP and interpolated precipita-tion P (Arora, 2002). ETP is related to temperature, relative humidity and solar radiation (Gurtz et al., 1999). The aridity index φ for the period from June to September was estimated using PREVAH. The computed average φ of 0.6 for the Thur confirms that here ET is an important component regulating runoff generation. In the other two basins, φ is lower (Ta-ble 6). Following the classification presented by Ponce et al. (2000), φ values below 1.0 in the investigated basins indi-cate that these catchments belong to the most humid regions of our planet, even if they experienced extreme warm and dry conditions in 2003. In 2003, φ shows stronger anoma-lies than air temperature in the Thur and L¨utschine basins. Such extreme dry conditions are triggered by the concurrence of large positive T′/σ with significant negative precipitation anomalies. φ and T are positively correlated (Fig. 7). The temperature variability is similar in all three basins, with a standard deviation σ of 1.1 to 1.4◦C. The variability of φ is close to 0.1 for the L¨utschine and Thur basins, and nearly twice that for the Rhˆone basin (Table 6 and Fig. 7). The data pair (φ,T)2003is in all investigated areas far outside the box representing variability on the order of ±σ and it would also be outside the ±2σ range.
The normalized runoff anomalies R′/σ are in agreement with the analysis proposed in Fig. 2 and Table 6. Rivers react with opposite behaviors. The value of R′/σ is −2.5 for the
Thur, close to zero for the L¨utschine, and +1.7 for the Rhˆone. Figure 8 highlights the scatter between φ and R. The values of φ and R show a strong negative correlation for the Thur basin. Warm and dry weather causes higher ET and strongly reduced runoff generation. In the Rhˆone basins, φ and R are also correlated. However, here the correlation is positive. In the L¨utschine basin φ and R are not significantly correlated. The basins with glacial regimes show much lower varia-bility in the summer discharge rates than basins with pluvial regimes (Pfaundler et al., 2006). The coefficient of varia-tion cvis 0.09 for the L¨utschine, 0.27 for the Thur, and 0.13 for the Rhˆone. This is evidence of mechanisms of discharge compensation by meltwater in years with high φ. Icemelt in the L¨utschine basin provided in the summer of 2003 just enough “additional” melt to compensate for the volume of missing water due to a lack of precipitation and high ET (Ta-ble 5). With 52.2% glacier coverage, the Rhˆone basins rely on larger sources of meltwater to compensate for water short-ages in periods with higher φ. The amount of icemelt in the summer of 2003 was in the Rhˆone so significant that nearly unprecedented average runoff maxima were attained. This overcompensation explains the slight positive correlation be-tween φ and R.
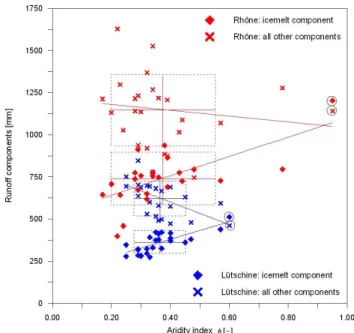
If simulated runoff is separated into individual compo-nents, then the icemelt (I ) component (Verbunt et al., 2003) can be isolated and analyzed similarly to T , φ and R
Fig. 7. Scatter plot of the relation between the simulated aridity
index φ and observed air temperature T . Each symbol represents a (φ, T ) pair for each year within the 1982–2005 period. The 2003 (φ, T ) pair is encircled. The continuous lines parallel to the x- and y-axes represent the average φ and T . The dashed boxes show the range of ± one standard deviation from average φ and T . A linear fit between φ and T is also drawn for each basin.
(Table 6). The obtained normalized icemelt anomalies I′/σ
were +2.5 (L¨utschine) and +3.0 (Rhˆone). These two valu-es are very similar to φ′/σ. The non-glaciated portions of the L¨utschine and the Rhˆone showed similar behavior to dis-charge in the Thur basin. Figure 9 shows that the runoff com-ponents, which are not related to icemelt, showed opposite behavior to icemelt. Icemelt is positively correlated to φ. The other runoff components showed a negative correlation to φ. The 2003 icemelt component in the two basins exceeded the period mean by more than +2.5σ . The anomaly of the non-icemelt component was less pronounced. The deviation from the long-term mean was close to zero in the Rhˆone and about –1.5σ in the L¨utschine (Fig. 9). Due to the large contribu-tion of snowmelt to the total runoff in the Rhˆone (Verbunt et al., 2003), the runoff from non-glaciated areas is strongly de-pendent on snow accumulation S during the previous winter. The snow accumulation anomaly S′/σ between 1 October 2002 and 31 March 2003 was +0.9σ above the period mean (Table 6). This significant positive S′/σ explains why the anomaly in the non-icemelt discharge components was not that negative in the Rhˆone. In the L¨utschine, S′/σ for 2003 was close to the period mean.
Figure 10 provides a spatial impression of the dual char-acter of the hydrological response to the 2003 summer heat-wave for the L¨utschine. In August 2003, R′/σ showed dis-tinct spatial structures which were related to altitude and land-use. The most positive R′/σ anomalies were detected
Fig. 8. As Fig. 7 but for the variables simulated aridity index φ
versus observed runoff R.
Fig. 9. As Fig. 7 but for the variables simulated aridity index φ
ver-sus simulated runoff components. Diamonds: icemelt component. Crosses: all other components.
for the glaciers and regions close to the mountains crest. Nearly all other regions showed negative anomalies on the order of −1.1 to −1.4σ .
Fig. 10. Distribution of simulated positive and negative normalized
discharge anomalies R′/σ within the L¨utschine basins for August 2003.
4 Conclusions
The presented analysis showed the complexity of the hydro-logical response of Swiss Rivers and mountainous environ-ments to the 2003 European summer heatwave. The combi-nation of the various anomalies triggered a set of non-linear feedbacks that led to a wide spectrum of responses in terms of discharge. The specific response of three representative rivers was summarized by investigating the relations between anomalies in air temperature, aridity index, potential evapo-transpiration, snow accumulation and icemelt.
In basins without glaciers, summer discharge anomalies are related to both precipitation and temperature anomalies. Our analyses demonstrate and quantify the high variability in the internal basin anomalies of runoff generation in glaciated basins. Icemelt is directly correlated to the anomalies in the aridity index. In the summer of 2003, icemelt was approxi-mately three times higher than the mean for the 24 year pe-riod 1982-2005. Qualitatively, this dramatic melt response agrees well with proposed glacier mass balance estimates (Frauenfelder et al., 2005).
Simulations with the distributed hydrological model PRE-VAH for the period of the 2003 summer heatwave are in-cluded in the verification period for all three basins. The model was able to capture the highly variable response of the three basins without additional calibration. The model demonstrated robustness in being able to estimate the hydro-logical response for an event that had nothing in common with the calibration conditions. Results confirm that dis-tributed hydrological models such as PREVAH are able to provide reliable information on the hydrological response of mountainous environments to extreme meteorological events and hence to climate change projections (Barnett et al., 2005).
Large river systems such as the Aare, the Alpine Rhine, and the Rhˆone were also affected by the 2003 heatwave. Even if in their mountainous high-alpine headwater basin discharge was above average, the missing contribution to runoff from areas below 1500 m a.s.l. caused a significant discharge deficit downstream.
We showed that regional hydrological responses to the 2003 summer heatwave can be related to the physical char-acteristics of the basins. More than 80% of the variabili-ty in the hydrological response of Swiss river basins to the 2003 heatwave can be explained by the average elevation and the degree of glacerization. During the 2003 heatwave, basins in the Swiss Central Plateau and basins with very low glacier portions (<1%) had less than 60% of the mean sum-mer runoff. Historical discharge minima were recorded in al-most all the lowland river basins whose long-term discharge records were too short to include the years 1947 and 1921. In alpine basins with up to 10% glacierization, icemelt provides a partial compensation of the reduced runoff generation in ice-free areas. The summer discharge is about 70–80% of the average. Basins with about 15% glacerization show the most interesting response to the 2003 heatwave. The addi-tional contribution of icemelt fully compensates for the limi-ted runoff generation in the remainder of the basin. Thus, the discharge during the summer of 2003 was very close to the historical annual and summer averages. At the same time, at sub-basin scales strong positive and strong negative anomalies in discharge were observed. Such an insight into mechanisms of hydrological extremes can only be attained through the application of distributed hydrological models. The disaggregation of the catchment response is very impor-tant in order to identify areas where such events can lead to environmental risks. Hydrological models might therefore be adopted for identifying the most sensitive regions where heatwaves may become a recurrent natural hazard with large social and economical impacts.
This particular form of compensation of discharge volu-mes by additional icemelt contributed to reduced variability of the hydrographs in alpine rivers during the 20th century as compared to lowland basins (Pfaundler et al., 2006). Since glaciers are shrinking and are expected to disappear from European landscapes within few decades (Schneeberger et al., 2003; Zemp at al., 2006), it is anticipated that the year-to-year variability in discharge will increase in alpine and high-alpine basins and possibly reach similar variability as in lowland basins. Significant trends can already be detected (Birsan et al., 2005). Hydropower companies, which use the average hydrograph to manage reservoir storage (Sch¨afli, 2005), should therefore begin thinking about new strategies for dealing with increased variability in the hydrological cy-cle (Ohmura and Wild, 2002; Frei et al., 1998; Sch¨ar et al., 2004). A way to deal with variability and meteorological extremes could be a real-time hydrological model based on water resources monitoring and the development of methods for the early detection of events like the 2003 heatwave. The
ity in the history of hydrometeorological monitoring in Eu-rope. Such events could represent a characteristic response of mountainous environments in the transition between the cli-mate at the end of the 20th century and the clicli-mate projected for the second half of the 21st century (IPCC, 2001). As an early documentation of the climate of the future, the data collected during the 2003 summer heatwave can contribute more than any model projection to the sound understanding of the hydrological response to climate change.
Appendix A
Calibration procedure
Global hill-finding is a major problem of most automatic ca-libration algorithms (Beven 2001). The caca-libration proce-dure implemented in PREVAH relies on a straight forward reduction of a two-dimensional parameter space (Sondereg-ger, 2004). The procedure is run with user defined initial parameters and follows the schema presented in Fig. A1:
a) Two of the parameters requiring calibration are selected. The modeler specifies for each parameter maximum and minimum values. These values define a two dimen-sional parameter-space;
b) The obtained parameter-space is split into 9 quadrants. The parameter values describing the 4 main intersec-tions of the parameter-space are adopted for running PREVAH;
c) For each of the 4 model runs an objective index rang-ing between zero and one is computed. The index is a weighted expression of 9 scores (Appendix B). The parameter values yielding the highest index define the central point of a new, reduced, parameter space. 5 of the 9 quadrants of the original parameter space (shown in gray) are removed;
d) The new parameter-space is subdivided into 9 quad-rants;
e) The procedure described in c) and d) is repeated itera-tively until no further improvement in the objective in-dex is achieved. The user can also choose to end the procedure after a certain number of iterations.
f) The values for the two parameters are calibrated and used by the model. Two other parameters can be then selected for defining a parameter space that is then ana-lyzed as described above;
Fig. A1. Estimation of calibrated parameters by straight forward
reduction of a chain of two-dimensional parameter spaces.
Usually a chain of 8 to 12 pairs of tunable parameters is analyzed, starting with the most sensitive. A total of about 200 model runs are needed to estimate a set of calibrated pa-rameters. The result of all model runs gives indications on parameter sensitivity and related uncertainty (Pappenberger and Beven, 2006).
This procedure does not provide the absolute certainty of finding the global highest hill of the parameter space, but it is well able to provide robust parameter sets that yield high performance in the verification period. Such a procedure is particularly useful if CPU consuming models are used and thousands of runs for parameter uncertainty estimation can not be afforded.
Appendix B Index of agreement
The calibration procedure (Appendix A) aims at maximiz-ing an index of agreement based on a weighted average of nine objective scores derived by comparing the observed and the simulated daily discharges (Sonderegger, 2004; Verbunt et al., 2006). Three basic equations are adopted: the Nash and Sutcliffe efficiency NSE (Eq. B1), its logarithmic for-mulation log(NSE) (Eq. B2) and the volume error (VOL) (Eq. B3). NSE=1− Pn i=1|Oi−Si|2 Pn i=1 Oi− h 1 n Pn i=1Oi i 2 (B1) log (NSE) = 1 − Pn i=1|ln (Oi) −ln (Si)|2 Pn i=1 ln (Oi) − h 1 n Pn i=1ln (Oi) i 2(B2) VOL= n X i=1 Si Oi −1 ! ×100 (B3)
Nine scores are derived from the application of Eqs. (B1)– (B3) to observed (Oi) and simulated (Si)data. The first three scores are determined by computing Eqs. (B1)–(B3)
for the full calibration period. Six additional scores are in-troduced to improve the identification of robust parameter sets that provide a similar agreement for all the different sea-sons of the year and for all the years of the calibration period. To achieve this, Eqs. (B1)–(B3) are computed for each year within the calibration period. Three scores are then obtained by determining the standard deviation in the agreement be-tween the single calibration years. Finally Eqs. (B1)–(B3) are estimated for each monthly data sub-sample within the calibration period. Thus, three more scores are determined by computing the standard deviation in the agreement of the twelve scores from the monthly sub-samples.
All nine scores are reduced to a dimensionless index rang-ing between zero and one. The nine indexes are finally com-bined by adopting a weighted geometric mean as proposed in Seibert and McDonnell (2002). The weights can be defined by the user, who can for instance decide if the calibration procedure has to be more focused on achieving high NSE, a low VOL or a well balanced mixture of all nine indexes. Acknowledgements. M. Verbunt, A. Badoux and M. Corti
con-tributed to the calibration of the hydrological model in the Thur, Rhˆone and L¨utschine basins. The meteorological data have been kindly provided by the Swiss Federal Office of Meteorology and Climatology MeteoSwiss. D. Molnar carefully edited the final manuscript.
Edited by: L. Ferraris Reviewed by: three referees
References
Arora, V. K.: The use of the aridity index to assess climate change effect on annual runoff, J. Hydrol., 265, 164–177, 2002. Barnett, T. P., Adam, J. C., and Lettenmaier, D. P.: Potential impacts
of a warming climate on water availability in snow-dominated regions, Nature, 438, 303–309, 2005.
Begert, M., Schlegel, T., and Kirchhofer, W.: Homogeneous tem-perature and precipitation series of Switzerland from 1864 to 2000, Int. J. Climatol., 25, 65–80, 2005.
Beniston, M.: The 2003 heat wave in Europe: A shape of things to come? An analysis based on Swiss climatological data and model simulations, Geophys. Res. Lett., 31, L02202, doi:10.1029/2003GL018857, 2004.
Beven, K. J.: Rainfall-runoff modelling: the primer, Chichester, Wiley, 2001.
Birsan, M. V., Molnar, P., Burlando, P., and Pfaundler, M.: Stream-flow trends in Switzerland, J. Hydrol., 314, 312–329, 2005. Black, E., Blackburn, M., Harrison, G., Hoskins, B., and Methven,
J.: Factors contributing to the summer 2003 European heatwave, Weather, 59, 217–223, 2004.
Budyko, M. I.: Climate and life, Academic Press, Orlando, FL, 508 pp., 1974.
BUWAL, BWG, and MeteoSchweiz: Auswirkungen des Hitzesom-mers 2003 auf die Gew¨asser, Dokumentation, p. 176, 2004. Ciais, P., Reichstein, M., Viovy, N., Granier, A., Ogee, J., Allard, V.,
Aubinet, M., Buchmann, N., Bernhofer, C., Carrara, A., Cheval-lier, F., De Noblet, N., Friend, A.D., Friedlingstein, P., Grunwald,
T., Heinesch, B., Keronen, P., Knohl, A., Krinner, G., Loustau, D., Manca, G., Matteucci, G., Miglietta, F., Ourcival, J.M., Pa-pale, D., Pilegaard, K., Rambal, S., Seufert, G., Soussana, J.F., Sanz, M.J., Schulze, E.D., Vesala, T., and Valentini, R.: Europe-wide reduction in primary productivity caused by the heat and drought in 2003, Nature, 437, 529–533, 2005.
Conti, S., Meli, P., Minelli, G., Solimini, R., Toccaceli, V., Vichi, M., Beltrano, C., and Perini, L.: Epiderniologic study of mortal-ity during the Summer 2003 heat wave in Italy, Environ. Res., 98, 390–399, 2005.
Corti, M.: Untersuchungen zur fl¨achendifferenzierten hydrologis-chen Modellierung des Einzugsgebietes der Aare unter Ver-wendung des PREVAH und zu seiner effizienten Kalibrierung, Diploma Thesis at the ETH Z¨urich, p. 141, 2003.
FOEN: The Hydrological Yearbook of Switzerland, Swiss Federal Office for the Environment (FOEN), Bern, Switzerland, 2004. Frauenfelder, R., Zemp, M., Haeberli, W., and Hoelzle, M.:
World-wide glacier mass balance measurements: trends and first re-sults of an extraordinary year in Central Europe, Ice and Climate News, pp. 9–10, 2005.
Frei, C. and Schar, C.: Detection probability of trends in rare events: Theory and application to heavy precipitation in the Alpine re-gion, J. Climate, 14, 1568–1584, 2001.
Frei, C., Schar, C., Luthi, D., and Davies, H. C.: Heavy precipitation processes in a warmer climate, Geophys. Res. Lett., 25, 1431– 1434, 1998.
Garen, D. and Marks, D.: Spatial fields of meteorological input data including forest canopy corrections for an energy budget snow simulation model, International Association of Hydrological Sci-ences (IAHS) Publication, 270, 349–353, 2001.
Gehrig, R.: The influence of the hot and dry summer 2003 on the pollen season in Switzerland, Aerobiologia, 22, 27–34, 2006. Goddard, L., Mason, S. J., Zebiak, S. E., Ropelewski, C. F.,
Basher, R., and Cane, M. A.: Current approaches to seasonal-to-interannual climate predictions, Int. J. Climatol., 21, 1111–1152, 2001.
Grize, L., Huss, A., Thommen, O., Schindler, C., and Braun-Fabrlander, C.: Heat wave 2003 and mortality in Switzerland, Swiss Medical Weekly, 135, 200–205, 2005.
Gruber, S., Hoelzle, M., and Haeberli, W.: Permafrost thaw and destabilization of Alpine rock walls in the hot summer of 2003, Geophys. Res. Lett., 31, L13504, doi:10.1029/2004GL020051, 2004.
Gurtz, J., Baltensweiler, A., and Lang, H.: Spatially distributed hydrotope-based modelling of evapotranspiration and runoff in mountainous basins, Hydrol. Processes, 13, 2751–2768, 1999. Gurtz, J., Zappa, M., Jasper, K., Lang, H., Verbunt, M., Badoux, A.,
and Vitvar, T.: A comparative study in modelling runoff and its components in two mountainous catchments, Hydrol. Processes, 17, 297–311, 2003.
Hock, R.: A distributed temperature-index ice- and snowmelt model including potential direct solar radiation, J. Glaciol., 45, 101– 111, 1999.
Horton, P., Schaefli, B., Mezghani, A., Hingray, B., and Musy, A.: Assessment of climate-change impacts on alpine discharge regimes with climate model uncertainty, Hydrol. Processes, 20, 2091–2109, 2006.
Huber, U., Bugmann, H., and Reasoner, M.: Global Change and Mountain Regions: An Overview of Current Knowledge,
letin No. 8, in: Zurich: World Glacier Monitoring Service, p. 110, 2005.
Jasper, K., Calanca, P., and Fuhrer, J.: Changes in summertime soil water patterns in complex terrain due to climatic change, J. Hy-drol., 327, 550–563, 2006.
Jasper, K., Calanca, P., Gyalistras, D., and Fuhrer, J.: Differential impacts of climate change on the hydrology of two alpine river basins, Clim. Res., 26, 113–129, 2004.
Kleinn, J., Frei, C., Gurtz, J., Luthi, D., Vidale, P. L., and Schar, C.: Hydrologic simulations in the Rhine basin driven by a re-gional climate model, J. Geophys. Res.-Atmos., 110, D04102, doi:10.1029/2004JD005143, 2005.
Klok, E. J., Jasper, K., Roelofsma, K. P., Gurtz, J., and Badoux, A.: Distributed hydrological modelling of a heavily glaciated Alpine river basin, Hydrological Sciences Journal-Journal Des Sciences Hydrologiques, 46, 553–570, 2001.
Legates, D. R. and McCabe, G. J.: Evaluating the use of “Goodness-of-Fit” measures in hydrologic and hydroclimatic model valida-tion, Water Resour. Res., 35, 233–241, 1999.
Lindstrom, G., Johansson, B., Persson, M., Gardelin, M., and Bergstrom, S.: Development and test of the distributed HBV-96 hydrological model, J. Hydrol., 201, 272–288, 1997.
Luterbacher, J., Dietrich, D., Xoplaki, E., Grosjean, M., and Wan-ner, H.: European seasonal and annual temperature variability, trends, and extremes since 1500, Science, 303, 1499–1503, 2004. Menzel, A.: A 500 year pheno-climatological view on the 2003 heatwave in Europe assessed by grape harvest dates, Meteorolo-gische Zeitschrift, 14, 75–77, 2005.
Monteith, J. L.: Evaporation and Surface-Temperature, Q. J. Roy. Meteor. Soc., 107, 1–27, 1981.
Nash, J. E. and Sutcliffe, J. V.: River flow forecasting through con-ceptual models (1), a discussion of principles, J. Hydrol., 10, 282–290, 1970.
Ohmura, A. and Wild, M.: Is the hydrological cycle accelerating?, Science, 298, 1345–1346, 2002.
Pappenberger, F. and Beven, K. J.: Ignorance is bliss: Or seven reasons not to use uncertainty analysis, Water Resour. Res., 42, W05302, doi:10.1029/2005WR004820, 2006.
Paul, F., Machguth, H., and K¨a¨ab, A.: On the impact of glacier albedo under conditions of extreme glacier melt: the summer of 2003 in the Alps, EARSeL eProceedings, 4, 139–149, 2005. Penman, H. L.: Natural Evaporation from Open Water, Bare Soil
and Grass, Proceedings of the Royal Society of London Series a-Mathematical and Physical Sciences, 193, 120–145, 1948. Pfaundler, M., Weingartner, R., and Diezig, R.: “Hidden behind
the means” – The variability of flow regimes, Hydrologie und Wasserbewirtschaftung (in German), 50, 116–123, 2006. Ponce, V. M., Pandey, R. P., and Ercan, S.: Characterization of
drought across the climate spectrum, J. Hydrol. Engng, ASCE, 5, 222–224, 2000.
Schaefli, B.: Quantification of modelling uncertainties in climate change impact studies on water resources: application to a glacier-fed hydropower production system in the Swiss Alps, Dissertation No. 3225, EPF Lausanne, p. 219, 2005.
Schneeberger, C., Blatter, H., Abe-Ouchi, A., and Wild, M.: Mod-elling changes in the mass balance of glaciers of the northern hemisphere for a transient 2 x CO2 scenario, J. Hydrol., 282, 145–163, 2003.
Sch¨oner, W., Auer, I., B¨ohm, R., Hynek, B., Holzmann, H., and Koboltschnig, G.: Extreme glacier melt in Hohe Tauern region (Austrian Alps), in: Extended Abstracts, Landschafts¨okologie und Umweltforschung 47. International Conference on Hy-drology of Mountain Environments, Berchtesgaden, Germany, pp. 319–322, 2004.
Seibert, J.: Reliability of model predictions outside calibration con-ditions, Nord. Hydrol., 34, 477—492, 2003.
Seibert, J. and McDonnell, J. J.: On the dialog between experimen-talist and modeler in catchment hydrology: Use of soft data for multicriteria model calibration, Water Resour. Res., 38, 1241, doi:10.1029/2001WR000978, 2002.
Sonderegger, C.: Rainfall/Runoff Modelling of a Sub-Satchment of the Yangtze in China, Diploma Thesis at the ETH and University Z¨urich, p. 103, 2004.
Verbunt, M., Zappa, M., Gurtz, J., and Kaufmann, P.: Verification of a coupled hydrometeorological modelling approach for alpine tributaries in the Rhine basin, J. Hydrol., 324, 224–238, 2006. Verbunt, M., Gurtz, J., Jasper, K., Lang, H., Warmerdam, P., and
Zappa, M.: The hydrological role of snow and glaciers in alpine river basins and their distributed modeling, J. Hydrol., 282, 36– 55, 2003.
Viviroli, D. and Weingartner, R.: The hydrological significance of mountains – from regional to global scale, Hydrol. Earth Syst. Sci., 8, 1016–1029, 2004,
http://www.hydrol-earth-syst-sci.net/8/1016/2004/.
Wang, S., McGrath, R., Semmler, T., Sweeney, C., and Nolan, P.: The impact of the climate change on discharge of Suir River Catchment (Ireland) under different climate scenarios, Nat. Haz-ards Earth Syst. Sci., 6, 387–395, 2006,
http://www.nat-hazards-earth-syst-sci.net/6/387/2006/.
W¨ohling, T., Lennartz, F., and Zappa, M.: Technical Note: Updat-ing Procedure for Flood ForecastUpdat-ing with conceptual HBV-Type Models, Hydrol. Earth Syst. Sci., 10, 783–788, 2006,
http://www.hydrol-earth-syst-sci.net/10/783/2006/.
Zappa, M.: Multiple-response verification of a distributed hy-drological model at different spatial scales, Institute for At-mospheric and Climate Science, Dissertation No. 14895, ETH Zurich, available online at: http://e-collection.ethbib.ethz.ch/ show?type=diss&nr=14895, 2002.
Zappa, M. and Gurtz, J.: Simulation of soil moisture and evapo-transpiration in a soil profile during the 1999 MAP-Riviera Cam-paign, Hydrol. Earth Syst. Sci., 7, 903–919, 2003,
http://www.hydrol-earth-syst-sci.net/7/903/2003/.
Zappa, M., Pos, F., Strasser, U., Warmerdam, P., and Gurtz, J.: Seasonal water balance of an Alpine catchment as evaluated by different methods for spatially distributed snowmelt modelling, Nord. Hydrol., 34, 179–202, 2003.
Zemp, M., Haeberli, W., Hoelzle, M., and Paul, F.: Alpine glaciers to disappear within decades?, Geophys. Res. Lett., 33, L13504, doi:10.1029/2006GL026319, 2006.