HAL Id: hal-00304884
https://hal.archives-ouvertes.fr/hal-00304884
Submitted on 1 Jan 2004HAL is a multi-disciplinary open access archive for the deposit and dissemination of sci-entific research documents, whether they are pub-lished or not. The documents may come from teaching and research institutions in France or abroad, or from public or private research centers.
L’archive ouverte pluridisciplinaire HAL, est destinée au dépôt et à la diffusion de documents scientifiques de niveau recherche, publiés ou non, émanant des établissements d’enseignement et de recherche français ou étrangers, des laboratoires publics ou privés.
selected trace metals during the 2002 summer flood in
the River Elbe (Germany) at Magdeburg monitoring
station
M. Baborowski, W. von Tümpling, Jr., K. Friese
To cite this version:
M. Baborowski, W. von Tümpling, Jr., K. Friese. Behaviour of suspended particulate matter (SPM) and selected trace metals during the 2002 summer flood in the River Elbe (Germany) at Magdeburg monitoring station. Hydrology and Earth System Sciences Discussions, European Geosciences Union, 2004, 8 (2), pp.135-150. �hal-00304884�
Behaviour of suspended particulate matter (SPM) and selected
trace metals during the 2002 summer flood in the River Elbe
(Germany) at Magdeburg monitoring station
M. Baborowski, W. von Tümpling, jr. and K. Friese
UFZ Centre for Environmental Research Leipzig-Halle, Department of Inland Water Research, Brückstrasse 3a, 39114 Magdeburg, Germany Email for corresponding author: [email protected]
Abstract
In August 2002, in the worst flooding in more than 100 years, the River Elbe destroyed built-up areas and caused widespread erosion and the relocation of soils and river sediments. To assess the pollutants entering the water, surveys of dissolved constituents and suspended particulate matter (SPM) were carried out daily during the flood at a monitoring station near Magdeburg. The sampling point is part of the network of the International Commission for the Protection of the Elbe (ICPE). The results were compared with those of previous flood studies which used the same sampling strategy. Unlike past floods, the 2002 flood was characterised by the transport of relatively fine suspended material with a low mass concentration. Owing to different input sources, the maxima of dry weight and of particle number concentration occurred at different times. Hg, Fe, Mn, Zn, Cu, Ni and Cr showed a maximum concentration concurrent with the dry weight of the SPM, whereas the maximum concentrations of As, Pb, and Cd coincided with the particle number concentration peak. The concentration of particulate matter decreased rapidly, unlike the concentrations of dissolved substances such as DOC and trace metals, as well as the values of UV extinction, all of which remained high for a longer period. Comparing the results of the 2002 flood with the winter floods in 1995, 1999 and 2000, revealed increased values of As and Pb as well as higher concentrations of dissolved compounds.
Keywords: river, flood, transport, suspended particulate matter, trace metals, dissolved compounds, Elbe
Introduction
The transport of particulate and dissolved matter during a flood in large river basins depends on the spatial and temporal variability of rainfall in the catchment area. Furthermore, the hydraulic properties and the state of pollution in the river basin are of prime importance.
In August 2002, severe precipitation for a number of days within a developing Vb weather pattern (Schanze, 2002; Roth, 1996) over much of the upper catchment of the River Elbe caused the Czech Republic and Germany to suffer the worst flooding in the Elbe for more than 100 years. Such a rare event of air masses being diverted further south from their usual westeast direction was classified by the Dutch meteorologist W.J. van Bebber (18411905) as a Vb (5b) weather situation. The air masses, warmed over the Mediterranean, become heavily loaded with moisture, so that if they cross the Alps from south to north and hit colder air masses, extremely heavy rainfall can result within a short
period of time. In the August 2002 case, nearly all the reservoirs in the upper Elbe catchment were filled quickly and spilled over so that the water in the river exceeded record levels dating back to 1845 (Simon, 2002).
The resulting flooding and destruction in built-up areas caused widespread erosion and relocation of soils and river sediments. As well as disaster management to protect the lives and property of those at risk, the impairment of water quality by the pollutants transported by the flood water had to be addressed. Notwithstanding the recent regeneration of the Elbe ecosystem (Guhr et al., 1996, 1998, 2000; Lehmann and Rode, 2001), it was feared that deterioration of the water quality would have a negative impact on the ecosystem in the long term.
Numerous special regional measurement programmes were launched by public authorities and research centres to assess the pollution (Nies et al., 2003a; Reincke, 2003; Heininger et al., 2003 ). The findings were generally
evaluated by comparison with the mean concentrations in previous years under normal flow conditions, rather than those from previous flooding, perhaps because of the difficulties of comparing floods owing to their different hydrological development. This raises the question of the most suitable measuring and assessment strategy. In the area of the middle Elbe in particular, hysteresis effects play a major part in the transport of suspended matter (Spott and Guhr, 1996); following a flood, a state of equilibrium in sediment deposits will not be reached until two or three months later (Truckenbrodt and Einax, 1995). Therefore, when sampling sediment, care must be taken in assessing the representativity of the time of sampling.
Using the sampling strategy applied to previous flood investigations (Spott and Guhr, 1996; Baborowski, 2002), surveys of dissolved constituents and particulate matter were made at the Magdeburg monitoring station in August 2002. To assess the differences in pollutants entering the water phase during the 2002 summer flood, the results were compared with those from past floods in winter 1995, 1999 and 2000.
Study site
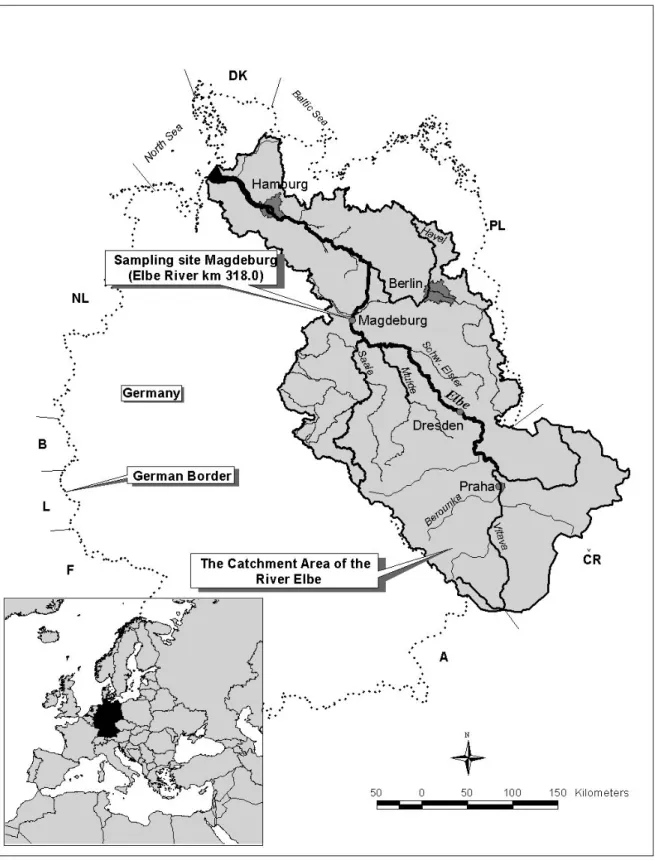
CATCHMENT AREAThe River Elbe basin (Fig. 1) covers 148 268 km², including 50 176 km² in the Czech Republic (63.6% of the Czech Republic) and 96 932 km2 in Germany(27.2% of Germany).
Less than 1% of the total catchment area is in Austria (920 km²) and Poland (240 km²) combined. The River Elbe is around 1100 km long, with approximately 372 km flowing through the Czech Republic and 728 km through Germany. The Elbe rises in the Sudeten Mountains (also known as the Giant Mountains, Czech Republic), 1384 m a.s.l. The river flows into the North Sea at Cuxhaven, near Hamburg (Germany). The main tributaries are the Vltava and Berounka in the Czech Republic, and the Schwarze Elster, Mulde, Saale and Havel in Germany.
HYDROLOGY
Mean annual discharge rates of the Elbe are 313.8 m³ s1
(9.9 × 10⁹m³ a1) at the CzechGerman border profile and
877.3 m³ s1 (27.7 × 10⁹m³ a1) at the estuary flowing into
the North Sea (Simon, 1995). Large areas of the catchment lie in low mountain ranges, so that the discharge reflects mainly the precipitation there. Also, the Sudeten Mountains and the Bohemian Forest influence the discharge rate in the Czech part of the Elbe, the Erzgebirge mountains affect the Mulde, whereas the Thuringian Forest and the Harz mountains primarily affect the Saale. The lowlands of the
Elbe are characterised by broad floodplains where changes in river levels affect the groundwater levels in the valleys. The Elbe is fed by rain and snow, its discharge behaviour usually being determined by winter and spring floods. From 1800 to 1994, 81% of the flood events occurred in the spring. At the Barby gauge upstream of the city of Magdeburg, 86% of all flooding between 1895 and 1994 took place between December and April (Simon, 1995).
MORPHOLOGY
The discharge in the Czech part of the Elbe is regulated by lock-and-weir systems and reservoirs. A canalised stretch 170 km in length contains 21 weirs with navigation locks (Simon, 1995). Downstream of the final Czech barrage, 600 km of the total length of the river is free of dams and, although approximately 485 km of this stretch is influenced by around 6900 groynes (Fig. 2), it ends with a barrage weir with a lock at Geesthacht (river km 586), upstream of Hamburg. The rest of the Elbes course between Geesthacht and the estuary where it flows into the North Sea (approximately river km 728) is subject to tidal influences. The Elbe region is characterised by a soil mosaic structure with alternating types. Alluvial deposits which form fluvisols are located along the river. The river flat is bordered by terraces of sands and sandy gravels, which constitute the substrate forming the brown arenic soil. Most of the mountain soils are extremely acidic with a pH of 3.54.5 and high levels of humate and fulvic acids (Borovec, 2000). At the point where the Elbe enters the central and north German lowlands, its bed is loose and prone to erosion, with common grain sizes ranging between 0.52.0 mm. Following the regulating measures on the Elbe, especially the artificial bank protection by groynes, bank coverings, guide banks and flood protection dams, inputs of energy can act only vertically in the direction of the riverbed. This encourages deep erosion, particularly of the bed (Simon, 1995). In contrast, fine sediments accumulate in backwaters such as groyne fields, where they may be remobilised by shipping at low water or by flushing at high water (Spott and Guhr, 1996). Shipping and high water make a distinct contribution to the downstream transport of suspended matter.
The catchment areas of the Mulde and the Saale also contain lock-and-weir systems and reservoirs which are important for not only the discharge rate but also the transport of suspended matter.
POLLUTION STATUS
The Elbe catchment is used intensively by industry and agriculture. Prior to German reunification, East German
Fig. 1. Catchment area of the River Elbe with main tributaries and Magdeburg monitoring station (Map: O. Büttner, UFZ Centre for
Environmental Research Leipzig - Halle).
industrial activities combined with inadequate or non-existent wastewater treatment resulted in the river and its sediments becoming highly polluted (Meissner et al., 1994; Brügmann, 1995; Reincke, 1995; Müller and Furrer, 1995;
Guhr, 1995; Gerlach and Gimbel, 1996; Heininger and Pelzer, 1998; Friese et al., 2000). Discharges from pulp and pharmaceuticals industries as well as of municipal sewage were characteristic of the upper Elbe valley. The central
Fig. 2. Aerial photograph of the middle part of the River Elbe with characteristic groyne fields.
section, partly contaminated by agricultural usage and municipal sewage, was severely polluted by wastewater from the mining and chemical industries based alongside the Mulde (Kluge et al., 1995) and Saale (Einax et al., 1999) tributaries. Their input increased the levels of pollutants such as degradable and persistent organic compounds, salt, heavy metals and organic micropollutants, as well as ammonium and phosphorus.
Following German reunification in 1990, the water quality improved in direct response to the closure of many industrial plants, the construction of wastewater treatment plants and the reduction in livestock farming (Guhr et al., 1996, 1998, 2000; Lehmann and Rode, 2001; Spott, 1995).
The reduction in wastewater and sewage discharges also resulted in a distinct reduction in trace pollutants; cutting them further requires eliminating any point sources still existing and, above all, limiting pollution from diffuse sources (Guhr, 2001). Outputs of particulate bound trace substances from lock-and-weir systems and groyne fields during the course of extreme situations are important in this respect (Spott and Guhr, 1996). Similarly, exchange processes at the sedimentwater interface influence, significantly, the transport of trace contaminants in the river. A flux of heavy metals from sediment pore water into the
water phase under oxic conditions resulted from the mineralisation of organic matter (Petersen et al., 1995). The re-suspension of river sediments at times of increased riverbed shear stress, during flooding or dredging/relocation, can also cause the oxidation-related release of trace substances from pore water into the water phase (Patrick and Verloo, 1998).
SAMPLING SITE
The sampling site, part of the International Commission for the Protection of the Elbe (ICPE) monitoring programme, is situated near the city of Magdeburg on the left bank at river km 318 (Fig. 1). The water quality of this section hinges on the quality of the upper stretches of the Elbe (input from the Czech Republic and the Dresden industrial region) and on the confluence of the polluted tributaries Mulde and Saale. Under normal discharge conditions, the sampling station therefore represents the pollution situation of the middle Elbe.
Table 1 contains a survey of the discharge conditions at, and upstream of, the monitoring station. The confluences of the Mulde and the Saale are 59 km and 27 km respectively upstream of the sampling site on the left bank. Another
tributary flowing into the right bank of the Elbe 119.5 km upstream is the Schwarze Elster. However, due to its position and its low discharge, it is only of minor importance for the water quality at the monitoring station. Upstream and downstream of the monitoring station, the Elbe is regulated on both sides by groyne fields. On the right bank of the Elbe, 17.2 km upstream is Pretzien Weir, located in the 27 km long flood channel (www.pretziener-wehr.de); its main functions are:
l raising the water level for shipping on the Elbe at low
water;
l protecting the by-pass channel from flooding at mean
water;
l diverting the high-water peak from the Elbe during high
water.
Between its completion in 1875 and the August flooding in 2002, Pretzien Weir was opened 50 times in winter and 8 times in summer.
During a high water event, all the flats upstream of the weir are flooded, resulting in some 68 × 106m³ of water
being retained. When the water level rises above a certain limit at Barby gauge, the weir is opened, enabling about 35% of the total volume of water to be discharged (maximum high-water flow: 1800 m³ s1). During the August 2002 flood
(Fig. 3) the discharge rate was about 1000 m3s1 (Simon,
2002).
Methodology
SURVEY STRATEGYThe first significant event during the course of a flood wave in the area of the middle Elbe is the submersion of the groyne heads of the groyne fields. During this process, erosion causes all the non-consolidated sediment which was deposited before the flood to be re-suspended and enter the
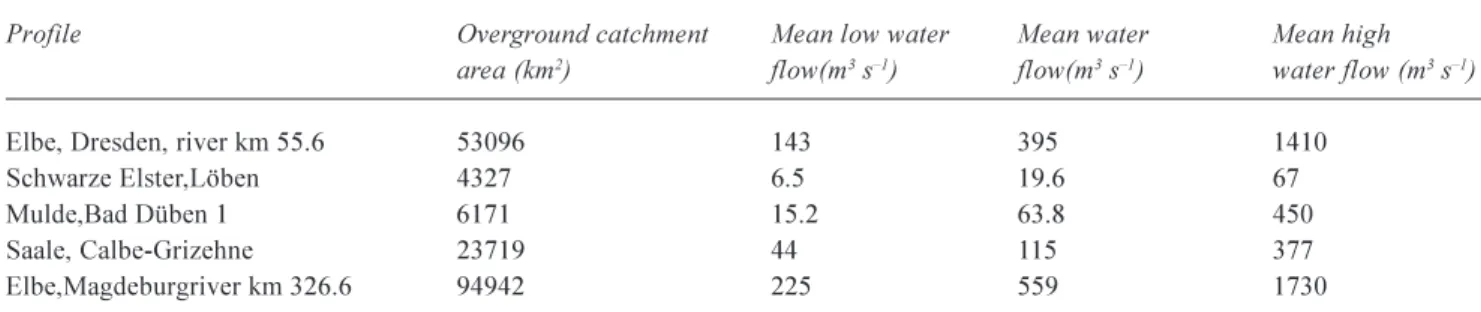
Table 1. Flow characteristics of some relevant Elbe profiles and the tributaries Schwarze Elster, Mulde and Saale (Elbe:serial 1931/ 2000,Schwarze Elster: serial 1974/2000, Mulde: serial 1961/2000, Saale: serial 1932/2000, after German hydrology almanac(Deutsches Gewässerkundliches Jahrbuch, 2000)
Profile Overground catchment Mean low water Mean water Mean high area (km2) flow(m3s1) flow(m3s1) water flow (m3s1)
Elbe, Dresden, river km 55.6 53096 143 395 1410
Schwarze Elster,Löben 4327 6.5 19.6 67
Mulde,Bad Düben 1 6171 15.2 63.8 450
Saale, Calbe-Grizehne 23719 44 115 377
Elbe,Magdeburgriver km 326.6 94942 225 559 1730
Fig. 3. Digital aerial view of the inlet channel to the Pretzien weir at
normal flow (9.06.2000, Q Magdeburg: 301 m3/s ) and flood
(20.08.2002, Q Magdeburg: 3910 m3/s ). Picture: GEOSPACE/
flood wave. As a result, for a brief time, the water phase of the main flow contains considerably higher concentrations of suspended matter and pollutants. These concentration maxima occur some days before the maximum discharge (Fig. 4) and provide a measure of the easily erodable substances deposited in the groyne fields near the monitoring station before the flood. All other elevated substance concentrations measurable in the flood wave reflect inputs upstream of the monitoring station as well as inputs from tributaries.
Hence, the measuring strategy requires knowledge of the discharge threshold at which the groyne heads are submerged. In the area of Magdeburg monitoring station, the discharge threshold is about 800 m³ s1 (Spott and Guhr,
1996). As high water occurs, whenever the threshold is exceeded, samples are taken every day for at least two weeks. Afterwards weekly samples are taken as investigations continue.
ANALYTICAL METHODS
The SPM content was measured in accordance with German Industrial Standards (DIN 38409 part H2). Dry weight (dried for two hours at 105°C) and loss on ignition (ignited for four hours at 500°C) were determined from 500 ml sample water filtered onto Whatman GF/F glass fibre filter (vacuum filtration method, 200 mbar). A portable optical instrument (Aucoteam, Germany)(Baborowski, 1999, 2002) enabled the particle size distribution to be determined within the SPM directly after sampling. The instrument works on the basis of single particle evaluation (visual light, spherical equivalent diameter). Although the measuring range quoted by the manufacturer is 2200 µm, serial measurements in
the water resulted in the instrument providing reproducible results for a particle size of 1.8 µm.
To analyse DOC and UV, samples were filtered using 0.45 µm PVDF Millipore syringe filters. DOC was measured using a carbon analyser (Dimatec, Germany) by the direct injection of 250 µl filtered water. UV (Dr. Lange, Germany) is calculated as extinction at 254 nm.
Element analysis was conducted using the following techniques:
l optical emission spectrometry with inductive coupled
plasma (ICP/OES) for Fe, Mn and Zn;
l atomic absorption spectrometry (AAS) for Hg (cold
vapour technique);
l mass spectrometry with inductive coupled plasma
(ICP-MS) for As, Cd, Cr, Pb, Cu and Ni.
Filtered and unfiltered acidified samples were used for the analysis.
The dissolved elements were separated from the SPM immediately after sampling (syringe filters, Minisart, non-pyrogenic, 0.45 µm). The filtrate was stabilised with HNO3.
Unfiltered samples were measured after microwave digestion with HNO3/H2O2.
Hereafter, element concentrations in unfiltered samples are referred to as totals, while element contents from filtered samples are referred to as dissolved. Particulate concentrations are calculated from the difference between total and dissolved. River Elbe samples are characterised by a siliceous and organically based matrix. One of the aims of using HNO3/H2O2 digestion was to detect the influence
of changes in the composition of the matrix on trace element transport in the Elbe after German reunification.
ASSESSMENT
Owing to their usually different hydrological background in the various sections of a catchment area, floods can only partly be compared and analysed statistically. Moreover, during a flood wave, different processes take place at different scales, sometimes in parallel and sometimes one after the other. The usual methods of multivariate data analysis may lead to misinterpretation if qualitatively different processes are treated equally in the same set of data, e.g.:
l increased concentrations owing to the re-suspension of
groyne field suspended matter due to erosion as the water level starts to rise;
l dilution as the water level rises whenever erodable
substances are no longer available;
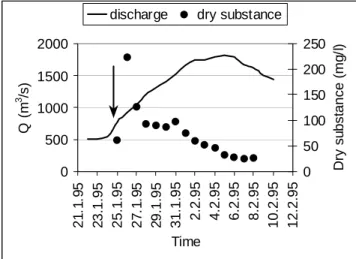
l renewed increases in concentration owing to the Fig. 4. Trend of discharge and dry substance during the winter 1995
flood at Magdeburg monitoring station, left bank, river km 318 (l discharge threshold for resuspension of groyne field sediments).
0 500 1000 1500 2000 2 1 .1 .9 5 23 .1 .9 5 25. 1. 95 2 7 .1 .9 5 29 .1 .9 5 31. 1. 95 2. 2. 95 4. 2. 95 6. 2. 95 8. 2. 95 10. 2. 95 12. 2. 95 Time Q ( m 3 /s ) 0 50 100 150 200 250 D ry s u bst ance ( m g /l )
subsequent arrival of eroded material from the reaches of tributaries or the hinterland of the monitoring station;
l renewed dilution when the newly arrived material has
moved on and no further erosion takes place.
To compare and assess measurements from current and past floods, only the maxima attained by each substance during the measuring campaign have been compared. Displayed in network graphs, they produce a fingerprint indicating common characteristics and differences between individual parameters as well as different types of flooding. This type of assessment is justified if sampling is started promptly once the threshold of about 800 m³ s-1 is exceeded.
Furthermore, only data from floods with a flooded by-pass channel were used in the analysis, ensuring that at least the flood conditions upstream of the monitoring station were similar.
Results
AUGUST 2002 FLOOD
Measurements of suspended particulate matter were maximal a few days before the flood crest. Contrary to the results of previous investigations, the maximum values for dry substance and particle number concentration did not coincide (Fig. 5). The maximum of the SPM values was measured on the third day of sampling, one day before the maximum of the particle number concentration occurred. Dry substance was more closely related to the coarse particles of SPM (Fig. 6). Mostly relatively fine material was transported during the flood (Fig. 7). However, values of both particle number and mass concentrations decreased
Fig. 5. Trend of discharge, particle number concentration (1.8-200
µm) and dry substance during the summer 2002 flood at Magdeburg monitoring station. 0 1000 2000 3000 4000 12. 8 14 .8 16 .8 18 .8 20 .8 22. 8 24. 8 26 .8 28 .8 30 .8 Time Q ( m 3 /s ), p a rt ic le n u m ber (10 5 /l) 0 20 40 60 80 Dry su bs tanc e (m g /l ) Q 1.8-200 µm dry substance
Fig. 6. Trend of dry substance vs. particle number concentration >
20-200 µm (calculated from single particle measurements) during the summer 2002 flood at Magdeburg monitoring station.
0 20 40 60 80 12 .8 14 .8 16 .8 18 .8 20 .8 22 .8 24 .8 26 .8 28 .8 30 .8 Time D ry s ubs ta nc e ( m g/ l) 0 20 40 60 80 P a rt ic le nu m b e r (1 0 5 /l ) dry substance > 20-200 µm
Fig. 7. Change (top) and mean composition (bottom) of the fine
particles of SPM (fractions calculated from single particle measure-ments) during the Elbe 2002 flood at Magdeburg monitoring station.
0 800 1600 2400 3200 12 .8 14 .8 16 .8 18 .8 20 .8 22 .8 24 .8 26 .8 28 .8 30 .8 Time P a rt ic le nu mber ( 1 0 5 /l ) 1.8-200 µm 1.8-20 µm 1.8-10 µm 1.8-5 µm
Cumulative particle fraction
100 98 86 56 48 0 20 40 60 80 100 1.8-2 µm 1.8-5 µm 1.8-10 µm 1.8-20 µm 1.8-200 µm Particle fraction % o f to ta l fr a c ti o n
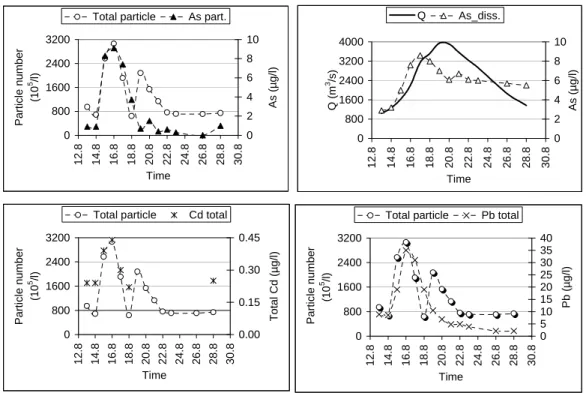
rapidly after the maximum values had been reached. The heavy metals also behaved differently. Particulate bound Fe, Mn, Zn, Cu, Ni, as well as total Cr and total Hg reached their peaks simultaneously with the maximum of
dry substance (Fig. 8), while the maximum concentrations of particulate As and Pb as well as total Cd coincided with the particle number concentration peak (Fig. 9).
Dissolved trace metals as well as DOC and UV values
Fig. 8. Trend of dry substance (DS) related transport of trace metals considering by way of example Ni and Fe with particulate (left) and
dissolved (right) part, summer 2002 flood.
0 800 1600 2400 3200 4000 12.8 14.8 16.8 18.8 20.8 22.8 24.8 26.8 28.8 30.8 Time Q ( m 3 /s ) 0 2 4 6 Ni (µ g /l) Q Ni dissolved 0 20 40 60 80 12.8 14.8 16.8 18.8 20.8 22.8 24.8 26.8 28.8 30.8 Time DS (m g /l) 0 2 4 6 Ni (µ g /l)
dry substance Ni particulate
0 800 1600 2400 3200 4000 12.8 14.8 16.8 18.8 20.8 22.8 24.8 26.8 28.8 30.8 Time Q ( m 3 /s ) 0 40 80 120 160 Fe (µ g /l) Q Fe dissolved 0 20 40 60 80 12. 8 14. 8 16. 8 18. 8 20. 8 22. 8 24. 8 26. 8 28. 8 30. 8 Time DS ( m g /l) 0 800 1600 2400 3200 Fe ( µ g /l )
dry substance Fe particulate
0 800 1600 2400 3200 4000 12.8 14.8 16.8 18.8 20.8 22.8 24.8 26.8 28.8 30.8 Time Q ( m 3/s ) 0 2 4 6 8 10 As ( µ g/l) Q As_diss. 0 800 1600 2400 3200 12.8 14.8 16.8 18.8 20.8 22.8 24.8 26.8 28.8 30.8 Time Par ti c le number (1 0 5 /l ) 0 2 4 6 8 10 As ( µ g/l)
Total particle As part.
0 800 1600 2400 3200 12.8 14.8 16.8 18.8 20.8 22.8 24.8 26.8 28.8 30.8 Time Par ti c le number (1 0 5 /l ) 0 5 10 15 20 25 30 35 40 Pb ( µ g/l)
Total particle Pb total
0 800 1600 2400 3200 12.8 14.8 16.8 18.8 20.8 22.8 24.8 26.8 28.8 30.8 Time Par ti c le number (1 0 5 /l ) 0.00 0.15 0.30 0.45 T o ta l C d ( µ g /l)
Total particle Cd total
Fig. 9. Trend of particle related transport of trace metals considering by way of example As, Cd and Pb, dissolved As fraction (top right),
increased with discharge. However, unlike the particulate
matter, their concentrations remained elevated for longer (Figs. 8, 9 and 10). Table 2 overviews the variation of tracemetals during the summer flood. COMPARISON WITH PREVIOUS FLOOD
INVESTIGATIONS
Flooding occurred in 1995, 1999 and 2000, necessitating the opening of Pretzien Weir. Discharge rates and the sampling carried out in line with the measuring strategy are surveyed in Fig. 11.
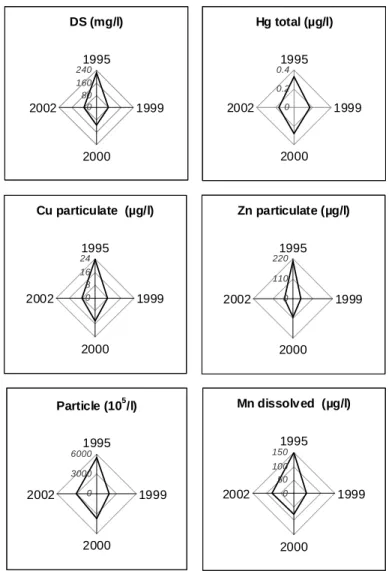
The maxima of the trace elements studied during flooding can be grouped as follows:
l significantly increased concentrations in 2002;
fingerprint similar to discharge: levels of particulate As, dissolved As, total Pb, dissolved Fe, dissolved Cu (Fig. 12);
l not significantly increased in 2002; fingerprint
comparable with the SPM dry substance: levels of total Hg, particulate Fe, particulate Cu, particulate Zn, dissolved Zn, total Cd (Fig. 13);
l not significantly increased in 2002; fingerprint
comparable with the total particle number concentration: particulate Mn, dissolved Mn (Fig. 13).
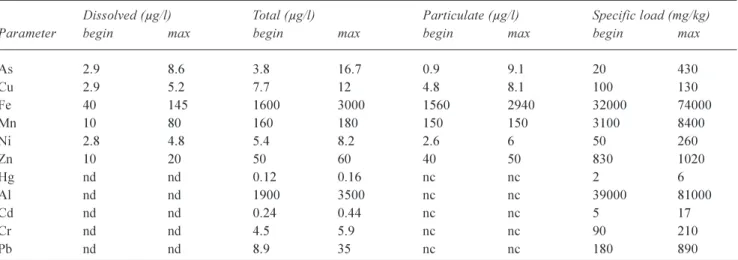
The concentrations of Ni (dissolved and total content) and Cr (total content) were not significantly increased in 2002 either but were not correlated with discharge, dry substance or particle number concentration. The results are also reflected by time-resolved measuring series (Figs. 14 and 15). For comparability of the seasonally different events, the point at which the discharge threshold was exceeded is shown as the reference point for the start of sampling. Table 2. Variation of trace elements and As during the summer 2002 flood in the River Elbe, Magdeburg monitoring station, left bank, river km 318. (nd: not detectable, nc: not calculable, begin: beginning, max: maximum value of recorded data). Note that the maximum concentration of the different fractions did not occur at the same time.
Dissolved (µg/l) Total (µg/l) Particulate (µg/l) Specific load (mg/kg)
Parameter begin max begin max begin max begin max
As 2.9 8.6 3.8 16.7 0.9 9.1 20 430 Cu 2.9 5.2 7.7 12 4.8 8.1 100 130 Fe 40 145 1600 3000 1560 2940 32000 74000 Mn 10 80 160 180 150 150 3100 8400 Ni 2.8 4.8 5.4 8.2 2.6 6 50 260 Zn 10 20 50 60 40 50 830 1020 Hg nd nd 0.12 0.16 nc nc 2 6 Al nd nd 1900 3500 nc nc 39000 81000 Cd nd nd 0.24 0.44 nc nc 5 17 Cr nd nd 4.5 5.9 nc nc 90 210 Pb nd nd 8.9 35 nc nc 180 890
Fig. 10. Trend of UV and DOC values during the summer 2002 flood
at Magdeburg monitoring station.
0 1000 2000 3000 4000 12 .8 14 .8 16 .8 18 .8 20 .8 22 .8 24 .8 26 .8 28 .8 30 .8 Time Q (m 3 /s ) 0.000 0.100 0.200 0.300 0.400 Q UV extinction at 254nm 0 1000 2000 3000 4000 12 .8 14 .8 16 .8 18 .8 20 .8 22 .8 24 .8 26 .8 28 .8 30 .8 Time Q ( m 3 /s ) 0 2 4 6 8 10 12 DO C ( m g/ l) Q DOC
0 1000 2000 3000 4000 1. 1 21 .1 10 .2 1. 3 21 .3 10 .4 30 .4 20 .5 9. 6 29 .6 19 .7 8. 8 28 .8 17 .9 Time of year Q ( m 3 /s ) 1995 Samples1995 1999 Samples1999 2000 Samples 2000 2002 Samples 2002
Fig. 11. Discharge and sampling (marked with special dots) during
the winter floods 1995, 1999 and 2000 as well as the summer 2002 flood at Magdeburg monitoring station.
Fig. 12. Comparison of the maxima of significantly elevated parameters in 2002 compared to the floods in 1995, 1999 and 2000.
Fe dissolved (µg/l) 0 75 1501995 1999 2000 2002 Q (m3/s) 0 2000 40001995 1999 2000 2002 As particulate (µg/l) 0 5 101995 1999 2000 2002 As dissolved (µg/l) 0 5 101995 1999 2000 2002 Cu dissolved (µg/l) 0 3 6 1995 1999 2000 2002 Pb total (µg/l) 0 20 401995 1999 2000 2002
Values for UV and DOC exist only for the floods in 1999 (UV) and 1995 (DOC). The UV values measured during the summer flooding in 2002 (0.180.34) were considerably higher than during the 1999 flood (0.130.14). Similarly, the 2002 DOC values (6.110.8 mg l1) were much higher
than in 1995 (3.96.8 mg l1).
Discussion
AUGUST 2002 FLOOD AT MAGDEBURG MONITORING STATION
The different course of the concentrations of dry substance and particles as discharge increases (Fig. 5) allows the data to be interpreted regarding the origin of the SPM.
Fig. 13. Comparison of the maxima of non-significantly elevated parameters in 2002 compared to the floods in 1995, 1999 and 2000 (selected examples). DS (mg/l) 0 80 160 2401995 1999 2000 2002 Hg total (µg/l) 0 0.2 0.41995 1999 2000 2002 Cu particulate (µg/l) 0 8 16 241995 1999 2000 2002 Zn particulate (µg/l) 0 110 2201995 1999 2000 2002 Particle (105/l) 0 3000 60001995 1999 2000 2002 Mn dissolved (µg/l) 0 50 100 1501995 1999 2000 2002
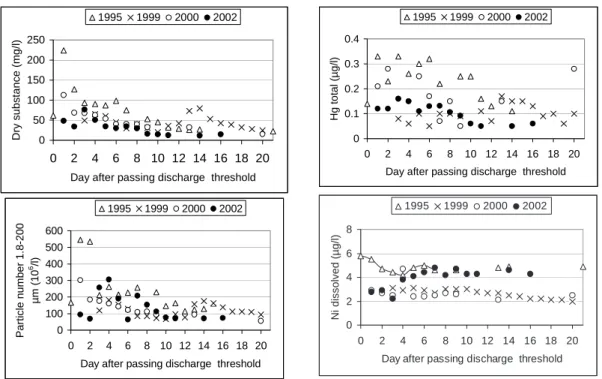
Fig. 14. Change in concentration of significantly elevated elements compared to previous years (selected examples) after exceeding threshold
value (800 m3/s), Magdeburg monitoring station, left bank of the Elbe, river km 318.
0 2 4 6 8 10 0 2 4 6 8 10 12 14 16 18 20 Day after passing discharge threshold
As particulate (µ g/l) 1995 1999 2000 2002 0 2 4 6 8 10 0 2 4 6 8 10 12 14 16 18 20 Day after passing discharge threshold
As di ssol v ed ( µ g/ l) 1995 1999 2000 2002 0 5 10 15 20 25 30 35 40 0 2 4 6 8 10 12 14 16 18 20 Day after passing discharge threshold
Pb total (µ g/l) 1995 1999 2000 2002 0 1 2 3 4 5 6 0 2 4 6 8 10 12 14 16 18 20 Day after passing discharge threshold
Cu dissolved (µ
g/l)
The level of re-suspended particulate matter from the groyne fields in August 2002 after the discharge threshold had been exceeded (> 800 m³ s1) is low compared with the
previous flood events studied (Fig. 15). This can probably be attributed to the relatively high discharges at the beginning of 2002 (Fig. 11), which led to the repeated flushing of erodable groyne field sediments. Cyclically decreasing SPM concentrations in the case of Elbe flood waves following each other in quick succession have been described in detail (Spott and Guhr, 1996). However, the concentrations of particle numbers (95 × 106 l1) and of dry
substance (48.4 mg l1) at the start of the measuring
campaign are characteristic of low-water situations in the Elbe in the summer near Magdeburg (Baborowski, 2002). Such situations are also typical of the high concentrations of particulate manganese at the start of the investigation. (Table 2).
The brief drop in particle number concentration (by 28% to 69 × 106 l1) and dry substance (by 29% to 34.4 mg l1)
on the following sampling day can be attributed to the decline in the proportion of phytoplankton within the SPM. The dynamics of phytoplankton in the Elbe are characterised by succession in the summer months (Karrasch et al., 2001a) and abrupt depression and flushing when the water level starts to rise in connection with a flood wave. This process, which leads to distinctly declining oxygen concentrations as a result of reduced photosynthesis activity, has been
described in detail for the summer flooding of the Elbe in 1996 and 1997 (Spott, 1998).
When interpreting inputs during the further course of the flood wave, the following events are relevant:
i. the maximum concentration of the dry weight of SPM was reached on 15.08.02
ii. the maximum particle number concentration was reached on 16.08.02
iii. the renewed increase in dry weight and particle number concentration on 19.08.02 at the time of the flood crest in Magdeburg
(i) At the Dresden river gauge (river km 55.3), an initial flood crest on 11.08.02 (561 cm) was followed by a second, higher one on 13.08.02 (716 cm) caused by more heavy rainfall in the Erzgebirge mountains where the soil was saturated already. The maximum water level at the Dresden river gauge was reached on 17.08.02 (940 cm), when the wave with the water from the Czech tributaries passed the city (Reincke, 2003). In response to the decreasing gradient, increasing retention by a broadening profile and a number of dyke breaches along the river, the three crests recorded at Dresden merged into a single crest with a rising phase of varying steepness (Landesamt für Umweltschutz Sachsen-Anhalt, 2003). The flood-wave crest moved between Schöna (CzechGerman border profile) and Torgau (upstream of Magdeburg, river km 154.2) at a speed of 1.41.5 m s1 and
Fig. 15. Change in concentration of non-significantly elevated elements compared to previous years (selected examples) after exceeding
threshold value (800 m3/s), Magdeburg monitoring station, left bank of the Elbe, river km 318.
0 100 200 300 400 500 600 0 2 4 6 8 10 12 14 16 18 20
Day after passing discharge threshold
P a rt ic le num ber 1. 8-200 µm ( 1 0 6/l ) 1995 1999 2000 2002 0 50 100 150 200 250 0 2 4 6 8 10 12 14 16 18 20
Day after passing discharge threshold
Dr y s ubs tanc e ( m g/l ) 1995 1999 2000 2002 0 0.1 0.2 0.3 0.4 0 2 4 6 8 10 12 14 16 18 20
Day after passing discharge threshold
Hg to ta l ( µ g /l) 1995 1999 2000 2002 0 2 4 6 8 0 2 4 6 8 10 12 14 16 18 20
Day after passing discharge threshold
Ni dis s o lv ed (µ g/ l) 1995 1999 2000 2002
from Torgau to Wittenberge (downstream of Magdeburg, river km 454.5) at a speed of 1.11.3 m s1 (Reincke, 2003).
Extrapolating the mean flow speeds to the stretch between Dresden and Magdeburg (total length 262.7 km) results in a delay of about 2 days and 9 hours before the flood crest recorded at Dresden reached the monitoring station at Magdeburg.
The maximum dry residue at the Magdeburg monitoring station was measured on 15.08.02, two days after the second flood crest was recorded at Dresden. A second increase in dry substance and particle number concentration (less pronounced owing to dilution) occurred on 19.08.02, again two days after the highest level had been recorded at Dresden. The SPM and particulate trace metal concentrations measured on these days reflect the inputs caused by erosion in the upper course of the Elbe in connection with the flood waves. Consequently, concentrations of particulate Cr, Fe, Cu, Mn, Ni, Hg and Zn relevant to the water quality at Magdeburg were input from the upper course of the Elbe.
(ii) Why did the dry substance and particle concentration maxima occur at different times? Given the spatial distribution of rainfall in the Elbe catchment area, of the main German tributaries only the Mulde was involved in the flooding. The flood crest of the Mulde entered the Elbe (river km 259) on 15.08.03. On this day, the maximum SPM concentration at Magdeburg monitoring station 59 km downstream of the confluence was measured. On 15.08.03, Pretzien Weir (Elbe km 300.8) was also opened, lowering the water level at Magdeburg by about 0.4 m. Therefore, the crest of the Mulde flood wave further upstream discharges more easily into the Elbe, resulting in a smaller flood wave travelling ahead of the main Elbe wave. For the Magdeburg monitoring station, this means that the pollutants related to the Mulde flood show up separately from those originating from the upper course of the Elbe. They are characterised by the maximum particle number concentration and maximum concentrations of particulate As and Pb as well as total Cd. During the flood, the Mulde reservoir (containing about 118 × 106m³ water) 50 km
upstream of where the Mulde enters the Elbe and the adjacent Goitsche mining lake (Schultze et al., 2002) act as sediment and pollutant sinks, the importance of which has been demonstrated in long-term studies (Zerling et al., 2001). During the August 2002 flood, the input from the Mulde deposited five times more sediment on the reservoir bed than in previous floods since 1975 (Junge et al., 2003). Lake Goitsche, created following the cessation of lignite-mining, was flooded spontaneously with water from the Mulde when the dyke was breached, causing the volume of lake water to increase suddenly by about 90 × 106m³ to 260 × 106m³.
Indeed, deposits of sediment up to 5 m thick accumulated in some parts of the basin (Schultze et al., 2003). As larger particles settle more quickly, the flooding of Lake Goitsche and the Mulde reservoir caused a shift within the particle size distribution of SPM during the downstream transport of pollutants along the Mulde. Results derived from previous measurements in the water phase of the Elbe and its tributaries show that fine particles < 20 µm account for over 90% of the total particle number. By contrast, their proportion of mass and volume of the SPM is small. Consequently, for the mass of SPM, particles >20 µm are of prime importance (Baborowski, 2002). Owing to the storage capacities in its lower course, measurably higher concentrations of fine particles and comparatively lower SPM mass concentrations were transported into the Elbe by the Mulde flood wave compared to the waves which formed in the upper Elbe near Dresden. The shift towards fine rather than coarse particles during the transport of pollutants in dammed rivers has also been demonstrated for the Saale, a tributary of the Elbe, the lower course of which is dammed (Karrasch et al., 2001b).
(iii) At the time of the flood wave crest in Magdeburg on 19.08.03, the discharge of the Mulde and, hence, its influence on the particle concentration of the SPM had already diminished. As a result, the particle number concentrations and the dry substance increased simultaneously when the flood crest passed through Magdeburg.
The sedigraph peak of the particulate bound metals travelled in front of the hydrograph peak. The dissolved elements generally reached their maximum after the particulate substances and, in contrast to the rapidly dwindling particulate concentrations, their concentration remained high for some time. The high UV and DOC concentrations (Fig. 10) constantly increasing with the flood wave as well as the high colloid concentrations (Baborowski
et al., 2003) evidently had a stabilising effect on the transport
of dissolved heavy metals. The DOC content in a river depends on discharge and the proportions of geogenic and anthropogenic inputs. Investigations of the origin and fate of organic matter in the Elbe (Gerlach and Gimbel, 1996) showed that a significant part of the inputs from point sources, fixed in sediments during lower discharge rates, is remobilised by higher discharge rates and can then be interpreted as diffuse entries. Investigations of UV absorption, adsorbability and degradability (Gerlach and Gimbel, 1996) show that a considerable share of the DOC of the Elbe can be attributed to resistant humic substances. Since, after German reunification, the proportion of humic substances discharged by sewage plants declined significantly, the UV and DOC inputs during the flood wave
can be explained by being flushed out of the peat lands and soils of the mountains. Hence, in August 2002, after declining considerably since German reunification (1995 97: 0.110.16), the UV values reached 0.180.34, the same range as that which prevailed before reunification (1985 89: 0.260.45, Guhr et al., 2000). The DOC concentration of 6.110.8 mg l1 was also clearly above the values of 1992
94 (56 mg l1; Ludwig et al., 1997).
COMPARISON WITH PREVIOUS FLOOD INVESTIGATIONS
Compared with previous Elbe floods, the particulate concentrations of As and Pb and dissolved Cu concentrations from the Mulde were significantly higher. Eroded and illuviated pollutants in the upper course of the Elbe (Fe, Mn, Zn, Cu, Ni, Cr and Hg) were diluted and transported to the foreshores and floodplains because of the flooding and dyke breaches downstream of the monitoring station.
The ore and companion elements As, Pb and Cu are typical pollutants in the Mulde catchment area. They result from former mining activities as well as from the ore dressing and metallurgical industries (Kluge et al., 1995). The flood resulted in water entering drainage galleries in disused mines and in highly contaminated areas being flooded. Consequently, considerable amounts of contaminated water, sludge and dumped material entered the river.
However, although the concentrations of As, Pb and Cu were distinctly higher than in previous years, the pollutant loads transported during the flood in August 2002 did not affect the water quality in the German Bight (Nies et al., 2003b).
In July 1997, disastrous flooding also occurred on the River Odra owing to heavy rainfall during a Vb weather pattern, the states affected being the Czech Republic, Poland and Germany. Although the catchment area of the Odra, 118 861 km², is somewhat smaller than that of the Elbe, the long-term mean discharge rate (Hohensaaten river gauge) of 523 m³ s1 (Meyer, 2002) is comparable with the discharge
of the Elbe at Magdeburg.
The lower course of the Odra also contains groyne fields, polders and floodplains which are important in the transport of sediment in extreme hydrological situations (Engelhardt
et al., 1999). During investigations in the lower part of the
Odra in July 1997, the highest concentrations of particulate matter were found at the beginning of the flood wave (Lehmann et al., 1999); this result is consistent with the outcome of the present study. Whereas the concentrations of dissolved elements and specific suspended matter at the two monitoring stations were the same prior to the flood in the Elbe and the Odra, much higher concentrations of As,
Pb, Cd (from the Mulde) as well as of Cr and Ni (from the upper course of the Elbe) were transported in the Elbe in August 2002. In the Odra, the concentrations of Cu and Zn increased significantly compared to the Elbe perhaps because of coal-mining in the Odra catchment.
Conclusions
The study and assessment of flooding requires the development and application of measuring strategies which take into account the peculiarities of each catchment area. The method presented here enables different flood events in the middle Elbe to be compared on a sound scientific basis. Simultaneously measuring the concentration (dry weight) and particle size of the SPM as well as of dissolved and particulate trace metals facilitates a better understanding of the internal structure of the flood wave, analysis of which reveals the main input pathways of pollutants during flooding.
During the flooding in August 2002, the different types of water from different parts of the catchment area could be distinguished at the monitoring station in Magdeburg. The results revealed the persistent high potential trace metal pollution of the Elbe. Pollution peaks for many environmentally relevant trace metals from the upper course of the Elbe, especially Hg, were smaller than in previous years as they were diluted during the course of the flood wave. Nevertheless, significantly higher concentrations of As, Pb and Cu were measured. These elements originate in former mining areas in the catchment of the Mulde which represent a source of potentially serious contamination.
Since 1970, over 35 major mining accidents (published by UN) with serious consequences for the receiving water have been reported (Macklin et al., 2003). For example, tailing dam failures in January and March 2000 in Maramures county, north-west Romania, resulted in cyanides and large amounts of water and sediment contaminated with Pb, Zn, Cu and Cd entering the tributaries of the River Tisa, a major tributary of the Danube (Macklin
et al., 2003, Soldan et al., 2001).
To avoid ecotoxicological risks, not only must the safe operation of existing mines and waste deposits be ensured but the potential hazards from the legacy of disused mines both above and below the surface need to be identified.
Acknowledgements
The authors thank Ms Göring and Mr Becker at Magdeburg Environmental Laboratory of the Saxony-Anhalt Flood Protection Agency for their kind support when UFZs own laboratory could not be used due to the flooding. Special
thanks go to Raimo Kopetzky and Hans-Joachim Dahlke for their commitment during flood water sampling, as well as to Christina Hoffmeister, Renate Götzke, Andrea Hoff and Marlies Wengler for the element analyses and determining the organic sum parameters. The help of Kirsten Hennrich for discussion and careful reading of the manuscript is greatly appreciated.
References
Baborowski, M., 1999. Bestimmung der Partikelgrößenverteilung von suspendierten partikulären Stoffen mit dem Partmaster (Ss08). In: Methoden zur Erkundung, Untersuchung und Bewertung von Sedimentablagerungen und Schwebstoffen in Gewässern, U. Kern and B. Westrich (Eds.). D VWK Schrift
128. Wirtschafts- und Verlagsgesellschaft Gas und Wasser mbH.
Bonn, Germany. 383384.
Baborowski, M., 2002. Characterisation of Suspended Particulate Matter (SPM) in the River Elbe (Germany) by survey of the particle size distribution. In: Water Resources and Environment Research. Proceedings of ICWRER 2002, G. H. Schmitz (Ed.). Dresden, Germany. Volume II Matter and particle transport in surface and subsurface flow. 2327.
Baborowski, M., von der Kammer, F. and Friese, K., 2003. Transport von Schwermetallen bei Hochwasserführung der Elbe: gelöst, partikel- oder kolloidgebunden? In: Schadstoffbelastung im Mulde- und Elbe-Einzugsgebiet nach dem Augusthochwasser 2002. UFZ-Centre for Environmental Research (Ed.), Conference proceedings, Freiberg, 27.-29.08.03, KDD GmbH, Nürnberg, Germany. 1721.
Borovec, Z., 2000. Elements in size - fractionated bottom sediments of the Elbe River in its Czech part. Aquat. Sci., 62, 232251.
Brügmann, L., 1995. Metals in sediments and suspended matter of the river Elbe. Sci. Total Envir., 159, 5365.
Deutsches Gewässerkundliches Jahrbuch, 2000. Elbegebiet Teil1, Von der Grenze CR bis zur Havelmündung (1.11.1999 31.12.2000), Landesamt für Umweltschutz Sachsen-Anhalt (Publisher), Halle (Saale), 1222.
Einax, J.W., Aulinger, A. and von Tümpling jr., W., 1999. Quantitative description of element concentrations in longitudinal river profiles by multiway PLS models. Fresenius J. Anal. Chem., 363, 655611.
Engelhardt, C., Krüger, A., Karrasch, B. and Baborowski, M., 1999. Input-output Balances of Nutrients and Plankton in a flooded area of the Lower Odra. Acta Hydrochim. Hydrobiol.,
27, 325-330.
Friese, K., Witter, B., Brack, W., Buettner, O., Krueger, F., Kunert, M., Rupp, W., Miehlich, G., Groengroeft, A., Schwartz, R., van der Veen, A. and Zachmann, D. W., 2000. Distribution and Fate of Organic and Inorganic Contaminants in a River Floodplain-Results of a Case Study on the River Elbe. In: Remediation energing of contaminated soils, D.L.Wise, D.J.Trantolo, E.J.Cichon, H.I.Inyang and U. Stottmeister (Eds.). Marcel Dekker, Inc. New York, Basel, Switzerland. 373-426. Gerlach, M. and Gimbel, R., 1996. Herkunft und Verbleib
organischer Stoffe in der Elbe. Vom Wasser, 86, 231245. Guhr, H., 1995. Sources of heavy metal pollution in the drainage
area of the river Elbe in the former GDR. In: Heavy Metals in the Environment, R.D.Wilken, U. Förstner and A.Knöchel (Eds.). Conference proceedings, 2, CEP Consultants Ltd, Edinburgh, UK.7275.
Guhr, H., 2001. Entwicklungen in der Fließgewässerbeschaffenheit in den neuen Bundesländern seit 1990-Elbe-Einzugsgebiet. In: Aktuelle Probleme der Gewässerverschmutzung, V.Dethlefsen and V.Hilge (Eds.). Arbeiten des Deutschen Fischerei-Verbandes, 77, 120.
Guhr, H., Dreyer, U. and Spott, D., 1996. Changes in water quality and macrozoobenthos in the River Elbe since 1989. Arch. Hydrobiol. Suppl. 113, Large Rivers, 10, 293298.
Guhr, H., Desortova, B., Spott, D., Bormki, G., Karrasch, B. and Baborowski, M., 1998. Nährstoffangebot und Chloro-phyllentwicklung in der Elbe. Vom Wasser, 91, 195205. Guhr, H., Karrsch, B. and Spott, D., 2000. Shifts in the Processes
of Oxygen and Nutrient Balances in the River Elbe since the Transformation of the Economic Structure. Acta Hydrochim. Hydrobiol., 28, 155161.
Heininger, P. and Pelzer, J., 1998. Trends und Verteilungsmuster in der Schadstoffbelastung von Sedimenten aus östlichen Bundeswasserstraßen. Acta Hydrochim. Hydrobiol., 24, 218 225.
Heininger, P., Heise, S., Ahlf, W., Claus, E. and Pelzer, J., 2003. Elbe-Hochwasser 2002 - Schadstoffbelastung und Ökotoxizität von Sedimenten, Schwebstoffen und Auenböden. Conference proceedings annual meeting, Stade, 26.-28. Mai 2003. Water Chemical Society (Ed.), Media Process Management GmbH, Mainz, Germany. 3539
Junge, F. W., Jendryschik, K., Scharf, B., Morgenstern, P., Treutler, H.-C., Czega, W., Hanisch, C. and Zerling, L., 2003. Schwebstoff- und Schwermetalldeposition im Bitterfelder Muldestausee. In: Schadstoffbelastung im Mulde- und Elbe-Einzugsgebiet nach dem Augusthochwasser 2002. UFZ-Centre for Environmental Research (Ed.), Conference proceedings, Freiberg, 27.-29.08.03, KDD GmbH, Nürnberg, Germany. 74 77.
Karrasch, B., Mehrens, M., Rosenlöcher, Y. and Peters, K., 2001a. The Dynamics of Phytoplankton, Bacteria and Heterotrophic Flagellates at Two Banks near Magdeburg in the River Elbe (Germany). Limnologica, 31, 93107.
Karrasch, B., Baborowski, M., Winkler, M., Mehrens, M., Link, U. and Herzog, M., 2001b. Ökomikrobiologie und Planktologie der Saale. In: Erhalt und Regenerierung der Flußlandschaft Saale, B. Parthier (Ed.),. Nova Acta Leopldina, NF 84 (319), 109116.
Kluge, A., Beuge, P., Greif, A., Hoppe, Th., Klemm, W., Knöchel, A., Martin, M., Mibus, J., Mosler, U. and Starke, R., 1995. Heavy metals in a tributary of the Elbe river - The Mulde system. In: Heavy Metals in the Environment, R.D.Wilken, U. Förstner and A.Knöchel (Eds.). Conference proceedings, 2, CEP Consultants Ltd, Edinburgh, UK. 8790.
Landesamt für Umweltschutz (LAU) Sachsen-Anhalt, 2003. Das Hochwasser von Elbe und Mulde im August 2002 im Land Sachsen-Anhalt. Auswirkungen auf die stoffliche Belastung des Wassers, der Schwebstoffe, der Sedimente und des Bodens. Final report, (www.mu.sachsen-anhalt.de).
Lehmann, A. and Rode, M., 2001. Long - term behaviour and cross correlation water quality analysis of the river Elbe; Germany. Water Res., 9, 21532160.
Lehmann, J., Puff, Th., Damke, H., Eidam, J., Henning, K.-H., Jülich, W.-D. and Roßberg, H., 1999. The Odra River Load of Heavy Metals at Hohenwutzen during the Flood in 1997. Acta Hydrochim. Hydrobiol., 27, 321324.
Ludwig, U., Neumann, V., Grischek, T. and Nestler, W., 1997. Application of Ultrafiltration for Characterization of the DOC of Elbe River Water. Acta Hydrochim. Hydrobiol., 25, 7178.
Macklin, M. G., Brewer, P. A., Balteanu, D., Coulthard, T. J., Driga, B., Howard, A. J. and Zaharia, S., 2003. The long term fate and environmental significance of contaminant metals released by the January and March 2000 mining tailings dam failures in Maramures County, upper Tisa Basin, Romania. Appl. Geochem., 18, 241257.
Meissner, R., Guhr, H., Rupp, H., Seeger, J. and Spott, D., 1994. Heavy Metal Content of Soils and Sediments of the River Elbe in Selected Parts of East Germany. Z. Kulturtechnik Landentwicklung, 35, 19.
Meyer, A.-K. 2002. Die Belastung der Oder. Ergebnisse des internationalen Oderprojektes (IOP). Universität Hamburg, Institut für Anorganische und angewandte Chemie (Ed. & publisher), Hamburg, Germany. 2123.
Müller, G. and Furrer, R., 1995. Heavy metals in the sediments of the Elbe river 1972-1994. In: Heavy Metals in the Environment, R.D.Wilken, U. Förstner and A. Knöchel (Eds.). Conference proceedings, 2, CEP Consultants Ltd, Edinburgh, UK. 8386. Nies, H., Heinrich, H., Gaul, F., Oestereich, H., Albrecht, S., Schmolke, N. T., Gerwinski, W., Becker, G., König, P., Frohse, A., Schulz, A., Müller-Navarra, S., Dick, S. and Strübing, K., 2003a. Auswirkungen des Hochwassers vom August 2002 auf die Deutsche Bucht - Eine Zwischenbilanz. In: Warnsignale aus Nordsee und Wattenmehr. Eine aktuelle Umweltbilanz, J.L.Lozan, E.Rachor, K. Reise, J. Sündermann and H.v.Westernhagen, (Eds.), Wissenschaftliche Auswertungen, Hamburg, Germany. 8391.
Nies, H., Gaul, F., Oestereich, H., Albrecht, S., Schmolke, N. T., Theobald, N., Becker, G., Schulz, A., Frohse, A., Dick, S., Müller-Navarra, S. and Herklotz, K., 2003b. Die Auswirkungen des Elbehochwassers 2002 auf die Deutsche Bucht. Abschlussbericht Juni 2003. Bundesamt für Seeschiffahrt und Hydrographie, (Ed. and Publisher) Hamburg und Rostock, Germany. (www.bsh.de)
Patrick jr. W. H. and Verloo, M., 1998. Distribution of soluble heavy metals between ionic and complexed forms in a saturated sediment as affected by pH and redox conditions. Water Sci. Technol., 37, 165172.
Petersen, W., Wallmann, K., Pinglin Li, F., Schroeder, F. and Knauth, H.-D.,1995. Exchange of Trace Elements at the Sediment-Water Interface during Early Diagenesis Processes. Mar. Freshwater Res., 46, 1926.
Reincke, H., 1995. Trends in heavy metal and arsenic burdens in the Elbe river. In: Heavy Metals in the Environment, R.D.Wilken, U. Förstner and A. Knöchel (Eds.). Conference proceedings, 2, CEP Consultants Ltd, Edinburgh, UK. 7682.
Reincke, H., 2003. Elbehochwasser 2002. Conference proceedings annual meeting, Stade, 26.-28. Mai 2003. Water Chemical Society (Ed.), Media Process Management GmbH, Mainz, Germany. 2126.
Roth, R., 1996. Einige Bemerkungen zur Entstehung von Sommerhochwasser aus meteorologischer Sicht. Z. Kulturtechnik Landesentwicklung, 37, 241245.
Schanze, J., 2002. Nach der Elbeflut 2002: Die gesellschaftliche Risikovorsorge bedarf einer transdisziplinären Hochwasserforschung. GAIA, 11, 247254.
Schultze, M., Boehrer, B., Kuehn, B. and Büttner, O., 2002. Neutralisation of acidic mining lakes with river water. Ver. Internat. Verein. Limnol., 28, 936939.
Schultze, M., van der Veen, A. and Friese, K., 2003. Die Überflutung des Goitschesees und ihre Folgen. In: Schadstoffbelastung im Mulde- und Elbe-Einzugsgebiet nach dem Augusthochwasser 2002. Conference proceedings, Freiberg, 27.-29.08.03, UFZ-Centre for Environmental Research,(Ed.). KDD GmbH, Nürnberg, Germany. 135138. Simon, M., 1995. Die Elbe und ihr Einzugsgebiet. Report,
International Commission for the Protection of the Elbe, Magdeburg, Germany. (www.ikse-mkol.de).
Simon, M., 2001. 10 Jahre erfolgreiche Arbeit an der Elbe. Wasser und Abfall, 9, 1015.
Simon, M., 2002. Das Jahrtausend-Hochwasser. Wasserwirtschaft Wassertechnik, 7, 1215.
Soldán, P., Pavoni, M., Bouek, J. and Koke, J., 2001. Baia Mare Accident-Brief Ecotoxicological Report of Scech Experts. Ecotoxicol. Environ. Safety, 49, 255261.
Spott, D., 1995. Zur Entwicklung der Wasserbeschaffenheit in der mittleren Elbe. Wasserwirtschaft Wassertechnik, 7, 1421. Spott, D., 1998. Über die Bedeutung von
Wasserstands-schwankungen für die Entwicklung der Sauerstoff-, Chlorophyll- und Nährstoffkonzentrationen in der mittleren Elbe während der Vegetationsperiode. In: Gewässerschutz im Einzugsgebiet der Elbe/ 8, W. Geller, D. Punochár, D. Bornhöft, J. Boucek, H. Feldmann, H. Guhr, V. Mohaupt, M. Simon, J. SmrtÇák, J. Spoustová and O. Uhlmann, (Eds.). Magdeburger Gewässerschutzseminar. Teubner Verlag Stuttgart Leipzig, Germany. 5457.
Spott, D. and Guhr, H., 1996. The dynamics of suspended solids in the tidally unaffected area of the river Elbe as a function of flow and shipping. Arch. Hydrobiol. Spec. Issues Advanc. Limnol., 47, 127133.
Truckenbrodt, D. and Einax, J., 1995. Sampling representativity and homogeneity of river sediments. Fresenius J. Anal. Chem.,
5, 437443.
Zerling, L., Müller, A., Jendryschik, K., Hanisch, C. and Arnold, A., 2001. Der Bitterfelder Muldestausee als Schadstoffsenke: Entwicklung der Schwermetallbelastung von 1992-1997. Abhandlungen der Sächsischen Akademie der Wissenschaften zu Leipzig. Math.-naturwissenschaftliche Klasse, 59, 169, Hirzel, Stuttgart Leipzig, Germany.