HAL Id: hal-00297977
https://hal.archives-ouvertes.fr/hal-00297977
Submitted on 25 Feb 2008HAL is a multi-disciplinary open access
archive for the deposit and dissemination of sci-entific research documents, whether they are pub-lished or not. The documents may come from teaching and research institutions in France or abroad, or from public or private research centers.
L’archive ouverte pluridisciplinaire HAL, est destinée au dépôt et à la diffusion de documents scientifiques de niveau recherche, publiés ou non, émanant des établissements d’enseignement et de recherche français ou étrangers, des laboratoires publics ou privés.
Unusually negative nitrogen isotopic compositions
(?15N) of mangroves and lichens in an oligotrophic,
microbially-influenced ecosystem
M. L. Fogel, M. J. Wooller, J. Cheeseman, B. J. Smallwood, Q. Roberts, I.
Romero, M. Jacobsen Meyers
To cite this version:
M. L. Fogel, M. J. Wooller, J. Cheeseman, B. J. Smallwood, Q. Roberts, et al.. Unusually negative ni-trogen isotopic compositions (?15N) of mangroves and lichens in an oligotrophic, microbially-influenced ecosystem. Biogeosciences Discussions, European Geosciences Union, 2008, 5 (1), pp.937-969. �hal-00297977�
BGD
5, 937–969, 2008 Nitrogen isotopic composition of mangrove ecosystems M. L. Fogel et al. Title Page Abstract Introduction Conclusions References Tables Figures ◭ ◮ ◭ ◮ Back CloseFull Screen / Esc
Printer-friendly Version Interactive Discussion Biogeosciences Discuss., 5, 937–969, 2008
www.biogeosciences-discuss.net/5/937/2008/ © Author(s) 2008. This work is distributed under the Creative Commons Attribution 3.0 License.
Biogeosciences Discussions
Biogeosciences Discussions is the access reviewed discussion forum of Biogeosciences
Unusually negative nitrogen isotopic
compositions (δ
15
N) of mangroves and
lichens in an oligotrophic,
microbially-influenced ecosystem
M. L. Fogel1, M. J. Wooller1,2, J. Cheeseman3, B. J. Smallwood4,5, Q. Roberts1,5,
I. Romero5, M. Jacobson Meyers5
1
Carnegie Institution of Washington, Geophysical Laboratory, 5251 Broad Branch Rd., NW., Washington, DC 20015, USA
2
Alaska Stable Isotope Facility: Water and Environmental Research Center, Institute of Marine Science and School of Fisheries and Ocean Sciences, University of Alaska, Fairbanks, Alaska, 99775, USA
3
Department of Plant Biology, University of Illinois, Urbana, Illinois 61801, USA 4
Department of Oceanography, Texas A&M, College Station, Texas 77843–3146, USA 5
BGD
5, 937–969, 2008 Nitrogen isotopic composition of mangrove ecosystems M. L. Fogel et al. Title Page Abstract Introduction Conclusions References Tables Figures ◭ ◮ ◭ ◮ Back CloseFull Screen / Esc
Printer-friendly Version Interactive Discussion
Received: 3 January 2008 – Accepted: 8 January 2008 – Published: 25 February 2008 Correspondence to: M. Fogel ([email protected])
Published by Copernicus Publications on behalf of the European Geosciences Union.
BGD
5, 937–969, 2008 Nitrogen isotopic composition of mangrove ecosystems M. L. Fogel et al. Title Page Abstract Introduction Conclusions References Tables Figures ◭ ◮ ◭ ◮ Back CloseFull Screen / Esc
Printer-friendly Version Interactive Discussion
Abstract
Extremes in δ15N values in mangrove tissues and lichens (range=+4 to −22‰) were measured from a mangrove forest ecosystem located on Twin Cays, offshore islands in Belize, Central America. The N isotopic compositions and concentrations of NH+4/NH3 in porewater, rainwater, atmospheric ammonia, mangrove leaves, roots, stems, and 5
wood, and lichens, were examined to study the biogeochemical processes important for establishing these unusual N isotopic ratios. Porewater ammonium concentrations had little to no relationship to N isotopic fractionation in mangrove tissues. The δ15N of fine and coarse roots was 9‰ more positive than leaf tissue from the same tree. When P was added to dwarfed mangrove trees without added N, δ15N increased within one 10
year to a δ15N closer to the δ15N of porewater ammonium (δ15N=+4‰). Isotopically negative ammonia in the atmosphere (δ15N=−18‰) and in rainwater (δ15N=−9‰) were found on Twin Cays and may be sources of available N for isotopically depleted mangrove trees and lichens. In highly stressed, severely P limited trees, uptake of atmospheric N by Rhizophora mangle may be an important adaptive strategy.
15
1 Introduction
Mangrove trees, a wide range of species that can be characterized by their ability to grow in brackish or full salinity seawater along tropical and subtropical coasts, can be growth limited by N, or P or both (Feller, 1995; Feller et al., 1999). While it is straight-forward to assume that N limitation will have some effect on the isotopic composition of 20
plants (Evans, 2001), there are no clearly justifiable expectations about P limitation’s effect on N isotopic compositions. P is taken up by plants through the roots, typically, assisted by the action of membrane bound phosphatases (Muchhal and Raghothama, 1999; Smith, 2001). Experiments on fertilized mangrove trees have shown that when a tree with the primary limitation of P is given this nutrient the tree responds rapidly and 25
BGD
5, 937–969, 2008 Nitrogen isotopic composition of mangrove ecosystems M. L. Fogel et al. Title Page Abstract Introduction Conclusions References Tables Figures ◭ ◮ ◭ ◮ Back CloseFull Screen / Esc
Printer-friendly Version Interactive Discussion The δ15N of plants reflects the net effect of many processes including the δ15N of
the source N, enzymatic fractionations within a plant, and plant-microbial interactions in soil (Dawson et al., 2002). The majority of terrestrial plants have δ15N near 0‰ in temperate zones, however, different species growing in the same environment have been found to vary by as much as 10‰ (Handley and Scrimgeour, 1997). Mangrove 5
trees, in general, have N isotopic compositions that reflect the overall nutrient status of the ecosystem (Fry et al., 2000). For example, trees growing in regions associated with human populations had δ15N similar to that of the N released from sewage treatment plants. Accordingly, we have previously reported that Rhizophora mangle L. (Red mangrove) found on a frigate bird rookery only a few kilometers from the site of the 10
present study had δ15N as positive as +17‰, which was identical to the N in the sediment and in the birds’ droppings (Wooller et al., 2003b).
Plants can utilize N dissolved in soils or by absorption through their leaves (e.g., Garten et al., 1990; Leith et al., 2002) and volatile ammonia originating from animal colonies can influence the δ15N of plant leaves (Erskine et al., 1998). For example, 15
negative δ15N (to −8‰) have been measured in grasses, C3 plants, and mosses,
which were collected growing downwind of major bird rookeries. Plants collected in the immediate vicinity of the colonies incorporated the enriched δ15N (up to +18‰) from the marine N at the base of the birds’ food web. Either following a rainfall event or as the result of dry deposition, ammonia and nitrate can be taken up by plants and 20
incorporated into their biomass.
The stable N and C isotopic compositions of mangrove trees fertilized with N or P have been studied previously (McKee et al., 2002). These authors, measuring dif-ferences in freshly collected leaves, found that R. mangle trees fertilized with P had positive δ15N values compared with unfertilized or N fertilized trees. The controls 25
without fertilizer and the N fertilized trees had negative δ15N values to −8‰. In con-ditions where the concentration of ammonia or nitrate is in excess of what a plant needs for immediate growth, isotopic fractionations increase, then are displayed in the
BGD
5, 937–969, 2008 Nitrogen isotopic composition of mangrove ecosystems M. L. Fogel et al. Title Page Abstract Introduction Conclusions References Tables Figures ◭ ◮ ◭ ◮ Back CloseFull Screen / Esc
Printer-friendly Version Interactive Discussion et al. (2005) have proposed a similar mechanism in their study of bog species in New
Zealand.
Based on our previous work (Wooller et al., 2003a and b; Smallwood et al., 2003) and preliminary studies, a number of lines of evidence suggested that the explanation for depleted δ15N was incomplete. For example, Wooller et al. (2003b) noted that 5
R. mangle leaves from unfertilized trees collected at random locations throughout the
islands used by McKee and coworkers, had δ15N considerably lower than the values they had found, making the hypothesis of fractionation during uptake from the soil problematic even though porewater dissolved nitrogen values were much lower than those in fertilized plots. Subsequent work on the biochemical partitioning of the N 10
isotopic signal in R. mangle leaves showed that the signal was not associated with any particular leaf component or biochemical fraction (Smallwood et al., 2003). Rather, differences between dwarf trees with low δ15N and tall or fringing trees with δ15N near 0‰ were similar in all chemical fractions.
In this paper we further explored the causes of the wide variations in the stable 15
N isotopic compositions in mangroves at Twin Cays, Belize, by sampling mangrove trees from two tree species, as well as organisms that rely primarily on atmospheric N sources (i.e., lichens), organisms that fix atmospheric N (e.g., microbial mats), and the isotopic compositions of potential soil, water, and atmospheric sources of this critical nutrient.
20
2 Materials and methods
2.1 Study site and collections
Twin Cays is a highly oligotrophic, peat-based archipelago, located 12 km off the coast of Belize and approximately 3km inside the barrier reef. These islands are part of a Smithsonian research area, which has been the focus of long-term studies on man-25
BGD
5, 937–969, 2008 Nitrogen isotopic composition of mangrove ecosystems M. L. Fogel et al. Title Page Abstract Introduction Conclusions References Tables Figures ◭ ◮ ◭ ◮ Back CloseFull Screen / Esc
Printer-friendly Version Interactive Discussion Feller, 1996; Wooller et al., 2004).
Samples, including leaves, roots, bark, stems, and wood of mangrove trees (R.
man-gle and leaves only from Avicennia germinans (L.) Stearn.; black mangrove), microbial
mats, and lichens were sampled during the period extending from October 2000 to April 2004 (Wooller et al., 2003a, b). Samples were dried at 50–70◦
C at the Smith-5
sonian Caribbean Coral Reef Ecosystem laboratory at Carrie Bow Cay, approximately 3 km from Twin Cays.
2.2 Fertilization experiments
For the N and P fertilization studies, we sampled the three fertilization sites established in January, 1998, extending from the fringe into the dwarf zone (Feller et al., 2003). 10
I.C. Feller and coworkers of the Smithsonian Institution maintained these fertilization plots. In addition, 12 dwarf red mangrove trees were chosen for a one-time experiment. Three trees served as controls; three trees received 150 g of P2O5(0:20:0) ,which were
buried within 1cm of a major prop root; three trees were fertilized with 150 g of P2O5
(0:20:0), 1 m away from the nearest prop root. This fertilizer aliquot was located so that 15
no other mangrove tree was within 2 m. Leaves were sampled periodically over the next several years for isotopic and elemental compositions; trees were also assessed for internodal length, production of new prop roots, and overall size.
2.3 Bulk C and N stable isotope analyses
For leaf bulk stable C and N isotope analyses, a small aliquot of dried leaf tissue 20
was sampled, taking care that no veins, invertebrate or fungal damage, or discolored portions of the leaf were used. Lichens were scraped off of bark with spatulas or razor blades taking care not to include bark tissue in the sample. An aliquot (∼400 to 1000 µg) of each sample was analyzed using continuous-flow, stable isotope ratio mass spectrometry (Finnigan MAT, DeltaplusXL) (as described in Wooller et al., 2003b). 25
BGD
5, 937–969, 2008 Nitrogen isotopic composition of mangrove ecosystems M. L. Fogel et al. Title Page Abstract Introduction Conclusions References Tables Figures ◭ ◮ ◭ ◮ Back CloseFull Screen / Esc
Printer-friendly Version Interactive Discussion 2.4 Ammonium concentration and isotopic measurements
Porewater ammonium concentrations were determined by collecting 10–50 ml at 10 cm depth using a sipper system. Water samples were filtered at the laboratory on Carrie Bow Cay with glass fiber filters (GF/F). Filtered water samples were stored in the re-frigerator and analyzed typically within 2 days following collection. For samples that 5
contained H2S, 0.2 ml of HCl was added to the porewater prior to analysis following the
method of Solarzano (1969).
To measure δ15N of ammonium, we collected 120 ml of porewater from 5–10 cm depth using sippers, filtered and analyzed as above. Samples were collected from mul-tiple locations around Twin Cays. Filtered porewater (110 ml) was decanted into a spec-10
imen cup with a Teflon sandwich containing filter paper dosed with 5–10 ml of H2SO4
-KH2SO4solution following a modification of the method of Stark and Hart (1996).
2.5 Atmospheric ammonia emissions and isotopic measurements
For measurements of ammonia emissions into air, we deployed ammonium sensitive badges (K&M Environmental, Virginia, USA) that absorbed ammonia gas through a 15
Teflon membrane, producing a color change by reacting with an ammonia sensitive chemical indicator (see Kring et al., 1981). The average ammonia emission over the period of exposure is estimated by dividing the dose by the time of exposure (i.e. the data reported by the badges are in units of ppm NH3-hr). Badges were deployed in the
field by tying them onto mangrove prop roots or stems at a height of 20–50 cm above 20
the mean high tide. Readings were taken over time up to 24 h.
To collect ammonia in the field for isotopic analyses, we deployed Teflon sandwiches (see above) contained in mesh bags, which were tied to mangrove branches or PVC pipes around the islands during February 2003 and March 2004. The tags were left out for a period of 6 days, which is considered adequate for absorbing atmospheric 25
BGD
5, 937–969, 2008 Nitrogen isotopic composition of mangrove ecosystems M. L. Fogel et al. Title Page Abstract Introduction Conclusions References Tables Figures ◭ ◮ ◭ ◮ Back CloseFull Screen / Esc
Printer-friendly Version Interactive Discussion 2.6 Laboratory flux experiment
In March 2004, we conducted flux studies at the Carrie Bow Marine Laboratory using peat or mat cores (diameter=5 cm) collected from the field the previous day. Exper-iments were started before sunrise by hanging a K&M badge (see above) inside of the core barrel and incubated the cores in full daylight at ambient air temperatures (26 5
to 29◦C). Ammonia readings were taken every hour for 6 hours, or until the ammonia detecting badges reached saturation (≪300 ppm NH3).
2.7 P concentrations
Porewaters for P analysis were collected, filtered and frozen for subsequent measure-ment in Los Angeles on a Latchatt Automatic Analyzer at USC. Total P was determined 10
on leaves by combusting approximately 100 mg of leaf material at 500◦
C for 2 h. The resulting ash was weighed, digested using methods modified from Jensen and Tham-drup (1998), and then analyzed for P with spectrophotometric methods (Presley, 1971).
3 Results
3.1 Stable isotopic signature of mangroves from Twin Cays, Belize 15
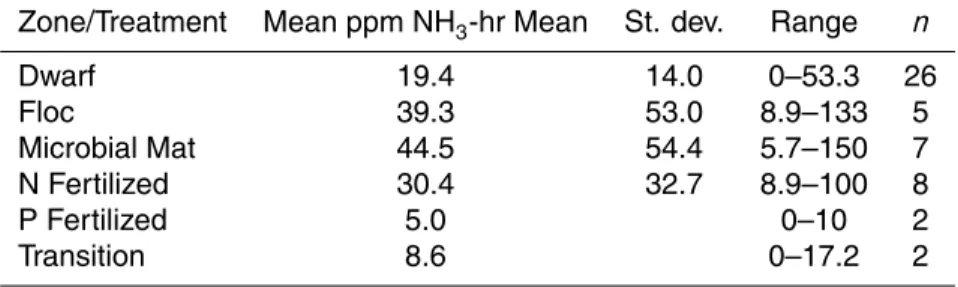
The dominant tree species on Twin Cays, Belize, R. mangle (red mangrove), had an unusually large range in bulk leaf δ15N of −21.6 to 4.0‰ (Mean=−4.4±4.7; n=400) as well as δ13C from −31.6 to −20.3‰ (Mean=−26.2±1.5‰). R. mangle from the fringes of the island had the lowest δ13C values and the highest δ15N values, whereas dwarf trees at interior locations had the highest δ13C values and lowest δ15N val-20
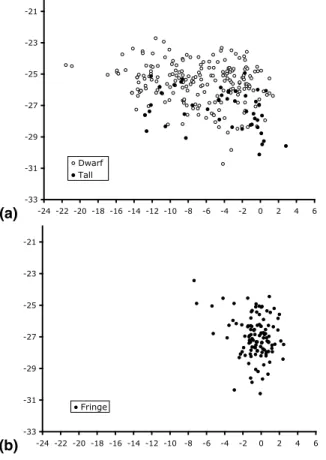
ues (Fig. 1a, b; Tables 1, 2). A. germinans had δ15N of −0.7±0.1‰ (range=+3.8 to −11.2‰) and δ13C of −26.2±2.6‰ (range=−23.2 to −30.7‰) in leaves from 100 dif-ferent trees (Fig. 2).
BGD
5, 937–969, 2008 Nitrogen isotopic composition of mangrove ecosystems M. L. Fogel et al. Title Page Abstract Introduction Conclusions References Tables Figures ◭ ◮ ◭ ◮ Back CloseFull Screen / Esc
Printer-friendly Version Interactive Discussion The greatest variations of δ15N were found in the leaves of R. mangle located in the
islands’ interior. Very negative δ15N (<−8‰) were measured only in dwarf (i.e. <1 m tall) or interior tall trees (Table 1). Many of these dwarf trees had very short internodal lengths (<0.2 cm) reflecting their slow growth. Isotopic heterogeneity was extreme over very short distances (e.g., 2 m or less). For example, dwarf trees found within 1 m of 5
interior tall trees often differed from each other in terms of δ15N by up to 14‰.
The δ15N of fringe R. mangle was less variable than interior trees (Table 1). The
δ13C of fringe trees were more positive on the exterior, wave-beaten portions of the island than in the inner channels (p<0.001).
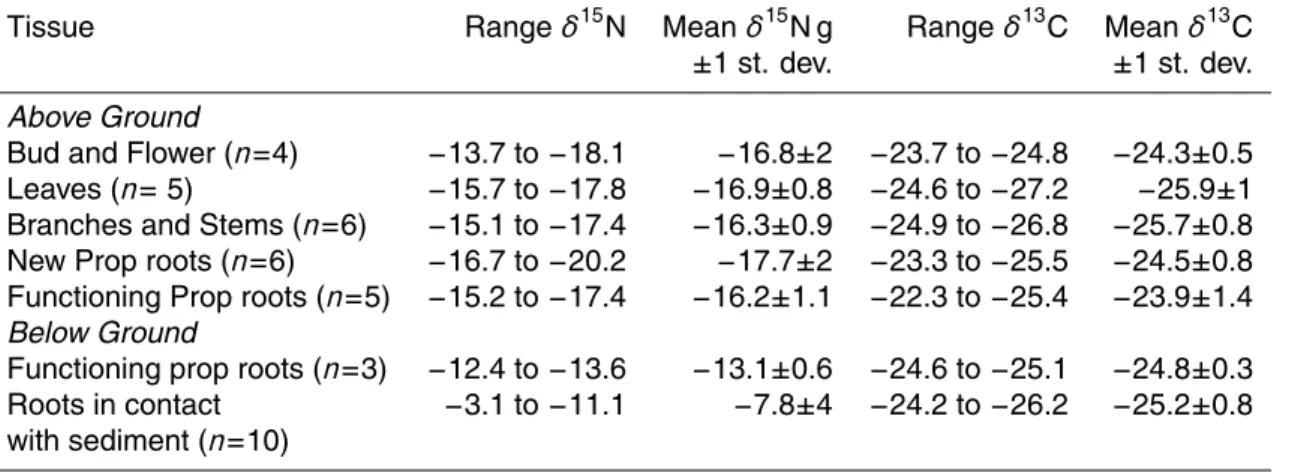
The results of isotopic analysis of a single dwarf tree, sacrificed in its entirety, from 10
the Batfish Pond site are summarized in Table 3. Although it was initially chosen at random, it represented one of the many examples of the extremely low δ15N trees. The δ15N of above ground tissues had little variation between flowers, buds, leaves, stems, wood, and prop roots. Below ground tissues varied in δ15N from −3.1‰ to −15.6‰, most noticeably within the roots which are actively involved in nutrient and 15
water absorption. Similar results were obtained in less complete sampling of unfertil-ized dwarf trees from other Twin Cays sites. Striking in all cases was the absence of variation or gradients in δ15N through the shoot, from the substrate surface to the most distal leaves, or with leaf developmental stage. Similarly noteworthy were the higher and variable values of δ15N in the active roots.
20
3.2 Stable isotopic composition of microbial mats and lichens
The isotopic composition of bacterial and algal mats distributed on the islands had
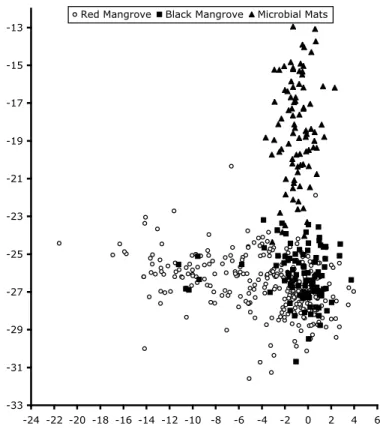
δ15N with an average of −0.9±1.3‰ (range=+2.3 to −3.7; n=90) (Fig. 2). These δ15N values indicate a source of N from N fixation (e.g., Macko et al., 1986). Lichens had a
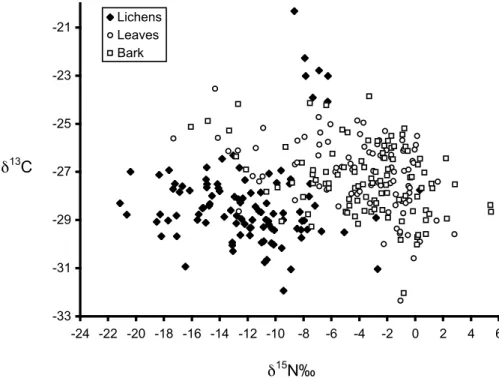
δ15N range from 0.4‰ in the fringe zone to −21‰ in the floc and dwarf zones (Fig. 3). 25
The δ15N of the lichens was not related to the δ15N of the bark that the lichens were found growing on (r2=0.167) or leaves growing on nearby branches. Patches of lichens
BGD
5, 937–969, 2008 Nitrogen isotopic composition of mangrove ecosystems M. L. Fogel et al. Title Page Abstract Introduction Conclusions References Tables Figures ◭ ◮ ◭ ◮ Back CloseFull Screen / Esc
Printer-friendly Version Interactive Discussion with very negative δ15N values were found around floc zones (δ15N=−13.1±5‰;
n=13) and interior dwarf zones (δ15N=−12.3±4‰; n=45). Lichens on the fringe trees
had slightly more positive values (δ15N=−11.7‰; n=18), while the δ15N of the fringing mangrove leaves was near 0‰. The δ15N of lichens was always more negative than both the bark and a corresponding leaf that was collected at the same tree height from 5
the sediment surface.
3.3 Fertilization experiments
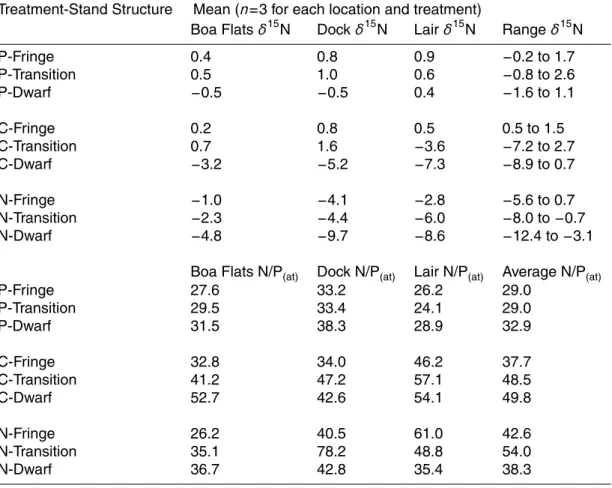
In the long-term fertilization plots (Feller et al., 2003) at the Dock, Boa Flats, and Lair sites, trees fertilized with P had leaf δ15N that were around 0‰ with no significant difference across the tree height gradient. Dwarf trees fertilized with the addition of N 10
as urea (δ15N=0‰), had δ15N values as low as −12.4‰, whereas those from fringe and transition trees likewise fertilized, were more positive (Tables 2, 4). At the Dock site, some of the N fertilized trees as well as control trees measured in 2003 had more negative N isotopic compositions than the same trees measured in 1998 (McKee et al., 2002). The δ15N in P fertilized tree leaves was as positive as 2.6‰ at this time, similar 15
to δ15N in unfertilized fringe trees.
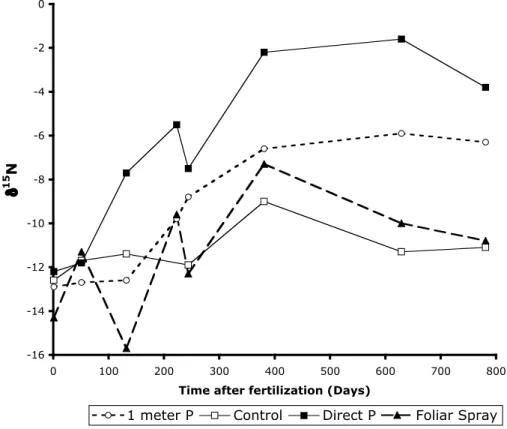
In 2002 a one-time, P fertilization experiment was started to test how quickly, and to what extent, a single dose of P can affect the growth and functioning of dwarf R. mangle trees. Trees that received P input directly next to a major prop root displayed stimulated growth within 7–8 months, as evidenced by increased internodal distances (from 0.1cm 20
to >5cm) and more positive δ15N (Fig. 4). Trees that were fertilized with P one meter away from major prop roots experienced a lag phase relative to those trees fertilized proximally. The δ15N and δ13C and the growth of the control trees, approximately 25m away from the P fertilized areas, remained constant during the experimental period.
BGD
5, 937–969, 2008 Nitrogen isotopic composition of mangrove ecosystems M. L. Fogel et al. Title Page Abstract Introduction Conclusions References Tables Figures ◭ ◮ ◭ ◮ Back CloseFull Screen / Esc
Printer-friendly Version Interactive Discussion 3.4 Ammonia concentrations, fluxes, and isotopic compositions of air and porewaters
In unfertilized regions hosting tall, interior R. mangle trees, porewaters from 5–10 cm depth averaged 37.1±21 µM NH4(n=18). In the transition zone, concentrations were 5±2.8 µM NH4 (n=5), whereas in the fringe they were 13.2±10 µM NH4 (n=5).
Inte-rior zones dominated by dwarf R. mangle had porewaters ranging from 1.8 to 88 µM 5
NH4 (mean=19.3 ±17; n=42). Within the floc regions, porewaters ranged from 5.8 to
413.8 µM NH4(mean=98±140; n=7), while within a microbial mat directly, porewaters averaged 159±102 µM NH4(n=8). Porewaters sampled in sediments directly fertilized
with N had an average 52±63 µM NH4 (n=7), however, those in porewaters sampled
where P was applied averaged 1.5±3 µM NH4(n=6). 10
Ammonia emissions in situ (February 2003 and March 2004) were measured co-incident with porewater concentrations. They were highest over mats and floc (Ta-ble 5; Fig. 5). In February 2003, we sampled the δ15N of atmospheric ammonia, ammonium from underlying porewaters, and rainwater (Table 6). Both atmospheric ammonia and the ammonia/ammonium in rainwater on Twin Cays had very negative 15
isotopic compositions relative to those measured in porewaters and in rainwater col-lected on Carrie Bow Cay. The isotopic fractionation between the atmospheric am-monia (Mean δ15N=−18.5‰) and the ammonium in porewaters (Mean δ15N=5.3‰) is 23.8‰, which fits within the range of isotopic fractionations (19 to 30‰) between these two N species that have been measured during chemical isotope fractionation 20
experiments in the laboratory (Thode et al., 1945; Hermes et al., 1985).
Flux experiments with small cores incubated on Carrie Bow Cay showed that ammo-nia fluxes related positively to porewater concentrations (r2=0.7). From microbial mats and floc samples, rates of 2.0 to 3.0 µmole NH3/m
2
/hr were measured in comparison to fringe cores, which had an average flux of 0.7 µmole NH3/m2/hr.
BGD
5, 937–969, 2008 Nitrogen isotopic composition of mangrove ecosystems M. L. Fogel et al. Title Page Abstract Introduction Conclusions References Tables Figures ◭ ◮ ◭ ◮ Back CloseFull Screen / Esc
Printer-friendly Version Interactive Discussion
4 P and N concentrations and ratios in red mangrove leaves and underlying sediments
P concentrations in freshly collected R. mangle leaves were extremely low all over Twin Cays (0.06±0.02% Total P (TP); n=71). Red mangrove leaves sampled on the East Island remote from direct coastal access and completely removed from fertiliza-5
tion plots, had 0.08±0.04% TP with ranges from 0.03 to 0.20 %TP (n=35). These %TP values were elevated slightly from trees receiving chronic, episodic P fertilization (0.07±0.03%TP; n=27) (p=0.04) in the three fertilization experiments maintained on the islands (Feller et al., 2002). Tissue levels, thus, were constant in fertilized trees, but total tree levels were much higher as many more leaves, branches, and stems 10
were produced. Trees receiving a one-time input of P had significantly more total P (0.10±0.05%TP) in growing leaves 2 years after the initial fertilization (p=0.05) than control trees (0.07±0.02%TP).
5 Discussion
Nitrogen isotopic compositions of mangrove tissues were not simply related to the in-15
organic N concentrations in sediments. Although it has been postulated that higher sediment N concentrations would result in increased N isotope fraction during uptake and biosynthesis in roots, based on the ammonium concentrations in porewaters and the coexisting N isotopic compositions in mangrove leaves, we find minimal correlative evidence to support this statement (R2=0.31). For example, dwarf trees fertilized with 20
urea had higher porewater ammonium concentrations (e.g., 200 µM) but with δ15N values down to −10‰, compared to unfertilized dwarf trees growing in sediment with 20–30 µM ammonium with δ15N as low as −18‰.
We found that trees fertilized with P and some trees growing nearby with equivalent sedimentary and leaf total P concentrations had the most positive δ15N (+2 to −1‰), 25
BGD
5, 937–969, 2008 Nitrogen isotopic composition of mangrove ecosystems M. L. Fogel et al. Title Page Abstract Introduction Conclusions References Tables Figures ◭ ◮ ◭ ◮ Back CloseFull Screen / Esc
Printer-friendly Version Interactive Discussion The relative amount of P then seems to be the most important factor in determining
δ15N values. However, the relationship between total P or N:P in leaves or sediments and δ15N of leaves was not, a linear or exponential function (Fig. 6).
Clarkson et al. (2005) recently measured a correlation between % total P in foliar tis-sue and δ15N in plants growing in peat bogs. They concluded that P limitation reduced 5
mycorrhizal colonization of roots, which in turn potentially resulted in increased N iso-tope fractionation. Clarkson et al. (2005) did not, however, report δ15N for root tissue or the δ15N of potential N species in the environment. In our study, coarse and fine roots had more positive δ15N by 4–13‰ than aboveground tissues: leaves, prop roots, stems, wood, and bark. Porewater ammonium δ15N values from mats, floc zones, 10
dwarf regions, and underneath some N fertilized trees averaged 4‰ (n=12). This cor-relation of porewater and root values implies that evidently, these roots incorporate N from sediments.
Hobbie et al. (2000, 2005) have shown that a substantial N isotopic fractionation oc-curs during early colonization by ectomycorrhizal (ECM) and ericoid mycorrhizal (ERM) 15
fungi associations with δ15N in leaves of colonizing species averaging –9 ± 2‰. Ma-ture plants infected with AM fungi had δ15N has low as –4‰; our leaves with δ15N less than −10‰ were collected from dwarf mangrove trees that were well established. Mangrove ecosystems at Twin Cays have not shown evidence of mycorrhizal associ-ations with mangrove trees (Lovelock, personal communication), although arbuscular 20
mycorrhizal (AM)-type mycorrhizal associations have been found in mangroves colo-nizing the Ganges River estuary (Sengupta and Chaudhuri, 2002). It is unlikely that AM fungal associations could explain the full extent of the δ15N variation we determined at Twin Cays.
The intimate relationship between P availability and N isotopic fractionation was 25
shown clearly and dramatically in the results of fertilization studies in as little as 3 months (Fig. 4). After 5 months, the δ15N increased from −14‰ to −9‰ in leaves that had P applied directly at the roots, as opposed to 1m away or sprayed on the leaves. After 8 months, all P fertilized trees, regardless of the application method,
BGD
5, 937–969, 2008 Nitrogen isotopic composition of mangrove ecosystems M. L. Fogel et al. Title Page Abstract Introduction Conclusions References Tables Figures ◭ ◮ ◭ ◮ Back CloseFull Screen / Esc
Printer-friendly Version Interactive Discussion showed evidence of responding by having longer internodes, thinner leaves, more
leaves, new prop roots, and reproductive tissues. Control trees were unchanged. At the same time, δ15N in leaves increased in all P treatments: direct root application,
δ15N=−2‰ and 1 m distant root application δ15N=−4‰. In conclusion, P availability
can explain the continuum of δ15N values from negative to positive values, but not the 5
extremely negative δ15N themselves.
Although the potential sources for N for mangroves could include dissolved nitrate or amino acids in the sediment, the negative δ15N is likely explained by the incorpo-ration of an atmospheric NH3 pool. Nitrate levels in unamended surface sediments
from Twin Cays were rarely above 25% of the total dissolved N pool, and there were 10
no indications that any sediment pool had a δ15N different from 0‰ (data not shown). Amino acids in porewaters are another potential source of N for mangroves, although their uptake by mangroves has not been specifically documented. In a review by Lip-son and Nasholm (2001), they state that in ecosystems where microbial activity and biomass have large seasonal cycles, organic N uptake might be a significant source of 15
N. Again, however, the total sediment δ15N, together with the decreased15N depletion in the roots compared to the leaves suggests amino acid uptake was not a significant source.
Ammonia in the atmosphere was always depleted in15N, with isotopic compositions averaging –18±4‰ (n=20). Ammonium in rainwater (δ15N=−9±3‰; n=4) was also 20
depleted in15N. Thus, uptake of N from an atmospheric or rainwater pool is a potential explanation of the δ15N of the most negative dwarf trees. This is further supported by the results of lichen analyses. The δ15N of lichens collected from trees in the dwarf, transition, floc, and fringe zones of the island also have very negative values (as low as δ15N of −22‰). Lichens, and other epiphytes, do not have roots, thus must use 25
atmospheric sources of N for their nutrient requirements; therefore the possibility that an isotopically depleted N source is available to them for growth is strong (Hietz et al., 2002). We propose that N isotope fractionation may be a passive process related to leaf proximity to volatilized ammonia and is proportional to the relative amount of
BGD
5, 937–969, 2008 Nitrogen isotopic composition of mangrove ecosystems M. L. Fogel et al. Title Page Abstract Introduction Conclusions References Tables Figures ◭ ◮ ◭ ◮ Back CloseFull Screen / Esc
Printer-friendly Version Interactive Discussion uptake of N by the roots (Fig. 7). Foliar uptake of ammonia might be an important,
critical source of N for the Twin Cays mangrove ecosystem, as has been shown with terrestrial vegetation particularly in polluted areas (e.g. Krupa, 2003). This foliar uptake may be especially important in trees which are P limited, as it has been shown that P limited mangrove trees put less energy into below ground biomass (e.g., McKee et al., 5
2007).
6 Conclusions
We conclude that P-limited dwarf mangrove trees, growing adjacent to ammonia sources, in addition to lichens on trees in floc and dwarf zones, obtain a portion of their N from atmospheric sources (i.e. ammonia) with isotopically distinct isotopic com-10
positions from porewater N. The very negative δ15N of mangroves and lichens on the oligotrophic islands of Twin Cays are key in estimating the primary and secondary nu-trient limitations for this ecosystem. Twin Cays, located away from terrestrial runoff and with limited outside atmospheric influences, is an area where dwarf mangrove trees struggle to survive. We propose that their success depends in part on their taking 15
advantage of the microbial community comprised of N-fixing cyanobacteria and other photosynthetic microbes. A small, but significant portion of the ammonia fixed by mi-crobes is released by physical processes into the atmosphere where it is available for uptake by leaves on trees growing in high salinity, low P, anoxic sedimentary porewa-ters. This strategy must also depend on leaf proximity to volatilized ammonia sources, 20
such as exists at Twin Cays, and the resulting δ15N reflects the relative amount of up-take of N by leaves and roots. Thus, foliar upup-take of ammonia is a critical source of N for the Twin Cays mangrove ecosystem. Finally, we predict that in this and other highly oligotrophic ecosystems, δ15N can be powerful indicators of the integrated P and N cycling.
25
Acknowledgements. We would like to thank all of the Station Managers of Carrie Bow
BGD
5, 937–969, 2008 Nitrogen isotopic composition of mangrove ecosystems M. L. Fogel et al. Title Page Abstract Introduction Conclusions References Tables Figures ◭ ◮ ◭ ◮ Back CloseFull Screen / Esc
Printer-friendly Version Interactive Discussion
and C. DeCourley. The support of CCRE (Caribbean Coral Reef Ecosystems), Smithsonian Institution, and K. Ruetzler (National Museum of Natural History) and C. Feller (Smithsonian Environmental Research Center) are greatly appreciated. In addition, we would like to thank all of our colleagues from the Biocomplexity project who helped us by collecting samples and discussing data, particularly S. Joye, U. Scharler, C. Lovelock, and M. Frisher. G. Myerchin,
5
S. MacDonald, V. Brenneis, and D. Akob assisted with some of the analytical work or sample collection. NSF Biocomplexity awards to MLF (DEB99-81535), JC (DEB99-81309) and MEJ (DEB99-81357) supported the work. The University of Alaska Fairbanks and the Smithsonian Institution through a Loeb Fellowship to MLF supported M. Wooller. This paper is CCRE #733.
References 10
Bucher, M., Rausch, C., and Daram, P.: Molecular and biochemical mechanisms of P uptake into plants, J. Plant Nutr. Soil Sc., 164, 209–217, 2001.
Clarkson, B. R., Schipper, L. A., Moyersoen, B., and Silvester, W. B.: Foliar15N natural abun-dance indicates P limitation of bog species, Oecologia, 144, 550–557, 2005.
Dawson, T. E., Mambelli, S., Plamboeck, A. H., Templer, P. H., and Tu, K. P.: Stable isotopes in
15
plant ecology, Annual Rev. Ecol. Syst., 33, 507–559, 2002. Evans, R. D.: Physiological mechanisms influencing plant N isotope composition, Trends Plant Sci., 6, 121–126, 2001.
Erskine, P. D., Bergstrom, D. M., Schmidt, S., Stewart, G. R., Tweedie, C. E., and Shaw, J. D.: Subantarctic Macquarie Island-a model ecosystem for studying animal-derived N sources
20
using15N natural abundance, Oecologia, 117, 187–193, 1998.
Farquhar, G. D., Firth, P. M., Wetselaar, R., and Weir, B.: On the gaseous exchange of ammonia between leaves and the environments: Determination of the ammonia compensation point, Plant Physiology, 66, 710–714, 1980.
Feller, I. C.: Effects of nutrient enrichment on growth and herbivory of dwarf red mangrove
25
(Rhizophora mangle), Ecological Monographs, 65, 477–505, 1995.
Feller, I. C., Whigham, D. F., O’Neill, J. P., and McKee, K. L.: Effects of nutrient enrichment on within-stand cycling in a mangrove forest, Ecology, 80, 2193–2205, 1999.
Feller, I. C., McKee, K. L., Whigham, D. F., and O’Neill, J. P.: N vs. P limitation across an ecotonal gradient in a mangrove forest, Biogeochemistry, 62, 145–175, 2003.
BGD
5, 937–969, 2008 Nitrogen isotopic composition of mangrove ecosystems M. L. Fogel et al. Title Page Abstract Introduction Conclusions References Tables Figures ◭ ◮ ◭ ◮ Back CloseFull Screen / Esc
Printer-friendly Version Interactive Discussion
Fogel, M. L. and Cifuentes, L. A.: Isotope fractionation during primary production, in: Organic Geochemistry, edited by: M. H. Engel and S. A. Macko,, Plenum Press, New York, pp. 73–98, 1993.
Fry, B., Bern, A. L., Ross, M. S., and Meeder, J. F.: δ15N studies of N use by the red mangrove,
Rhizophora mangle L., in south Florida, Estuarine, Coastal, Shelf Sci., 50, 291–296, 2000.
5
Garten, C. T. and Hanson, P. J.: Foliar retention of15N-nitrate and15N-ammonium by red maple (Acer rubrum) and white oak (Quercus alba) leaves from simulated rain, Environ. Exp. Bot., 33, 333–342, 1990.
Handley, L. L., Austin, A. T., Robinson, D., Scrimgeour, C. M., and Raven, J. A.: The15N natural abundance (δ15N) of ecosystem samples reflects measures of water availability, Aust. J.
10
Plant Physiol., 26, 185–199, 1999.
Handley, L. L. and Scrimgeour, C. M.: Terrestrial plant ecology and15N natural abundance: The present limits to interpretation for uncultivated systems with original data from a Scottish old field, Adv. Ecol. Res., 27, 133–212, 1997.
Heaton, T. H. E.: Isotopic studies of N pollution in the hydrosphere and atmosphere: a review,
15
Chemical Geology, 59, 87–102, 1998.
Hermes, J. D., Weiss, P. M, and Cleland, W. W.: Mechanism of phenylalanine ammonia use of N-15 and deuteruim isotope effects to determine the chemical–lyase, Biochemistry, 24, 2959–2967, 1985.
Hietz, P., Wanek, W., and Popp, M.: Stable isotopic composition of carbon and N and N content
20
in vascular epiphytes along an altitudinal transect, Plant, Cell and Environment, 22, 1435– 1443, 1999.
Hietz, P., Wanek, W., Wania, R., and Nadkarni, N. M.: N-15 natural abundance in a montane cloud forest canopy as an indicator of N cycling and epiphyte nutrition, Oecologia, 131, 350– 355, 2002.
25
Hobbie, E. A., Macko, S. A., and Williams, M.: Correlations between foliar δ15N and nitrogen concentrations may indicate plant-mycorrhizal interactions, Oecologia, 122, 273–283, 2000. Hobbie, E. A., Jumpponen, A., and Trappe, J.: Foliar and fungal15N:14N ratios reflect
devel-opment of mycorrhizae and nitrogen supply during primary succession: testing analytical methods, Oecologia, 146, 258–268, 2005.
30
Jensen, H. S. and Thamdrup, B.: Iron bound P in marine sediments as measured by bicarbonate-dithionite extraction, Hydrobiologia, 253, 47–59, 1998.
BGD
5, 937–969, 2008 Nitrogen isotopic composition of mangrove ecosystems M. L. Fogel et al. Title Page Abstract Introduction Conclusions References Tables Figures ◭ ◮ ◭ ◮ Back CloseFull Screen / Esc
Printer-friendly Version Interactive Discussion
the Twin Cays, Belize ecosystem, Atoll Res. Bulletin No. 528, pp. 1–28, 2004.
Kao, W.-Y., Tsai, H.-C., Shih, C.-N., Tsai, T.-T., and Handley, L. L.: Nutrient contents, δx3C and
δ15N during leaf senescence in the mangrove, Kandelia candel (l.) Druce, Bot. Bull. Acad. Sin., 43, 277–282, 2002.
Leith, I. D., Pitcairn, C. E. R., Sheppard, L. J., Hill, P. W., Cape, J. N., Fowler, D., Tang, S.,
5
Smith, R. I., and Parrington, J. A.: A comparison of impacts of N deposition applied as NH3 or NH4Cl on ombrotrophic mire vegetation, Phyton-Ann. Rei Bot. A., 42, 83–88, 2002. Lipsom, D. and Nasholm, T.: The unexpected versatility of plants: organic N use and availability
in terrestrial ecosystems, Oecologia, 128, 305–316, 2001.
Kring, E. V., Lautenberger, W. J., Baker, W. B., Douglas, J. J., and Hoffman, R. A.: A new
10
passive colorimetric air monitoring badge system for ammonia, sulfur dioxide, and nitrogen dioxide, Amer. Industrial Hygiene Assoc. Journal, 42, 373–381, 1981.
Krupa, S. V.: Effects of atmospheric ammonia (NH3) on terrestrial vegetation: a review, Envi-ronmental Pollution, 124, 179–221, 2003.
Ling, F. and Silberbush, M.: Response of maize to foliar vs. soil application of N-P-potassium
15
fertilizers, J. of Plant Nutrition, 25, 2333–2342, 2002.
Macintyre, I. G., Littler, M. M., and Littler, D. S.: Holocene history of Tobacco range, Belize, Central America, Atoll Research Bulletin, 430–435, 1995.
Macko, S. A., Fogel (Estep), M. L., Hare, P. E., and Hoering, T. C.: Isotope fractionation of N and carbon in the synthesis of amino acids by microorganisms, Chemical Geology, 65,
20
79–92, 1987.
McKee, K., Feller, I., Popp, M., and Wanek, W.: Mangrove isotopic (δx5N and δ13C) fractiona-tion across a N vs. P limitafractiona-tion gradient, Ecology, 83, 1065–1075, 2002.
McKee, K. L., Cahoon, D. R., and Feller, I. C.: Caribbean mangroves adjust to rising sea level through biotic controls on change in soil elevation, Global Ecol. Biogeogr., 16, 545–556,
25
2007.
Middleton, B. and McKee, K.: Degradation of mangrove tissues and implications for peat for-mation in Belizean island forests, J. Ecol., 89, 818–828, 2001.
Muchhal, U. S. and Raghothama, K. G.: Transcriptional regulation of plant phosphate trans-porters, PNAS, 96, 5868–5872, 1999.
30
Pearson, J. and Soares, A.: Physiological responses of plant leaves to atmospheric ammonia and ammonium, Atmos. Environ., 32, 533–538, 1998.
frac-BGD
5, 937–969, 2008 Nitrogen isotopic composition of mangrove ecosystems M. L. Fogel et al. Title Page Abstract Introduction Conclusions References Tables Figures ◭ ◮ ◭ ◮ Back CloseFull Screen / Esc
Printer-friendly Version Interactive Discussion
tionation of ammonium and nitrate during uptake by Skeletonema costatum: implications for
δ15N dynamics under bloom conditions, Limnol. Oceanogr., 41, 451–459, 1996.
Presley, B. J.: Techniques for analyzing interstitial water samples. Part 1: Determination of selected minor and major inorganic constituents, Initial Rep. Deep Sea Drilling Project, 7, 1749–1755, 1971
5
Rejmankova, E. and Komarkova, J.: A function of cyanobacterial mats in P-limited tropical wetlands, Hyrobiologia, 431, 135–153, 2000.
Roadman, M. J, Scudlark, J. R., Meisinger, J., and Ullman ,W. J.: Validation of Ogawa passive samplers for the determination of gaseous ammonia concentrations in agricultural settings, Atmos. Environ., 37, 2317–2325, 2003.
10
Ruetzler, K. and Feller, I. C.: Caribbean mangrove swamps, Sci. Am., 274, 94–99, 1996. Schjoerring, J. K., Husted, S., Mack, G., Nielsen, K. H., Finnemann, J., and Mattsson, M.:
Physiological regulation of plant-atmosphere ammonia exchange, Plant and Soil, 221, 95– 102, 2000.
Sengupta, A. and Chaudhuri, S.: Arbuscular mycorrhizal relations of mangrove plant
commu-15
nity at the Ganges river estuary in India, Mycorrhiza, 12, 169–174, 2002.
Smallwood, B. J., Wooller, M. J., Jacobson, M. E., and Fogel, M. L.: Isotopic and molecular distributions of biochemicals from fresh and buried Rhizophora mangle leaves, Geochemical Transactions, 4, 38–46, 2003.
Smith, F. W.: Sulphur and P transport systems in plants, Plant and Soil, 232, 109–118, 2001.
20
Solarzano, L.: Determination of NH+4in natural water by the phenolhypochlorite method, Limnol. Oceanogr., 14, 799–801, 1969.
Stark, J. M. and Hart, S. C.: Diffusion technique for preparing salt solutions, Kjeldahl digests, and persulfate digests for N-15 analysis, Soil Sci. Soc. Am. J., 60, 1846–1855, 1996. Thode, H. G., Graham, R. L., and Ziegler, J. A.: A mass spectrometer and the measurement of
25
isotope exchange factors, Canadian J. of Res., 23, 40–47, 1945.
Wooller, M. J., Scharler, U., Smallwood, B., Jacobson, M., and Fogel, M.: A taphonomic study of δ13C and δ15N values in R. mangle leaves for a multiproxy approach to mangrove pale-oecology, Organic Geochemistry, 34, 1259–1275, 2003a.
Wooller, M. J., Smallwood, B., Jacobson, M., and Fogel, M.: Carbon and N stable isotopic
30
variation in Laguncularia racemosa from Florida and Belize: implications for trophic level studies, Hydrobiologia, 499, 13–23, 2003b.
BGD
5, 937–969, 2008 Nitrogen isotopic composition of mangrove ecosystems M. L. Fogel et al. Title Page Abstract Introduction Conclusions References Tables Figures ◭ ◮ ◭ ◮ Back CloseFull Screen / Esc
Printer-friendly Version Interactive Discussion
uptake and assimilation of ammonia by plants, Plant and Cell Physiology, 32, 1211–1217, 1991.
BGD
5, 937–969, 2008 Nitrogen isotopic composition of mangrove ecosystems M. L. Fogel et al. Title Page Abstract Introduction Conclusions References Tables Figures ◭ ◮ ◭ ◮ Back CloseFull Screen / Esc
Printer-friendly Version Interactive Discussion
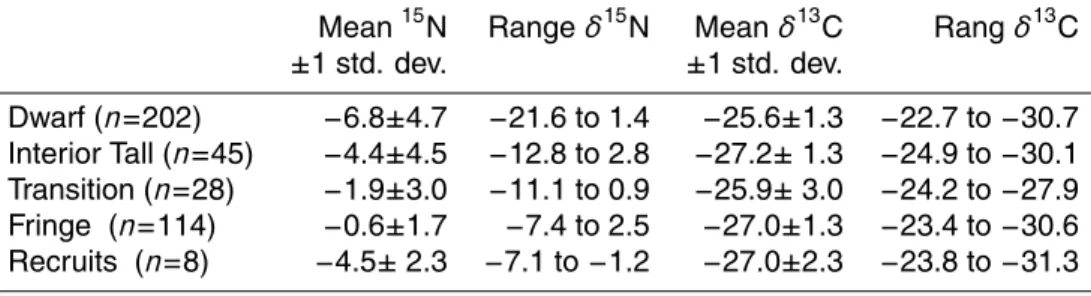
Table 1. Isotopic compositions of Rhizophora mangle leaves collected from Twin Cays, Belize,
2000-2004. Recruits are recently rooted mangrove propagules.
Mean15N Range δ15N Mean δ13C Rang δ13C
±1 std. dev. ±1 std. dev. Dwarf (n=202) −6.8±4.7 −21.6 to 1.4 −25.6±1.3 −22.7 to −30.7 Interior Tall (n=45) −4.4±4.5 −12.8 to 2.8 −27.2± 1.3 −24.9 to −30.1 Transition (n=28) −1.9±3.0 −11.1 to 0.9 −25.9± 3.0 −24.2 to −27.9 Fringe (n=114) −0.6±1.7 −7.4 to 2.5 −27.0±1.3 −23.4 to −30.6 Recruits (n=8) −4.5± 2.3 −7.1 to −1.2 −27.0±2.3 −23.8 to −31.3
BGD
5, 937–969, 2008 Nitrogen isotopic composition of mangrove ecosystems M. L. Fogel et al. Title Page Abstract Introduction Conclusions References Tables Figures ◭ ◮ ◭ ◮ Back CloseFull Screen / Esc
Printer-friendly Version Interactive Discussion
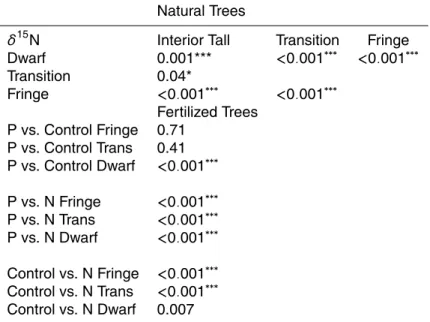
Table 2. Statistical analysis of Rhizophora mangle fresh leaf isotopic compositions as a function
of stand structures.
Natural Trees
δ15N Interior Tall Transition Fringe
Dwarf 0.001*** <0.001∗∗∗ <0.001∗∗∗ Transition 0.04* Fringe <0.001∗∗∗ <0.001∗∗∗ Fertilized Trees P vs. Control Fringe 0.71 P vs. Control Trans 0.41 P vs. Control Dwarf <0.001∗∗∗ P vs. N Fringe <0.001∗∗∗ P vs. N Trans <0.001∗∗∗ P vs. N Dwarf <0.001∗∗∗ Control vs. N Fringe <0.001∗∗∗ Control vs. N Trans <0.001∗∗∗ Control vs. N Dwarf 0.007 t Test:∗∗∗, highly significant;∗, weakly significant.
BGD
5, 937–969, 2008 Nitrogen isotopic composition of mangrove ecosystems M. L. Fogel et al. Title Page Abstract Introduction Conclusions References Tables Figures ◭ ◮ ◭ ◮ Back CloseFull Screen / Esc
Printer-friendly Version Interactive Discussion
Table 3. Isotopic compositions of tissues from a single dwarf tree from the Batfish Pond region.
“Functioning prop root” indicates that it has penetrated the substrate and produced one or more classes of finer roots. “Smaller roots” were in contact with the substrate, ranging in diameter from <0.5 mm to >8 mm.
Tissue Range δ15N Mean δ15N g Range δ13C Mean δ13C
±1 st. dev. ±1 st. dev.
Above Ground
Bud and Flower (n=4) −13.7 to −18.1 −16.8±2 −23.7 to −24.8 −24.3±0.5
Leaves (n= 5) −15.7 to −17.8 −16.9±0.8 −24.6 to −27.2 −25.9±1
Branches and Stems (n=6) −15.1 to −17.4 −16.3±0.9 −24.9 to −26.8 −25.7±0.8 New Prop roots (n=6) −16.7 to −20.2 −17.7±2 −23.3 to −25.5 −24.5±0.8 Functioning Prop roots (n=5) −15.2 to −17.4 −16.2±1.1 −22.3 to −25.4 −23.9±1.4
Below Ground
Functioning prop roots (n=3) −12.4 to −13.6 −13.1±0.6 −24.6 to −25.1 −24.8±0.3
Roots in contact −3.1 to −11.1 −7.8±4 −24.2 to −26.2 −25.2±0.8
BGD
5, 937–969, 2008 Nitrogen isotopic composition of mangrove ecosystems M. L. Fogel et al. Title Page Abstract Introduction Conclusions References Tables Figures ◭ ◮ ◭ ◮ Back CloseFull Screen / Esc
Printer-friendly Version Interactive Discussion
Table 4. N isotopic composition of fresh leaves from fertilized R. mangle experimental plots on
Twin Cays, Belize. Samples were collected and measured in 2003.
Treatment-Stand Structure Mean (n=3 for each location and treatment)
Boa Flats δ15N Dock δ15N Lair δ15N Range δ15N
P-Fringe 0.4 0.8 0.9 −0.2 to 1.7 P-Transition 0.5 1.0 0.6 −0.8 to 2.6 P-Dwarf −0.5 −0.5 0.4 −1.6 to 1.1 C-Fringe 0.2 0.8 0.5 0.5 to 1.5 C-Transition 0.7 1.6 −3.6 −7.2 to 2.7 C-Dwarf −3.2 −5.2 −7.3 −8.9 to 0.7 N-Fringe −1.0 −4.1 −2.8 −5.6 to 0.7 N-Transition −2.3 −4.4 −6.0 −8.0 to −0.7 N-Dwarf −4.8 −9.7 −8.6 −12.4 to −3.1
Boa Flats N/P(at) Dock N/P(at) Lair N/P(at) Average N/P(at)
P-Fringe 27.6 33.2 26.2 29.0 P-Transition 29.5 33.4 24.1 29.0 P-Dwarf 31.5 38.3 28.9 32.9 C-Fringe 32.8 34.0 46.2 37.7 C-Transition 41.2 47.2 57.1 48.5 C-Dwarf 52.7 42.6 54.1 49.8 N-Fringe 26.2 40.5 61.0 42.6 N-Transition 35.1 78.2 48.8 54.0 N-Dwarf 36.7 42.8 35.4 38.3
BGD
5, 937–969, 2008 Nitrogen isotopic composition of mangrove ecosystems M. L. Fogel et al. Title Page Abstract Introduction Conclusions References Tables Figures ◭ ◮ ◭ ◮ Back CloseFull Screen / Esc
Printer-friendly Version Interactive Discussion
Table 5. Ammonia emissions from Twin Cays. Floc refers to unconsolidated microbial growth
floating on surface peat sediments. Floc often occurred in thick (>1 m) banks forced to the edges of interior ponds by wind and waves. Microbial mats are consolidated sedimentary features with distinct layering (see Joye and Lee, 2004).
Zone/Treatment Mean ppm NH3-hr Mean St. dev. Range n
Dwarf 19.4 14.0 0–53.3 26 Floc 39.3 53.0 8.9–133 5 Microbial Mat 44.5 54.4 5.7–150 7 N Fertilized 30.4 32.7 8.9–100 8 P Fertilized 5.0 0–10 2 Transition 8.6 0–17.2 2
BGD
5, 937–969, 2008 Nitrogen isotopic composition of mangrove ecosystems M. L. Fogel et al. Title Page Abstract Introduction Conclusions References Tables Figures ◭ ◮ ◭ ◮ Back CloseFull Screen / Esc
Printer-friendly Version Interactive Discussion
Table 6. Isotopic compositions of ammonium plus ammonia from porewaters, rain, and
atmo-sphere from Twin and Carrie Bow Cays, Belize February 2003. *The δ15N standard was 0.1‰.
Sample δ15N Range Number
Air on Twin Cays −18.5±7.1 −29 to −6.3 18
Rain on Twin Cays −9.6±4.1 −13.3 to −4.9 4
Rain on Carrie Bow 2.0±3.6 −3.4 to 3.6 8
Porewaters 5.3±4.1 −2.8 to 12.8 11
BGD
5, 937–969, 2008 Nitrogen isotopic composition of mangrove ecosystems M. L. Fogel et al. Title Page Abstract Introduction Conclusions References Tables Figures ◭ ◮ ◭ ◮ Back CloseFull Screen / Esc
Printer-friendly Version Interactive Discussion (a) -33 -31 -29 -27 -25 -23 -21 -24 -22 -20 -18 -16 -14 -12 -10 -8 -6 -4 -2 0 2 4 6 Dwarf Tall (b) -33 -31 -29 -27 -25 -23 -21 -24 -22 -20 -18 -16 -14 -12 -10 -8 -6 -4 -2 0 2 4 6 Fringe
Fig. 1. The δ15N and δ13C of Rhizophora mangle leaves on Twin Cays, Belize. All data from these trees were collected from trees not included in specially fertilized experimental plots. (a) Interior Tall and Dwarf Trees. (b) Fringe Trees.
BGD
5, 937–969, 2008 Nitrogen isotopic composition of mangrove ecosystems M. L. Fogel et al. Title Page Abstract Introduction Conclusions References Tables Figures ◭ ◮ ◭ ◮ Back CloseFull Screen / Esc
Printer-friendly Version Interactive Discussion -33 -31 -29 -27 -25 -23 -21 -19 -17 -15 -13 -24 -22 -20 -18 -16 -14 -12 -10 -8 -6 -4 -2 0 2 4 6 Red Mangrove Black Mangrove Microbial Mats
Fig. 2. The δ15N and δ13C relationships between Rhizophora mangle, Avicennia germinans, and microbial mats.
BGD
5, 937–969, 2008 Nitrogen isotopic composition of mangrove ecosystems M. L. Fogel et al. Title Page Abstract Introduction Conclusions References Tables Figures ◭ ◮ ◭ ◮ Back CloseFull Screen / Esc
Printer-friendly Version Interactive Discussion -33 -31 -29 -27 -25 -23 -21 -24 -22 -20 -18 -16 -14 -12 -10 -8 -6 -4 -2 0 2 4 6 Lichens Leaves Bark δ15N‰ δ13C
Fig. 3. The δ15N of bark, leaves, and lichens growing on R. mangle trees at Twin Cays. The data set is for paired sets of leaf:bark:lichen collections sampled from fringe, transition, and dwarf regions around the islands.
BGD
5, 937–969, 2008 Nitrogen isotopic composition of mangrove ecosystems M. L. Fogel et al. Title Page Abstract Introduction Conclusions References Tables Figures ◭ ◮ ◭ ◮ Back CloseFull Screen / Esc
Printer-friendly Version Interactive Discussion -16 -14 -12 -10 -8 -6 -4 -2 0 0 100 200 300 400 500 600 700 800
Time after fertilization (Days)
δ
15
N
1 meter P Control Direct P Foliar Spray
Fig. 4. Response of δ15N to the addition of P to sediments over a period of approximately two years. No additional N source was added to these trees.
BGD
5, 937–969, 2008 Nitrogen isotopic composition of mangrove ecosystems M. L. Fogel et al. Title Page Abstract Introduction Conclusions References Tables Figures ◭ ◮ ◭ ◮ Back CloseFull Screen / Esc
Printer-friendly Version Interactive Discussion 0 50 100 150 200 250 300 350 400 450 0 1 2 3 4 5 6 Time (Hours) p p m N H 3 -h r Microbial mat N fertilized P fertilized Time (hours) p p m N H3 -h r (10:45am)
Fig. 5. Ammonia emissions from Batfish Pond, Twin Cays by ammonia sensing badges.
Exper-iments were initiated at 10:45am when badges were first exposed to air. Readings were taken approximately every hour until 5 pm. The tide decreased during the course of the experiment; the water depth ranged from 0cm (dry) to 50 cm. Badges were placed about 0.5–0.7 m from the sediment surface by suspending them from Rhizophora mangle branches on P fertilized trees (open circles); N fertilized trees (closed circles), and microbial mat (triangle).
BGD
5, 937–969, 2008 Nitrogen isotopic composition of mangrove ecosystems M. L. Fogel et al. Title Page Abstract Introduction Conclusions References Tables Figures ◭ ◮ ◭ ◮ Back CloseFull Screen / Esc
Printer-friendly Version Interactive Discussion -20 -18 -16 -14 -12 -10 -8 -6 -4 -2 0 2 4 0 10 20 30 40 50 60 70 80 90
P Fertilized N Fertilized Control Interior Trees
Atm. NH3 Pore water N/P at δ 1 5N ‰
Fig. 6. The δ15N of Rhizophora mangle leaves as a function of N:P (at) ratios. Interior man-grove trees include dwarf, transition, and larger trees growing on inland creeks. These trees were collected in regions not influenced by any fertilization experiments. Control trees were sampled adjacent to actively fertilized sites.
BGD
5, 937–969, 2008 Nitrogen isotopic composition of mangrove ecosystems M. L. Fogel et al. Title Page Abstract Introduction Conclusions References Tables Figures ◭ ◮ ◭ ◮ Back CloseFull Screen / Esc
Printer-friendly Version Interactive Discussion
N
2
NH
3
δ15N=0‰ δ15N=-18‰NH
4
+
δ15N=-17 ‰ Organic N δ15N=+1 to -1‰ δ15N=4‰ Microbial and algal NFig. 7. Diagrammatic scheme for nitrogen isotope pathways in microbially-dominated mangrove
ecosystems. Isotopically-light ammonia is passively taken up by leaves, then incorporated into biomass.