HAL Id: hal-00316177
https://hal.archives-ouvertes.fr/hal-00316177
Submitted on 1 Jan 1997
HAL is a multi-disciplinary open access
archive for the deposit and dissemination of sci-entific research documents, whether they are pub-lished or not. The documents may come from teaching and research institutions in France or abroad, or from public or private research centers.
L’archive ouverte pluridisciplinaire HAL, est destinée au dépôt et à la diffusion de documents scientifiques de niveau recherche, publiés ou non, émanant des établissements d’enseignement et de recherche français ou étrangers, des laboratoires publics ou privés.
Characteristics of very large aspect angle E-region
coherent echoes at 933 MHz
B. J. Jackel, D. R. Moorcroft, K. Schlegel
To cite this version:
B. J. Jackel, D. R. Moorcroft, K. Schlegel. Characteristics of very large aspect angle E-region coherent echoes at 933 MHz. Annales Geophysicae, European Geosciences Union, 1997, 15 (1), pp.54-62. �hal-00316177�
Ann. Geophysicae 15, 54—62 (1997) ( EGS — Springer-Verlag 1997
Characteristics of very large aspect angle E-region coherent
echoes at 933 MHz
B. J. Jackel1, D. R. Moorcroft1, K. Schlegel2
1 Department of Physics, University of Western Ontario, London, Ontario, Canada, N6A 3K7
2 Max-Plank-Institut fu¨r Aeronomie, Postfach 20, D-37189 Katlenburg-Lindau, Federal Republic of Germany Received: 12 February 1996/Revised: 17 June 1996/Accepted: 18 June 1996
Abstract. The EISCAT UHF radar system was used to study the characteristics of E-region coherent backscatter at very large magnetic aspect angles (5—11°). Data taken using 60ls pulses during elevation scans through horizontally uniform backscatter permitted the use of inversion techniques to determine height profiles of the scattering layer. The layer was always singly peaked, with a mean height of 104 km, and mean thickness (full width at half maximum) of 10 km, both independent of aspect angle. Aspect sensitivities were also estimated, with the Sodankyla¨-Tromsø link observing 5 dB/degree at aspect angles near 5°, decreasing to 3 dB/degree at 10° aspect angle. Observed coherent phase velocities from all three stations were found to be roughly consistent with LOS measurements of a common E-region phase velocity vec-tor. The E-region phase velocity had the same orientation as the F-region ion drift velocity, but was approximately 50% smaller in magnitude. Spectra were narrow with skewness of about #1 (for negative velocities), increasing slightly with aspect angle.
1. Introduction
It is well known that coherent radar backscatter is ob-tained from the auroral E-region. Typically, the strongest coherent echoes are observed at or near zero aspect angle (the angle between the radar wave vector and the plane perpendicular to the geomagnetic field), a situation which is well explained by linear theories of the two-stream and gradient drift instabilities. However, coherent backscatter can also be observed at aspect angles greater than 2° (large aspect angle backscatter), in contradiction to the predic-tions of linear theory. Now that non-linear theories for large aspect angle backscatter are starting to appear (Hamza, 1992; Hamza and St-Maurice, 1995), experi-mental studies of this phenomenon are particularly timely.
Correspondence to: B. J. Jackel
A series of previous experiments (Moorcroft and Schlegel, 1988, 1990; Schlegel and Moorcroft, 1989; Schlegel et al., 1990) have demonstrated the utility of the EISCAT UHF system for making detailed observations of coherent backscatter from the auroral E-region. The EIS-CAT system has two features which are extremely useful for coherent backscatter observations. First, there is the tristatic geometry, which allows measurements of echo strength and Doppler shift along three different wave vectors, and hence at different aspect angles. Secondly, the system is primarily designed for incoherent scatter observation, and is thus capable of making absolute measurements of the backscattered power right down to the incoherent scatter background.
The magnetic geometry of the EISCAT system is such that the minimum observable aspect angle is about 6° at Tromsø, and close to 4° for reception at either of the remote sites. Previous EISCAT studies of coherent echoes observed at aspect angles up to the relatively large value of 7°. In this study we shall report on the results of a June 1989 experiment, which detected coherent echoes at as-pect angles as large as 11.3°. These data have been used to retrieve height profiles of the scattering region, to deter-mine the aspect sensitivity over a wide range of aspect angles, and to examine the relationship between F-region electric fields and coherent phase velocities.
2 Experimental details
This experiment was similar to that of Moorcroft and Schlegel (1990) (which will henceforth be referred to as CP3C2), but with changes made to provide complete range-power profiles at a larger range of aspect angles. The new experiment (CP3C5) consisted of an E-region mode, designed to detect coherent echoes, followed by a F-region mode, designed to provide information about electric field conditions during the experiment. These two modes were alternated for several hours (2:37—4:45 UT) on June 14, 1989, providing a considerable amount of useful data.
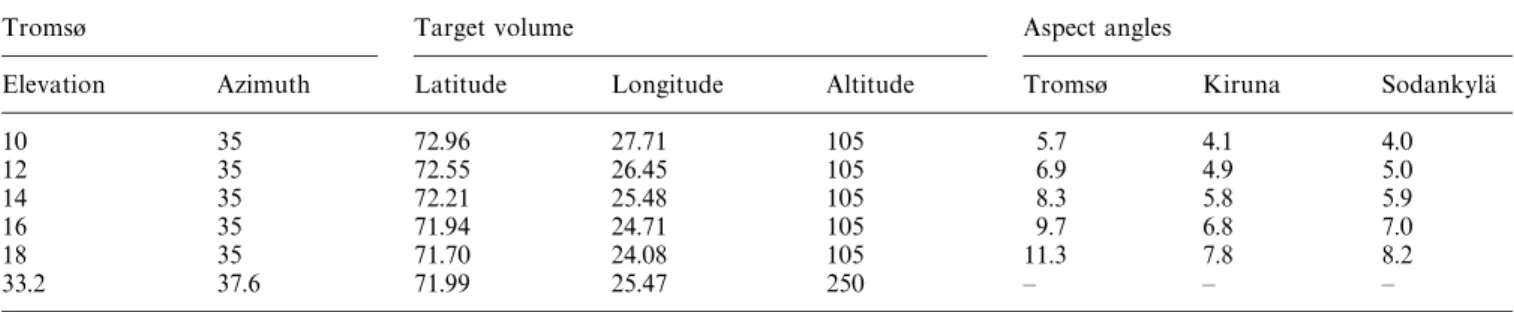
Table 1. Target locations and aspect angles
Tromsø Target volume Aspect angles
Elevation Azimuth Latitude Longitude Altitude Tromsø Kiruna Sodankyla¨
10 35 72.96 27.71 105 5.7 4.1 4.0 12 35 72.55 26.45 105 6.9 4.9 5.0 14 35 72.21 25.48 105 8.3 5.8 5.9 16 35 71.94 24.71 105 9.7 6.8 7.0 18 35 71.70 24.08 105 11.3 7.8 8.2 33.2 37.6 71.99 25.47 250 — — —
For the E-region portion of the experiment, the main transmitter (at Tromsø) was kept at a fixed azimuth, and scanned between five different elevations. The remote be-ams were directed so as to intercept the transmitter beam at an altitude of 105 km, producing five ‘‘targets’’ sepa-rated by distances of 35—60 km, with a total horizontal extent of nearly 190 km. Range-power profiles were ob-tained at Tromsø using 60ls pulses, while spectra were obtained at Tromsø and the remote sites with 360 and 1000ls pulses respectively. The F-region target was located on approximately the same field line as the 14° elevation E-region target. Experimental geometry is shown in Fig. 1; further information about the target positions and associated magnetic aspect angles is given in Table 1.
Integration periods of 5 s were used, with 4 records collected at each E-region position except for the 10° elevation target, where two extra records were taken. This was done in order to give the antennae sufficient time to return from pointing at the F-region target, which re-quired a transmitter elevation of 25.7°. During the analy-sis it became apparent that antenna motion was also
Fig. 1. A map of the EISCAT station locations and target positions for this experiment
affecting the first record at all other E-region targets; only those records unaffected by antenna motion will be in-cluded here. The total dwell time in the F-region was 110 s, with data also available at 5 s resolution, although the lower signal-to-noise ratio (SNR) associated with in-coherent scatter required that longer integration periods (60 s or more) be used in order to produce good quality spectra.
Over the course of the experiment there were several extended intervals during which coherent echoes were observed at some or all of the five E-region targets. These coherent echoes were typically characterized by greatly enhanced volume backscatter cross sections, becoming as large as 2]10~16 m~1, compared to typical ‘‘back-ground’’ levels of 1]10~18 m~1 (corresponding to inco-herent scatter from a density of about 2.5]1011 elections per cubic metre). The observed cross sections varied be-tween the five E-region targets, with the lowest elevation target (also the smallest aspect angle) observing the largest cross sections, while the cross sections observed at the largest elevation target (largest aspect angle) were only slightly larger than the incoherent scatter levels. Despite the range of observed cross sections, clear examples of coherent spectra were observed at all five E-region targets; the details of these spectra will be dis-cussed later.
3 Retrieving the scattering layer
The large range of transmitter elevations used in this experiment allowed us to determine that the scattering layer was frequently extended over a considerable geo-graphical range. For several periods, each lasting for some tens of minutes, strong echoes were observed at four or five of the E-region targets. Additionally, the range-power profiles observed at different elevations were often very similar, despite their geographical separation (and sub-stantial variations in aspect angle). These facts alone indi-cate that the radar was observing a horizontally extended region. This information can be usefully applied to deter-mine the characteristics of the vertical structure, when combined with an understanding of the nature of the available observations.
The range-power profiles observed at Tromsø are a measure of the spatial variation of scattering cross section, weighted by the effects of the radar beam shape and finite pulse length. This measurement process can be
expressed as p(oi)":
V
drl K(oi, r)p(r) (1)
where
K(oi, r) is the radar measurement kernel, which
con-tains details of the pulse length and beam shape
p(r) is the actual volume scattering cross section as a function of position
p(oi) is the apparent volume scattering cross section at a range (oi) from the radar.
Given a finite set of measurementsp(oi) it is obviously not possible to determine the complete 3-dimensional vari-ation of true scattering cross section. Consequently, some simplifying assumptions are required in order to retrieve useful information from the measurements. One powerful simplification results from the assumption that the scat-tering cross section is predominantly a function of height (z), with horizontal variations within a given range-power profile being negligible. This assumption of horizontal homogeneity is likely valid over the narrow beam width (3—4 km at ranges of 400—500 km), but will not always be true along the radar line of sight. Because of the low transmitter elevations required to observe coherent echoes, the portion of the radar beam between 90 and 120 km in altitude is extended horizontally over a range of as much as 100 km. It is certainly conceivable that condi-tions may not always be homogeneous over such an extended area. However, as mentioned at the beginning of this section, there are strong indications that, during sev-eral periods, the scattering layer was in fact horizontally extended. For the data presented in this section, we will focus on events for which similar range-power profiles were obtained for at least four of the target positions, indicating that there was little horizontal variation in scattering cross section over distances of at least 150 km. For a vertically structured scattering layer, it is possible to write the measurement process as simply
p(oi)": dzK(oi, z)p(z) (2) An analytic expression for the radar height weighting functions or measurement kernels K(oi, z) can be deter-mined for the known beam shape and pulse length. Up to this point, the treatment of the profile estimation problem has been essentially as in Moorcroft and Schlegel (1990), who then used the assumption of a Gaussian height pro-file to deconvolve the measurements. Here we will pursue an alternative approach which takes advantage of the fact that Eq. (2) is linear in the unknown quantityp(z). Conse-quently, it is possible to treat the problem as a linear estimation or retrieval problem, and obtain a profile of arbitrary shape.
The inversion of data obtained from a linear measure-ment process can be achieved by a variety of methods (see the review by Rodgers, 1976) depending on the measure-ment process, the available data, and the existence of additional constraints or a priori data. For the case at hand, we do not possess any data other than the Tromsø range-power profiles, nor do we wish to impose any constraints based on further assumptions of how the
scattering layer should vary with height. Consequently, the most appropriate method to use is the generalized pseudo-inverse, which simply retrieves a profile that cor-responds to a set of measurements most consistent with the data in a least squares sense. Basically, this procedure evaluates the integral in Eq. (2) using quadrature weights
wj
p(oi)++
j wjK(oi, zj)p(zj)"+j Kijp(zj)
(3) from which the height profile can be estimated by pJ(zj)"(KTK)~1KTp(oi) (4) This approach allows retrieval of arbitrarily shaped pro-files, with resolution limited by the characteristics of the measurement kernels, and the SNR of the measurements. Two methods were used to determine the most appropri-ate resolution for the EISCAT data: the Backus-Gilbert approach (Backus and Gilbert, 1970, also discussed in Rodgers, 1976) and synthetic modelling with a range of resolutions data with a reasonable degree of confidence. It should be noted that this resolution limit is primarily a result of the finite beam width, and that even a much larger number of high SNR measurements would not improve the resolution significantly. Decreasing the pulse length from 60ls would provide only a slight increase in the attainable resolution, at the price of decreased signal levels.
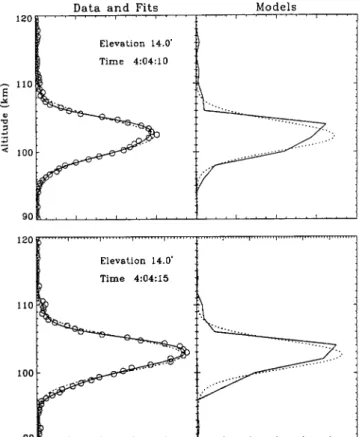
Two typical results of the generalized inversion process are presented in Fig. 2. Circles in the left panel are actual
Fig. 2. Example of scattering profile estimation. See text for ex-planation
measurements of the scattering cross section as a function of altitude. The right panel contains estimated profiles, with the solid line corresponding to the generalized in-verse discussed already. For comparison with the results of Moorcroft and Schlegel (1990), a Gaussian model (dashed line) is also included. Lines in the left panel indicate the ‘‘measurements’’ which would be expected if the estimated scattering profile were completely correct. Clearly, the agreement is quite good. Also obvious is that the profile shape, while approximately Gaussian, can be skewed or more sharply peaked. Multi-peaked profiles were never observed when echo strength was high. Some double peaked profiles were retrieved during periods of weak echoes, but these results corresponded to occasions when signals were received from only one or two elev-ations. It is likely that the apparently multi-peaked verti-cal profiles were in fact due to multiple horizontal struc-tures, such as those observed by Schlegel et al. (1990).
There is a small correction which can be included in the retrieval process in order to account for the variation of aspect angle with altitude. Coherent backscatter is known to be aspect sensitive, in that the observed echo strength decreases with increasing aspect angle. For this experi-ment, the aspect angles observed at a fixed elevation increase with range from the radar, and thus are smallest at low altitudes, increasing with height. Consequently, the signal strength will be enhanced at lower altitudes, leading to an apparent decrease in the height of the scattering layer. This effect can be accounted for by adjusting the measuring kernels, effectively increasing the area of those at lower altitudes (smaller aspect angles) and decreasing the area at higher altitudes (larger aspect angles). When doing this we assumed the aspect sensitivity as a function of aspect angle g(a) to have the form
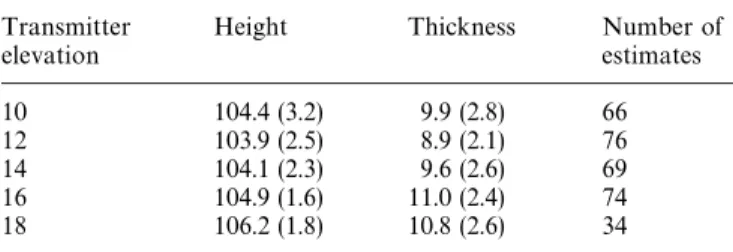
g(a)+10!0.75a dB/degree (5) wherea is the aspect angle in degrees. This is in general agreement with other results and the aspect sensitivities observed at Sodankyla¨ (but not at Kiruna, see the next Sect. for a discussion). It should be noted that the effects of this correction are small (12—1 km), and insensitive to small variations in the assumed aspect sensitivity. Applying the aspect angle correction produces the results contained in Table 2: the corrected mean height and thickness (width at half maximum) of the scattering layer at all five transmit-ter elevations.
There are a number of noteworthy features in Table 2. First, the scattering layer height is essentially the same at all five E-region targets. This is despite the considerable horizontal extent over which these observations were made, indicating that the scattering layer is not appreci-ably tilted over a distance of more than 150 km. The similarity in altitudes also occurs despite a wide range of observed aspect angles, suggesting that the physical condi-tions required for large aspect angle UHF coherent back-scatter (i.e. electron density, collision frequency) are essen-tially the same at all large aspect angles. Layer thickness behaves in a similar manner, with the mean values being quite similar at all five targets and aspect angles.
It should also be noted that although the average ob-served scattering layer was about 10 km in thickness,
Table 2. Mean scattering layer height and thickness (standard devi-ation in brackets)
Transmitter Height Thickness Number of elevation estimates 10 104.4 (3.2) 9.9 (2.8) 66 12 103.9 (2.5) 8.9 (2.1) 76 14 104.1 (2.3) 9.6 (2.6) 69 16 104.9 (1.6) 11.0 (2.4) 74 18 106.2 (1.8) 10.8 (2.6) 34
there are several occasions when the estimated layer thick-ness was closer to 6 km. However, as was mentioned earlier, the layer profiles were retrieved at 2 km resolution, which imposes a lower limit on the minimum detectable thickness. For example, two layers of thickness 150 m and 1500 m would be indistinguishable, and for noise-free data the inversion scheme used here would estimate both layers as having essentially identical thickness of 2 km. When the effects of noise are included the retrieved profile is broadened even further. For this reason, it is possible that the scattering layer was on occasion narrower than 6 km. Similar information can be deduced from the singly peaked nature of all strong profiles. Although there may have been more complicated vertical structures with scale sizes of 1 km or less, on larger scales it is certain that the scattering layer is singly peaked.
4 Determining aspect sensitivity
Having obtained estimates of the scattering layer profiles from the Tromsø data, it is quite simple to calculate the aspect sensitivity from (p0)K,S, the values of scattering cross section observed at the remote sites
gK,S"/T!/K,S10 log10 (p0)K,S(p0)T (6) where gK, gS are the aspect sensitivities for Kiruna and Sodankyla¨ respectively, in dB/degree. This technique was applied by Moorcroft and Schlegel (1990) to estimate the aspect sensitivity over the range of aspect angles 5—7°. Similar results were obtained at both remote links, due to the nearly identical aspect angles they observed. One of the goals of the new experiment was to use this approach to provide estimates of aspect sensitivity over an increased range of large aspect angles. The aspect sensitivity ob-served on the Tromsø-Sodankyla¨ link (Fig. 3a) was ap-proximately 4.5 dB/degree at the smallest observed aspect angle of 5°, and decreased to 2.5 dB/degree at an aspect angle of 10°. The mean values are somewhat lower than those measured by Moorcroft and Schlegel (1990), but the difference is less than one standard deviation (indicated by the error bars) at all elevations.
The results at Kiruna (Fig. 3b), on the other hand, are neither consistent with previous measurements, nor with the Sodankyla¨ measurements. The observed aspect sensi-tivities are at an unusually low level of 1—1.5 dB/degree, and there is no clear trend with changing aspect angle. This behaviour is puzzling, especially considering that the
Fig. 3a, b. Estimated aspect sensitivity on the a Tromsø-Sodankyla¨ and b Tromsø-Kiruna links. Dashed line is the best fit to CP3C2 data, solid line is best fit to both data sets
aspect angles observed from Kiruna and Sodankyla¨ are nearly identical (Table 1). Flow angle effects are unlikely to be responsible for the differences in observed cross sections, as the wave vectors of the two remote links differ only by 12—17°. Additionally, the direction of the F-region drift varied over a range of 50° over the course of the experiment (Fig. 6) without any corresponding change in the relative power levels observed at the remote sites. There are differences in the intersection volumes formed by the two remote beams and the Tromsø beam, but this was taken into account both in this study, and by Moor-croft and Schlegel (1990).
Lacking a geophysical explanation for the Kiruna re-sults, we have looked for evidence of equipment malfunc-tion or errors in the data processing. Careful examinamalfunc-tion of the raw data did not reveal any indications of such problems, nor is their any record of problems with the Kiruna system at time of this experiment. The Kiruna records appear to be exactly as expected, except for the unusually low power levels. Thus, at present we have no explanation for this anomaly.
5 Spectral characteristics
In addition to the range-power profiles, there were also a large number of spectra obtained at Tromsø and the remote sites, some examples of which are shown in Fig. 4. The characteristics of these spectra can be summarized in terms of their first four moments: cross section, mean Doppler shift, spectral width (standard deviation,p) and skewness, defined as the dimensionless quantity
s": dvf (v)(v!vN)3
p3
The skewness is a measure of the asymmetry of the spec-trum about its mean.
Figure 5 is a plot of spectral width and skewness against cross section and mean Doppler shift for Sodankyla¨ (Fig. 5a) and Kiruna (Fig. 5b). All spectra used for this figure had Tromsø elevations of 14° (aspect angles at Kiruna and Sodankyla¨ of 5.8° and 6.1°, respectively). The open sym-bols indicate cross sections less than 6]10~18 (echoes may be largely incoherent scatter), while the solid squares
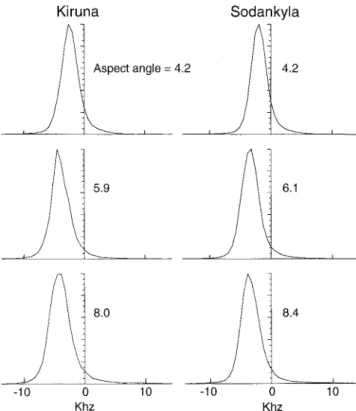
Fig. 4. Examples of coherent spectra observed at Kiruna and Sodankyla¨, for transmitter elevations of 10°, 14° and 18°
Fig. 5a, b. Comparison of the first 4 mo-ments of spectra observed on the a Sodankyla¨ and b Tromsø-Kiruna links, with a transmitter elevation of 14°. Solid symbols denote coherent scatter, while open symbols indicate inco-herent scatter (low power)
indicate stronger echoes which are almost certainly due to coherent backscatter. As would be expected, there is a great similarity between the Kiruna and Sodankyla¨ data. There are only two obvious differences: the some-what smaller Kiruna scattering cross sections (not under-stood, as discussed earlier), and the slightly larger mean Doppler shifts for Kiruna, which will be shown to be a consequence of the slightly different flow angles for Kiruna and Sodankyla¨. The most obvious feature in these figures is the clear relationship between spectral width and scattering cross section. After dropping rapidly, the spec-tral width is almost constant for scattering cross sections greater than 10~17. The widths of the coherent echoes are also nearly independent of the mean Doppler shift, but show a slight but consistent narrowing of the spectrum with increasing mean velocity.
The values of skewness for the weakest echoes are scattered around zero, as would be expected for the nor-mally symmetric incoherent scatter spectra. The calcu-lation of skewness is very susceptible to noise; the wide scattering of these estimates is due to the relatively low signal-to-noise ratio of the incoherent scatter returns. In contrast, the skewness of the strongest echoes (p'6]10~18) is much less scattered, with an average of almost #1. For spectra with a negative mean Doppler shift, this implies that the spectrum has a pronounced tail on the side of the spectrum nearest zero. This can be seen to be true in the spectra of Fig. 4.
Spectra observed from Tromsø were similar to those from the remote sites, but were of inherently lower spec-tral resolution (36 lag ACFs, versus 80 lag ACFs at the remote sites) and spatial resolution (monostatic observa-tions are obtained from a wider altitude range than bi-static), so that comparisons with the remote sites would not be appropriate. Finally, we should note that all strong echoes were associated with singly peaked spectra; al-though there were some weak echoes which exhibited more complicated spectra, these generally consisted of a coherent peak superimposed on the standard incoherent spectrum.
6 E- and F- region velocities
The experimental geometry associated with the F-region target was not ideal for determining a total ion drift velocity vector, as all three radars were looking at low elevations to the north or northeast, and the maximum angle between any two of the three radar beams was only 25° (Table 3). This meant that any errors in the line-of-sight (LOS) velocities were amplified considerably during the calculation of a merged vector (Williams et al., 1984), with the vertical component being especially poorly deter-mined. This was a purely geometrical effect, and even an integration period covering the full 110 s did not signifi-cantly reduce the scatter. Consequently, we imposed the constraint that vE"0 (no component of velocity along the magnetic field). This produced a merged velocity that was consistent with the data (RMS residuals of less than 50 m/s at all stations) and had perpendicular components that were consistent from one integration period to the
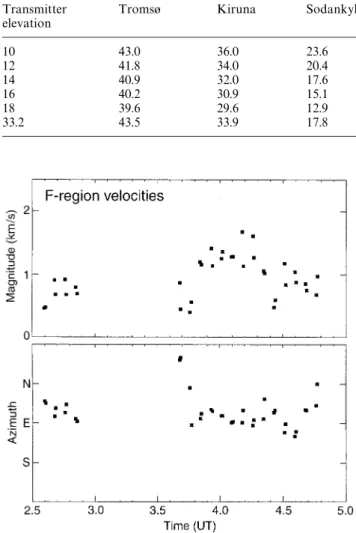
next. Figure 6 shows the merged velocity direction and magnitude during the experiment. During the period from 2.8—3.6 UT no coherent echoes were observed and the F-region data were not plotted.
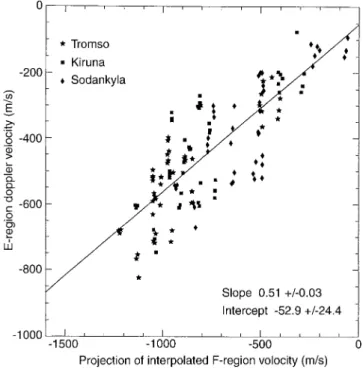
The geometry of the CP3C5 experiment, with the F-region target on the same magnetic field line as the 14° elevation target, allowed us to study the variation of E-region Doppler velocities as a function of the F-region drift velocity. Because measurements were made alter-nately in the E and F regions, a simultaneous comparison of velocities is impossible, and it was necessary to obtain drift velocities by interpolating in time between successive F-region measurements. This process unavoidably intro-duced some scatter into our results. Figure 7 displays a comparison between the line-of-sight (LOS) component of the electron drift velocity at each site (k · ve) calculated from the F-region measurements, and the measured E-region Doppler velocities. There is a clear linear relation-ship between these quantities, which holds over the entire range of observed velocities. However, the observed E-region Doppler velocity is about 50% of the F-region LOS component. Furthermore, within statistical
Table 3. Radar LOS bearing at target (degrees E of N)
Transmitter Tromsø Kiruna Sodankyla¨ elevation 10 43.0 36.0 23.6 12 41.8 34.0 20.4 14 40.9 32.0 17.6 16 40.2 30.9 15.1 18 39.6 29.6 12.9 33.2 43.5 33.9 17.8
Fig. 6. Magnitude and direction of F-region velocity during the experiment. Integration time was 45 s, and the parallel component of velocity was set to zero
Fig. 7. Comparison of measured LOS velocity to the projected component of the F-region velocity at all three sites. Stars, squares and diamonds are used to for Tromsø, Kiruna and Sodankyla¨ respec-tively. The solid line is a least squares fit to all the data; slope, intercept, and uncertainties are given in the lower right corner
uncertainty the relationship is the same for the Tromsø observations as for those at Kiruna and Sodankyla¨; that is, the relationship is the same for aspect angles of 5.8° and 8.3°. This behaviour is consistent with a previous EISCAT study (Schlegel and Moorcroft, 1989), and is also sugges-ted by observations of Hall and Moorcroft (1992) at 50 MHz. However, it is not consistent with small aspect angle results, either at VHF or UHF. At VHF the E-region velocity is found to be approximately equal to the LOS component of the F-region velocity for small vel-ocities, but with an upper limit less than or equal to the ion-acoustic velocity (Nielsen and Schlegel, 1983, 1985; Haldoupis and Schlegel, 1990; Kofman and Nielsen, 1990). At UHF the E-region velocity may be even greater than the LOS F-region component for small velocities, but again with an upper limit of something close to the ion-acoustic velocity (Moorcroft and Tsunoda, 1978; Hall and Moorcroft, 1992; del Pozo et al., 1993).
7 Discussion and summary
In these experiments coherent backscatter at 933 Mhz has been observed at aspect angles up to 11°, at which point the observed echo strengths are at approximately the same level as incoherent backscatter. Previous EISCAT experiments have reported coherent echoes up to an as-pect angle of 7.6°. At 440 MHz, Foster et al. (1992) ob-served coherent auroral backscatter at aspect angles from 0 up to about 9°, where they merged with the incoherent scatter background. An earlier very extensive study at
448 MHz by Unger et al. (1973) has recently been re-analyzed by Moorcroft (1996). On occasion that experi-ment detected coherent backscatter above the incoherent scatter background out to aspect angles of more than 13°. We might expect the backscatter to extend to somewhat higher aspect angles at longer wavelengths, since the back-scatter power at zero aspect angle also increases as the wavelength increases, at least in this range of wavelengths (Moorcroft, 1987).
There are also many reports in the literature of aspect angles greater than 10° obtained at or near 50 MHz, with low power radars and relatively low-gain antennas. Al-though reports of aspect angles of 13.5° (Haldoupis et al., 1986; Sofko et al., 1987) and 20° (McDiarmid and McNamara, 1967) almost certainly include some truly large aspect angle backscatter, it is difficult to make a di-rect comparison with the UHF observations because of the important role that ionospheric refraction and/or reflection have in these 50 MHz results (Uspensky and Williams, 1988; Moorcroft, 1989; Prikryl and Cogger, 1992).
A generalized pseudo-inverse inversion technique was applied to the 60ls pulse data to determine height profiles of the scattering layer. The height profiles were found to usually have a nearly Gaussian shape, with a mean height of 104 km and a thickness of 8 km. Within the statistical uncertainty these heights and thicknesses are independent of aspect angle over the measured range of 5.7°—11.3°. These results agree well with two earlier, less extensive measurements over smaller ranges of aspect angle. Moor-croft and Schlegel (1990) also made measurements of layer height and thickness, but those estimates were based on a much smaller number (31) of 60ls pulses measurements at aspect angles of 7° and 7.6°. They found the mean height to be about 103 km, and the mean layer thickness to be 6 km. A more recent study with the 440 MHz Mill-stone Hill radar (Foster et al., 1992) made similar measurements on data from one elevation scan, and found that over an aspect angle range of 3° to 5° the layer height and thickness were essentially constant, with values of 105 km and 6.5 km, respectively.
The estimated aspect sensitivities from Sodankyla¨ were generally consistent with those obtained at lower aspect angles, but the Kiruna values were unexpectedly low. We have been unable to find a geophysical or technical ex-planation for the discrepancy, but are still not inclined to trust the Kiruna results.
We have looked at the first three moments of the spectra (mean velocity, spectral width and skewness), and found them to behave in a similar manner over all ob-served aspect angles. The mean velocity was found to be described very well as a constant fraction (about 50%) of the line-of-sight component of the F-region drift, indepen-dent of aspect angle. This agrees well with an earlier EISCAT measurement which found the E-region Doppler velocity to be about 46% of the corresponding F-region component (Schlegel and Moorcroft, 1989). The spectral width was found to be essentially constant at a value of about 500 m/s for all scattering cross sections greater than 10~17m~1, and independent of the mean velocity over a wide range, from under 200 m/s to over 600 m/s.
Similarly, the skewness, while subject to large fluc-tuations, has an average value of about #1 which is independent of scattering cross section, and largely inde-pendent of mean velocity, although at mean velocities greater than !150 m/s the skewness drops closer to zero, seeming to change sign for those few observations where the mean velocity was positive. Schlegel et al. (1990) also made measurements of skewness on 5 s of data taken at very high time resolution, and found an average skewness of about !1 for positive velocity spectra. The observa-tions of skewness are potentially of considerable signifi-cance for the understanding of these large aspect angle echoes. A. M. Hamza (private communication, 1995) has developed a non-linear theory which predicts the skew-ness of spectra for scattering from Farley-Buneman waves. It is a fluid theory that at present applies only to small aspect angle backscatter, but it predicts that the wave-wave coupling of energy from unstable to stable regions of the k-spectrum leads to spectra with skewnesses between #1 and #3 for negative Doppler velocities, with the lower value being in good agreement with the present observations. The large aspect angle backscatter which is the subject of this study almost certainly results from more complex non-linear processes than those which are opera-tive at small aspect angle, and is also subject to additional kinetic theory effects because of the short wavelength, but there is reason to expect that the skewness is also, for these echoes, an indicator of the turbulent energy cascade from small to large aspect angles, and these estimates may serve as a guide for future theories of these large aspect angle observations.
Acknowledgements. The authors acknowledge useful discussions with A. M. Hamza. The authors are indebted to the EISCAT director and staff for running the radar and providing the data. EISCAT is an association of the national scientific agencies of Finland, France, The Federal Republic of Germany, Norway, Sweden, and the United Kingdom. This research was supported by the Natural Sciences and Engineering Research Council of Canada through a research grant (D. R. M.) and a postgraduate scholarship (B. J.).
Topical Editor D. Alcayde´ thanks T. R. Robinson and P. Jan-hunen for their help in evaluating this paper.
References
Backus, G. E., and J. F. Gilbert, Uniqueness in the inversion of inaccurate gross Earth data, Philos. ¹rans. R. Soc. ¸ondon, Ser. A., 266, 123—192, 1970.
del Pozo, C. F., J. C. Foster, and J.-P. St-Maurice, Dual-mode E region plasma wave observations from Millstone Hill, J. Geo-phys. Res., 98, 6013—6032, 1993.
Foster, J. C., D. Tetenbaum, C. F. del Pozo, J.-P. St-Maurice, and D. R. Moorcroft, Aspect angle variations in intensity, phase velocity and altitude for high-latitude 34-cm E region irregulari-ties. J. Geophys. Res., 97, 8601—8617, 1992.
Haldoupis, C., and K. Schlegel, Direct comparison of 1-m irregularity phase velocity and ion-acoustic speeds in the auroral E-region ionosphere. J. Geophys. Res., 95, 18989—19000, 1990.
Haldoupis, C., G. J. Sofko, and J. A. Koehler, On ion acoustic plasma waves at large magnetic aspect angles in the high-latitude E region of the ionosphere, J. Geophys. Res., 91, 5755—5767, 1986.
Hall, G., and D. R. Moorcroft, Magnetic aspect angle effects in radar aurora at 48.5 MHz, corrected for refraction, J. Geophys. Res., 97, 19471—19488, 1992.
Hamza, A. M., A non-linear theory for large aspect angle echoes in the auroral E region, J. Geophys. Res., 97, 16981—1993, 1992.
Hamza, A. M., and J.-P. St-Maurice, Large aspect angles in auroral E region echoes: a self-consistent turbulent fluid theory, J. Geo-phys. Res., 100, 5723—5732, 1995.
Kofman, W., and E. Nielsen, STARE and EISCAT measurements: evidence for the limitation of STARE Doppler velocity observa-tions by the ion acoustic velocity, J. Geophys. Res., 95, 19131—19136, 1990.
McDiarmid, D. R., and A. G. McNamara, V. H. F. radio aurora: simultaneous observations of auroral ionization by two separ-ated radars. Can. J. Phys., 45, 3009—3027, 1967.
Moorcroft, D. R., Estimates of absolute scattering coefficients of radar aurora, J. Geophys Res., 92, 8723—8732, 1987.
Moorcroft, D. R., Reflection and refraction by tilted layers: an explanation for VHF auroral backscatter at large aspect angles, Geophys. Res. ¸ett., 16, 235—238, 1989.
Moorcroft, D. R., A statistical study of UHF auroral backscatter at large magnetic aspect angles: a reanalysis of unpublished results from 1968, J. Geophys. Res., 101, 11005—11011, 1996.
Moorcroft, D. R., and K. Schlegel, E region coherent backscatter at short wavelength and large aspect angle, J. Geophys. Res., 93, 2005—2010, 1988.
Moorcroft, D. R., and K. Schlegel, Height and aspect sensitivity of large aspect angle coherent backscatter at 933 MHz, J. Geophys. Res., 95, 19011—19021, 1990.
Moorcroft, D. R., and R. T. Tsunoda, Rapid scan Doppler velocity maps of the UHF diffuse radar aurora, J. Geophys. Res., 83, 1482—1492, 1978.
Nielsen, E., and K. Schlegel, A first comparison of STARE and EISCAT electron drift velocity measurements, J. Geophys. Res., 88, 5745—5750, 1983.
Nielsen, E., and K. Schlegel, Coherent radar Doppler measurements and their relationship to the ionospheric electron drift velocity, J. Geophys. Res., 90, 3498—3504, 1985.
Prikryl, P., and L. L. Cogger, Statistical analysis of the spatial relationship between the radio and optical aurora: further evid-ence for refraction, Radio Sci., 27, 469—479, 1992.
Rodgers, C. D., Retrieval of atmospheric, temperature and composi-tion from remote measurements of thermal radiacomposi-tion, Rev. Geo-phys. Space Phys., 14, 609—624, 1976.
Schlegel, K., and D. R. Moorcroft, EISCAT as a tristatic auroral radar, J. Geophys. Res., 94, 1430—1438, 1989.
Schlegel, K., T. Turunen, and D. R. Moorcroft, Auroral radar measurements at 16-cm wavelength with high range and time resolution, J. Geophys. Res., 95, 19001—19009, 1990.
Sofko, G., J. A. Koehler, C. Haldoupis, M. J. McKibben, and A. G. McNamara, Doppler radio observations of 3-meter irregularities in the polar cap E region, J. Geophys. Res., 92, 1271—1276, 1987. Unger, J. H. W., R. H. Hardin, and R. J. Horan, Auroral clutter in ºHF radar, Bell Laboratories, Western Electric, and Lincoln Laboratory — Joint Radar Propagation Study, 1973.
Uspensky, M. V., and P. J. S. Williams, The amplitude of auroral backscatter. 1. Model estimates of the dependence on electron density, J. Atmos. ¹err. Phys., 50, 73—79, 1988.
Williams, P. J. S., G. O. L. Jones, and A. R. Jain, Methods of measuring plasma velocity with EISCAT, J. Atmos. ¹err. Phys., 46, 521—530, 1984.