HAL Id: hal-00295998
https://hal.archives-ouvertes.fr/hal-00295998
Submitted on 7 Aug 2006
HAL is a multi-disciplinary open access
archive for the deposit and dissemination of
sci-entific research documents, whether they are
pub-lished or not. The documents may come from
teaching and research institutions in France or
abroad, or from public or private research centers.
L’archive ouverte pluridisciplinaire HAL, est
destinée au dépôt et à la diffusion de documents
scientifiques de niveau recherche, publiés ou non,
émanant des établissements d’enseignement et de
recherche français ou étrangers, des laboratoires
publics ou privés.
with combination of micro-pulse LIDAR and MODIS
over Hong Kong
Q. S. He, C. C. Li, J. T. Mao, A. K. H. Lau, P. R. Li
To cite this version:
Q. S. He, C. C. Li, J. T. Mao, A. K. H. Lau, P. R. Li. A study on the aerosol extinction-to-backscatter
ratio with combination of micro-pulse LIDAR and MODIS over Hong Kong. Atmospheric Chemistry
and Physics, European Geosciences Union, 2006, 6 (11), pp.3243-3256. �hal-00295998�
www.atmos-chem-phys.net/6/3243/2006/ © Author(s) 2006. This work is licensed under a Creative Commons License.
Chemistry
and Physics
A study on the aerosol extinction-to-backscatter ratio with
combination of micro-pulse LIDAR and MODIS over Hong Kong
Q. S. He1,3, C. C. Li1, J. T. Mao1, A. K. H. Lau2, and P. R. Li41Department of Atmospheric Sciences, School of Physics, Peking University, Beijing, China
2The Institute for the Environment, the Hong Kong University of Science and Technology, Hong Kong, China 3Center for Satellite Remote Sensing and Measurement, Shanghai Meteorological Bureau, Shanghai, China 4Weather Modification Office, Shanxi Meteorological Bureau, Taiyuan, China
Received: 29 November 2005 – Published in Atmos. Chem. Phys. Discuss.: 18 April 2006 Revised: 7 July 2006 – Accepted: 31 July 2006 – Published: 7 August 2006
Abstract. The aerosol extinction-to-backscatter ratio is an
important parameter for inverting LIDAR signals in the LI-DAR equation. It is a complicated function of the aerosol microphysical characteristics. In this paper, a method to re-trieve the column-averaged aerosol extinction-to-backscatter ratio by constraining the aerosol optical depths (AOD) from a Micro-pulse LIDAR (MPL) by the AOD measurements from the Moderate Resolution Imaging Spectroradiometer (MODIS) is presented. Both measurements were taken on cloud free days between 1 May 2003 and 30 June 2004 over Hong Kong, a coastal city in south China. Simultaneous measurements of aerosol scattering coefficients with a for-ward scattering visibility sensor are compared with the LI-DAR retrieval of aerosol extinction coefficients. The data are then analyzed to determine seasonal trends of the aetrosol extinction-to-backscatter ratio. In addition, the relationships between the extinction-to-backscatter ratio and wind condi-tions as well as other aerosol microphysical parameters are presented. The mean aerosol extinction-to-backscatter ratio for the whole period was found to be 29.1±5.8 sr, with a minimum of 18 sr in July 2003 and a maximum of 44 sr in March 2004. The ratio is lower in summer because of the dominance of oceanic aerosols in association with the pre-vailing southwesterly monsoon. In contrast, relatively larger ratios are noted in spring and winter because of the increased impact of local and regional industrial pollutants associated with the northerly monsoon. The extended LIDAR measuments over Hong Kong provide not only a more accurate re-trieval of aerosol extinction coefficient profiles, but also sig-nificant substantial information for air pollution and climate studies in the region.
Correspondence to: C. C. Li
1 Introduction
Atmospheric aerosols play an important role in the earth’s radiation budget. They influence the lifetime and microphys-ical properties of clouds, precipitation rates and tropospheric photochemistry (IPCC, 2001; Twomey, 1977; Lohmann and Feichter, 1997; Phadnis and Carmichael, 2000), and hence are very important in climate change study (Charlson et al., 1992). However, there are still many outstanding problems related to the determination of their physical and chemical properties, as well as their spatial and temporal distributions (Andreae and Crutzen, 1997). In particular, our understand-ing of the aerosol vertical structure is still very limited be-cause of its high spatial and temporal variability.
To characterize the optical properties of atmospheric aerosols, as well as their spatial and temporal distribu-tions, the LIDAR (Light Detection and Ranging) method has proven to be very useful (Collis and Russell, 1976; Sassen and Cho, 1992; Welton et al., 2002). However, retrieval of the aerosol extinction profile from backscattered LIDAR measurements requires knowledge of the aerosol extinction-to-backscatter ratio (Fernald, 1984). In previous studies, this problem has been solved by using the high spectral resolution LIDAR techniques (Grund and Eloranta, 1991) or elastic-Raman LIDAR measurements (Ansmann et al., 1992), which have been automatically running in Oklahoma and in the Arctic as well as in the framework of EARLINET (Razenkov et al., 2004; Mattis et al., 2004) since 2000. Although both techniques allow simultaneous determination of the aerosol extinction and backscattered coefficients, one should bear in mind that both signals are sensitive to the background noise induced by scattering from ambient aerosol. Therefore, they are more appropriate for use in clean conditions like those of the Arctic and Europe. Under the circumstances of heavy aerosol loading, such as the heavy haze events occurring
frequently in South China, the above mentioned techniques might have significant errors in the retrieval of the LIDAR signal and may not be easily employed in long-term daytime observations of aerosol optical properties.
The aerosol extinction-to-backscatter ratio, or the LIDAR ratio (LR), is often used to analyze the elastic-LIDAR signal in the two-component LIDAR equation. In general, LR is a complicated spatial and temporal function which depends on the size distribution, shape and composition of the aerosols. Furthermore, the microphysical characteristics of aerosols can be classified according to their geographical origin such as urban, rural, marine or continental, and also to local mete-orological conditions. Typically, different but constant LRs are assumed and used for different types of aerosols. Many studies (Sasano et al., 1985; Kovalev, 1995) show that an inaccurate assumption of LR can lead to large errors in the retrieval of aerosol extinction coefficients, particularly under inhomogeneous atmospheric conditions where the aerosol-to-molecular extinction ratio is highly varying. Therefore, LR must be estimated carefully with respect to the geograph-ical location and meteorologgeograph-ical conditions of the measure-ment site.
Extended observations of the aerosol extinction-to-backscatter ratio have been carried out during recent years, despite the difficulty noted earlier, leading to to an explo-sive growth in the number of literatures on the measure-ment of LR in America, Asia and Europe. Table 1 lists the LR observed worldwide. Unfortunately, there are limited observations of LR in China, especially in the Pearl River Delta region, one of the most rapidly developing and heav-ily industrialized regions of southern China. Previous stud-ies show that the value of the LR varstud-ies from 20 to 100 sr (Collis and Russel, 1976; Zuev, 1982; Browell et al., 1985). Experimental studies have also been carried out concern-ing the variability of the LR by usconcern-ing data from a neph-elometer at wavelength of 680 nm and a ruby LIDAR at
wavelength of 694 nm. Waggoner et al. (1972) retrieved
an aerosol scattering-to-backscatter ratio of about 84 sr for
the relative humidity smaller than 75%. A decade later,
Salemink et al. (1984) showed a linear increase in the LR from 25 to 70 sr for the relative humidity of 40–80% at wave-length of 532 nm near the ground. Using climatological val-ues of aerosol size distributions, Ackermann (1998) modeled LR values for different tropospheric aerosol types at typical wavelengths (355 nm, 532 nm and 1064 nm) using Nd:YAG lasers. More recently, Ferrare et al. (1998) showed that a significant change in the LR is likely at the top of the atmo-spheric boundary layer (ABL).
In the absence of direct LR measurements, column-averaged LR may be estimated by constraining the verti-cal integral of LIDAR-derived aerosol extinction coefficients with independent aerosol optical depth measurements (Wel-ton et al., 2000; Chazette, 2003). Ansmann et al. (2002) showed combined observations with a multi-wavelength Sun photometer and a six wavelength backscatter LIDAR, and
discussed all the necessary input parameters. Generally, this method can be applied to LIDAR acquisitions in parallel with sunphotometer measurements.
In this paper, we shall present a method to estimate the May 2003 to June 2004 variations of the aerosol extinction-to-backscatter ratio by constraining the AOD measurements from a MPL with AOD measurements from MODIS. A simi-lar study recently shows good comparison between Meteosat and LIDAR data (Dulac and Chazette, 2003). For the first time, MODIS data are used to estimate the extinction-to-backscatter ratio. In addition, aerosol extinction coefficients near the surface are obtained by retrieving the MPL signals, and compared with measurements from a collocated visibil-ity sensor. Finally, the monthly and seasonal characteristics of the LR, and the relationship of the LR with meteorological conditions and optical parameters are also summarized.
2 Measurements
Two Moderate Resolution Imaging Spectroradiometers (MODIS) were launched aboard the polar orbiting space-crafts Terra (December 1999) and Aqua (May 2002). For the past few years, global data have been taken daily in 36 spectral bands from the visible to the thermal infrared, with 29, 5 and 2 of these bands at 1 km, 500 m and 250 m nadir pixel dimensions, respectively. A detailed description of the MODIS data can be found in Kaufman et al. (1997). Terra’s sun-synchronous orbit has a dayside equatorial local crossing time at 11:00 a.m. and the corresponding time for Aqua is 03:00 p.m. Kaufman and Tanre (1998) described two separate algorithms for aerosol retrieval from MODIS over land and ocean surfaces. Aerosol products are stored as MODIS Level 2 (MOD04 L2) files, each corresponding to five-minute acquisition along the satellite orbit. The Level 2 AODs are processed and archived at a spatial resolution of 10×10 km (at nadir). To assess the quality of these param-eters, a substantial part of the Terra-MODIS aerosol prod-ucts have been validated globally and regionally (Chu et al., 2002; Remer et al., 2005). The validation process is also un-der continuous development to ensure a high product quality. As discussed in MODIS aerosol product validation studies, the accuracy of the MODIS AOD retrievals over land is es-timated to be 1AOD=±0.05±0.2AOD (Chu et al., 2002), indicating the relative error of the retrieved AOD is 20% in general conditions (e.g. AOD>0.3) and the absolute er-ror reaches the value of 0.05 when AOD is relatively small (AOD<0.2). Similar accuracy has also been estimated to be 1AOD=±0.05±0.15AOD by Remer et al. (2005).
Aerosol characteristics are mainly determined by the geo-graphical and climatological features of the observation sites. An MPL system, operated by the Hong Kong University of Science and Technology (HKUST), is located at Yuen Long (22.44◦N, 114.02◦E), an urban area in the northwestern part of Hong Kong. Hong Kong is a densely populated city with
Table 1. Lidar ratios observed in worldwide locations.
methodology Aerosol type and location period LR, sra
Raman lidar Ferrare et al. (2001)
Southern Great Plains in north central Okla-homa
1998–1999 68±12 (355)
Raman lidar
Ansmann et al. (2001)
The polluted continental air over Sagres in Portugal
Summer of 1997 30–80 (532) six-wavelength aerosol
lidar
Muller et al. (2001b)
Hulule island in the Indian Ocean Air masses from India and Southeast Asia Mixture of clean-marine and clean-continental aerosol conditions
Clean-marine conditions February 1999–March 2000 (532) 45–75 35–55 20–30 six-wavelength aerosol lidar Muller et al. (2002)
Sagres, Portugal (ACE 2)
Air masses advected from northeastern and central parts of the European continent Maritime background aerosol
June–July 1997 (532) >40 20–40 six-wavelength aerosol lidar Ansmann et al. (2002)
Sagres, Portugal (ACE 2)
Pollution plumes from the European conti-nent June–July 1997 (532) 30–65 six-wavelength aerosol lidar Muller et al. (2003)
Hulhule Island, Maldives (INDOEX) Air masses originated from the polluted In-dian subcontinent
From northern India Southeast Asia plumes From southern India
February/March 1999 (532) 51–60 60–90 ∼50 <50 Raman lidar, Mie lidar
Nephelometer and PASP onboard C-130 Murayama et al. (2003)
Tokyo,Japan Asia dust aerosol
23 April 2001 (532) 46.5±10.5 50.4±9.4 Dual-wavelength Raman lidar Mattis et al. (2002)
Long-range Saharan dust outbreaks in Leipzig, Germany
August and October 2001 55–65 (532) 60–70 (355) Dual-wavelength
Raman lidar Mattis et al. (2004)
Leipzig, Germany (EARLINET) Three-year mean
the upper part of the PBL Free troposphere May 2000–March 2003 58 (355) 45 (1064) 53 (532) 52 (355) 53 (532) Dual-wavelength Raman lidar Muller et al. (2005) Leipzig, Germany
Well-aged forest fire plumes
May–August 2003 21–67 (355) 26–87 (532) Raman lidar
Muller et al. (2004)
An intense haze event from the Arctic re-gions across eastern Europe and Scandinavia over Leipzig, Germany
April 2002 (355&532) 35–75 Raman lidar
Sakai et al. (2003)
The Asian dust in Tsukuba, Japan 2001 and 2002 (532)
>30 (RH <50%) <30 (RH =100%) Dual-wavelength
Raman lidar Balis et al. (2003)
Young biomass burning aerosol in the free troposphere over Thessaloniki, Greece
Summer of 2001 60 (355) 50 (532) Raman lidar
De Tomasi and Perrone (2003)
Southern Italy (EARLINET)
Advected northern and eastern Europe air masses
Air masses advected from North Africa
July–December 2000 (351) 50–63 48–74 Raman lidar
De Tomasi et al. (2003)
Strong African dust outbreaks at Lecce in the southeastern corner of Italy
17 May 2001 between 18:55 and 20:07 UT (351) 50 Raman elastic-backscatter lidar Pappalardo et al. (2004)
Etna volcano aerosol layer over IMAA-CNR (Potenza, Italy)
1–2 November 2002 (355) 55
Table 2. Monthly number of simultaneous MPL and MODIS
mea-surements over Hong Kong during May 2003–June 2004. Month Number of measurements May 2003 2 June 2003 4 July 2003 14 August 2003 4 September 2003 14 October 2003 11 November 2003 20 December 2003 15 February 2004 3 March 2004 2 April 2004 2 May 2004 3 June 2004 1
an area of just over 1100 km2and a population of 6.8 million. It is adjacent to the Pearl River Delta (PRD) region, which is one of the most rapidly developing and heavily industrialized regions in southern China along the north coast of the South China Sea (Cao et al., 2003). In this regard, the MPL sta-tion in Yuen Long is useful for monitoring both oceanic and continental aerosols.
The MPL has been operated automatically and almost con-tinuously around the clock since May 2003. The site, at the rooftop of a building, is 28 m above ground level (AGL). The bin time of the MPL receiver is set to 200 ns, corre-sponding to a vertical spacial resolution of 30 m. The MPL pulse repetition rate is 2500 Hz and the wavelength is 523 nm (Nd:YLF). Backscattering signals of the MPL are recorded every 15 s. Data from 1 May 2003 to 30 June 2004, ex-cept for a maintenance period from 18 December 2003 to 13 February 2004, are used in this study. Data on cloud-free days, when the MPL and satellite data are both simultane-ously available, are selected for analysis. The monthly num-bers of selected days are listed in Table 2. There are totally 95 measurements in this period. MPL signals are averaged within a time window of ±30 min around the satellite over-passing time for use in the retrieval.
The aerosol scattering coefficients from a Belfort Model 6000 visibility sensor are used in this study. This visibil-ity sensor is detected using widely accepted principles of forward scattering. A high output infrared LED transmitter projects light at wavelength of 910 nm into a sample volume, and the light scattered in a forward direction of about 42 de-grees is collected by the receiver. The light source is mod-ulated to provide an excellent rejection of background noise and natural variations in background light intensity. It is cal-ibrated once every six months in our experiment period with a calibration kit provided by its manufactory Belfort
Instru-ment Company. Total atmospheric scattering coefficients are directly included in the digital output. Aerosol scattering co-efficients can be obtained by extracting molecule scattering parts evaluated by the Rayleigh-scattering theory.
3 Methodology
The columnar LR value is constrained by comparing the LIDAR-derived AOD at wavelength of 523 nm with the inde-pendent MODIS-derived AOD data at wavelength of 550 nm. The procedure consists of three main steps:
3.1 Retrieval of aerosol extinction coefficient from the LI-DAR measurements
In general, the inversion of the LIDAR profile is based on the solution of the single scattering LIDAR equation:
P (r) = Oc(r)CE β(r) r2 exp[−2 Z r 0 σ (z)dz] (1)
where r is the range, β(r) represents the total backscatter-ing coefficient β(r)=βm(r)+βa(r), σ (r) is the total
extinc-tion coefficient σ (r)=σm(r)+σa(r), C is the LIDAR
con-stant, which incorporates the transmission and the detec-tion efficiency, and E is the laser pulse energy. βm(r) and
σm(r)are molecular contributions to the backscattering and
the extinction coefficients, respectively. They can be evalu-ated by the Rayleigh-scattering theory from the Standard At-mosphere 1976 (NASA, 1976). Oc(r)is the overlap
correc-tion as a funccorrec-tion of the range caused by field-of-view con-flicts in the transceiver system. Systematic errors of P(r) were mainly observed in the lowest altitudes where an incom-plete overlap between the emitted laser beam and the tele-scope field-of-view can led to an underestimation of aerosol backscatter and extinction coefficients. Since the majority of aerosols are contained in the first several kilometers of the atmosphere, the overlap problem must be solved. Overlap is typically solved experimentally, using techniques outlined by Campbell et al. (2002). The starting point is an aver-aged data sample where the system is pointed horizontally with no obscuration. By choosing a time when the atmo-sphere is well mixed, such as late afternoon, or, even bet-ter, when the aerosol loading is low, backscattering through the layer is roughly assumed to be constant with range (i.e., the target layer is assumed to be homogeneous). The simi-lar overlap calibration was carried out every three months in the study period. Figure 1 presents an example of the over-lap correction derived in Hong Kong at local time (UTC+8) 14:30∼14:40 on 11 March 2003, and data within the range up to 4 km are needed to be corrected by the overlap cor-rection function. The uncertainty of the overlap corcor-rection is discussed in detail by Welton et al. (2002). In this study the uncertainty of the overlap correction is estimated to be less than 10%. The received signals are normalized to the
laser source, noise-subtracted, and square-range corrected. The overall error in the aerosol backscattered signals arose from many sources, including uncertainty of C, errors in the background and noise-subtraction, and nonlinearities in the detecting electronics. In this study, we have not taken into account effects of multiple scattering. Using numerical methods, Ackermann et al. (1999) studied the influence of multiple scattering on the retrieval of extinction coefficients of the tropospheric aerosols, and their simulation shows that the contribution from multiple scattering in the LIDAR signal is typically less than 10% and never exceeds 20% (based on the assumption of a constant extinction coefficient below the ABL (chosen at 15.65, 3.91, 1.96, 0.783, and 0.078 km−1), and an exponential decay value above the ABL). For all types of aerosols in the urban environment, the contribution of multiple scattering on the retrieved aerosol extinction profile in the ABL is found to be less than 3%. Neglecting multi-ple scattering, the LIDAR equation has three unknowns C,
βa(r), and σa(r).
The stable analytical inversion procedure proposed by Klett (1985) is more effective for optically thick atmospheric conditions, and does not have any particular advantage in the present situation with small optical depths. To determine the aerosol backscatter βa(r) and extinction coefficient σa(r),
Fernald’s (1984) forward inversion scheme is used for the LIDAR signal inversion:
σa(r) = X(r)exp[2(1−s)Rr 0σm(z)dz] C sa−2 Rr 0X(z)exp[2(1−s) Rz 0σm(z0)dz0]dz −sσm(r) (2)
whereris the range, X(r)=P (r)·r2, s=sa/sm where
sm=(8π /3) is the molecular extinction to backscatter ratio,
and sais LR.
To determine σa(r)in Eq. (2), the value of LR and the
LI-DAR constant C must be known. The retrieval of LR will be discussed in detail in Sect. 3.3. C is a main source of system-atic error for σa(r), and its calibration is performed
experi-mentally by using independently measured AODs from a Mi-crotops Sun photometer for four separate days (12 May, 30 August, 17 October 2003, and 17 February 2004) (Welton et al., 2000). The accuracy of the calibration is estimated to be ±5%. The variability in the calibration coefficient derived at intervals during the measurement period is steady and mono-tone, suggesting that the calibration coefficient from inter-polation between the measured ones can be used to retrieve σa(r)without significant error. Although the overall error
in the aerosol extinction coefficient cannot be precisely com-puted, it is estimated to be 20–30% at wavelength of 523 nm.
3.2 Validation of MODIS AOD product
MODIS AOD within 0.2◦×0.2◦ (i.e. about 20×20 km
pix-els) around the MPL site is selected to constrain the LI-DAR AOD, corresponding to the detail geographical area within a latitude range of 22.34◦N to 22.54◦N and a
lon-Fig. 1. Overlap correction of the MPL signal (at local time (UTC+8)
14:30∼14:40 on 11 March 2003, Hong Kong). The scatter plot is range-corrected signal from MPL and the line y=−0.4717x+2.364 is the least squares linear fit to the data between 4 and 6 km. The ex-tinction coefficient is 0.2358 km−1, and the full overlap is reached at approximately 4.0 km.
gitude range of 113.92◦E to 114.12◦E. Recently, Remer et al. (2005) compared 5906 MODIS AOD retrievals with AERONET measurements and confirmed that one standard deviation of the MODIS AOD retrievals falls within the pre-dicted uncertainty of 1AOD=±0.05±0.15AOD over land at a wavelength of 550 nm. Li (2002) and Li et al. (2003) com-pared AODs derived from the sunphotometer with a MODIS level 2 AOD product for almost 2 years, and concluded that the level 2 MODIS AOD product is of a high precision over South China where the surface reflectivity is relatively low for visible wavelengths due to dense perennial vegetation coverage in the region.
3.3 Retrieval of LR
A “Look-up Table” approach based on inter-comparison of AOD values derived from MPL and MODIS data is used in the retrieval of LR. Given the uncertainties of the AOD re-trievals, the difference in wavelengths is negligible between MODIS and MPL measurements. Paolo Di Girolamo (1999) noted that the overall variability of LR in the 355–723 nm spectral range does not exceed 15% for aerosol size range of 0.1 µm to 1.0 µm. When LR increases monotonically from 5 to 100 in unit steps, different vertical profiles of the ex-tinction coefficient at wavelength of 523 nm can be derived with Eq. (2). The AOD value can then be obtained from the integral of the extinction coefficient from the surface
5 10 15 20 25 30 35 40 45 0 0.1 0.2 0.3 0.4 0.5 0.6 0.7 0.8 0.9 1
Extinction to backscatter ratio (sr)
AOD
AOD derived from MODIS
ΔAOD=±0.2AOD
Retrieved LR AOD derived from lidar according to the different LR
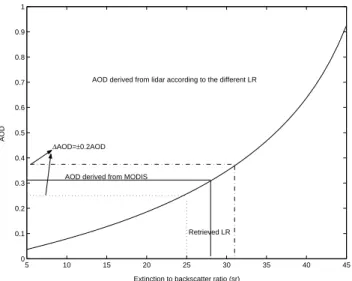
Fig. 2. An example of LR retrieval by constraining the LIDAR
AOD with MODIS AOD. The curve is the LIDAR AOD obtained with different LRs. The horizontal solid line is the MODIS AOD measurement, and the vertical line dropped at its intersection with the curve defines the best LR. The maximum error in AOD is shown by the horizontal dotted and dashed lines, and the maximum error in LR is shown by the vertical dotted and dashed line).
(ground level) up to 4 km, assuming the absence of strato-spheric aerosols. Elastic LIDAR measurements show that aerosols in those very high layers contribute very little to the total AOD. Additionally, for the lowest layer (0∼130 m), the aerosol extinction coefficient closest to the ground is cho-sen to reprecho-sent the extinction at the missing heights when calculating AODs. Figure 2 shows an example of a typical retrieval process for the LR. The LR value that leads to the LIDAR AOD closest to the MODIS AOD is defined to be the best-estimated extinction-to-backscatter ratio during the ob-servation period. The process is constrained specifically so that the AOD derived from the MPL data is equal to the one from MODIS data at wavelength of 550 nm during the days selected. In the figure we can see that the best agreement be-tween the AODs from both measurements is obtained at an LR value of 28 sr. The relative uncertainty of the MODIS measurements yields an uncertainty of ±3 sr for LR. Finally, we also note that the vertical profiles of the extinction coef-ficient are based on the averaged measurements from MPL cloud-free data taken over every 60 min.
4 Results
4.1 Inter-comparison of MPL retrieved extinction
coeffi-cient with scattering coefficoeffi-cient
It is difficult to validate the retrieval results due to the lack of in-situ measurements, but it is feasible to evaluate the LR by comparing the near-surface (AGL∼130 m) aerosol extinction
0 0.2 0.4 0.6 0.8 1 0 0.5 1 1.5 2 2.5 3 3.5 4 4.5 Extinction coefficient (km−1) Altitude (km) 0 0.1 0.2 0.3 0.4 0.5 0 0.5 1 1.5 2 2.5 3 3.5 4 4.5 Extinction coefficient (km−1) Altitude (km) a) b)
Fig. 3. The hourly averaged aerosol extinction coefficient
pro-files retrieved from the MPL data (solid line with asterisk) and the visibility sensor data (circles on the x-axis): (a) at 11:00 a.m. on 1 November 2003 (LR=36 sr and MODIS AOD=0.87) and (b) at 01:00 p.m. on 27 November 2003 (LR=23 sr and MODIS AOD=0.41).
coefficients derived from the LIDAR with the surface scatter-ing coefficients from the Belfort forward visibility sensor.
Figure 3 shows the hourly averaged vertical aerosol extinc-tion coefficient profiles retrieved from the MPL data with the above determined LR (a) at local time 11:00∼12:00 a.m. on 1 November 2003 and (b) at local time 01:00∼02:00 p.m. on 27 November of 2003. The corresponding AODs were found to be 0.87 (LR=36 sr) and 0.41 (LR=23 sr), respectively. The simultaneous aerosol scattering coefficients at 910 nm ob-tained by the visibility sensor are plotted on the x-axis. In Fig. 3a the LIDAR-derived surface extinction coefficient is about 0.808 km−1, which is the value closest to the ground level (AGL∼130 m) in the vertical aerosol extinction coeffi-cient profile. In contrast, the visibility sensor measured an aerosol scattering coefficient of 0.344 km−1. For discrete aerosol layers found above 2 km, this can be attributed to the residual layer formation from the previous day or migration from remote areas. The value of LR is comparable with the values found during the INDOEX experiment over urban ar-eas in the Asian tropical regions (Muller et al., 2001a). The
˚
Angstr¨om exponent value of 0.84 from MODIS level 2 prod-ucts indicates the presence of bigger particles in the atmo-sphere, such as mineral and dust aerosols, possibly originat-ing from industrial and urban activities in the city. This can further be verified by analyzing the corresponding satellite data as well as the air mass back-trajectory.
Figure 4 shows the MODIS AOD data over the PRD region at local time 11:20 a.m. on 1 November 2003. High AOD values were found in the north-western part of Hong Kong, indicating the presence of advected aerosols
Fig. 4. Level 2 MODIS aerosol optical depth (MOD04, version 4)
at local time 11:20 a.m. on 1 November 2003. The highly turbid air mass originated from the center of the Pearl River Delta was transported to its surroundings. The MPL site (Yuen Long, YL) is marked on the top left corner of the inner rectangular box showing Hong Kong (HK), Guangzhou (GZ), a large city in South China is also marked on the center of high AOD contours.
(0.8<AOD<1.2) from local urban activities or industrial sources in the PRD region. The blank area in Fig. 4 near Guangzhou (marked “GZ” in the center of the figure) has no AOD measurements from MODIS for cloud mask algorithm suggests the existence of clouds. However, this may be an error in the cloud mask algorithm under the conditions of considerable AOD loading existing over the PRD region.
In Fig. 3b MPL extinction profiles indicate that aerosols are mainly confined below 1.5 km for a moderate pollution
condition. The LIDAR-derived surface extinction
coeffi-cient is about 0.415 km−1, while the visibility sensor mea-sured a scattering coefficient of 0.282 km−1at wavelength of 910 nm. The aerosol extinction-to-backscatter ratio of 23 sr on this day can be considered as a typical value for maritime aerosols. The MODIS measured ˚Angstr¨om exponent is 0.46, indicating the presence of slightly larger particles in the at-mosphere, such as sea salt and mineral aerosols. In fact, over urban or industrial areas, optical properties are dominated by fine particles (Dubovik et al., 2002). Under maritime condi-tions, the relative contribution of coarse particles are variable (Smirnov et al., 2002) and generally higher than those over urban or industrial areas but lower than desert dust (Dubovik et al., 2002).
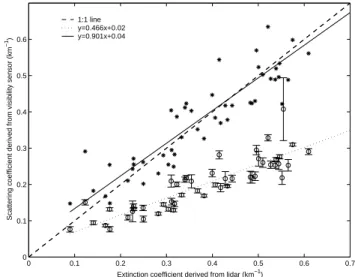
Figure 5 presents the scatter plots of the surface aerosol extinction coefficient observed by the MPL and the scatter-ing coefficient by the visibility sensor. The error-bar on each circle denotes the standard deviation of the hourly-averaged scattering coefficient sensed from the visibility sensor at 910 nm. The slope of the best fit curve of the scatter plots is about 0.5, showing that the scattering coefficient derived from the visibility sensor is systematically less than the one from MPL. The main reason for the difference is they are
0 0.1 0.2 0.3 0.4 0.5 0.6 0.7 0 0.1 0.2 0.3 0.4 0.5 0.6
Extinction coefficient derived from lidar (km−1)
Scattering coefficient derived from visibility sensor (km
−1
)
1:1 line y=0.466x+0.02 y=0.901x+0.04
Fig. 5. Inter-comparison of the near-surface aerosol extinction
co-efficient derived from MPL and the visibility sensor. The error bars on the circles represent the standard deviation of hourly-averaged forward scattering coefficient. The asterisks are the comparison be-tween the extinction coefficient from LIDAR and the ones from the visibility sensor but on 532 nm LIDAR wavelength which are cal-culated by a single scattering albedo of 0.9 and aerosol ˚Angstr¨om exponent of 1.0.
measured on different wavelengths. The LIDAR worked on visible green light (wavelength 523 nm); while the forward scattering visibility sensor used an infrared LED at 910 nm as its light source. The extinction coefficients at infrared should be much less than those at green light obeying the ˚Angstr¨om change with wavelength. Another reason for this difference is the absorption of aerosols. The scattering coefficients mea-sured by the visibility sensor do not include the absorption coefficients. In highly turbid areas such as the PRD, the influ-ence of absorbing aerosol on the extinction coefficient could not be neglected (Ansmann et al., 2005). Considering the above two causes, the aerosol scattering coefficients from the visibility sensor are converted into extinction coefficients at the same wavelength as that of LIDAR according to a single scattering albedo of 0.90 and aerosol ˚Angstr¨om exponent of 1.0, and the scatter plots of disposed results are represented as asterisks. In this situation, their correlation coefficient re-mains the same (∼0.91) as corrected before. After the cor-rection the slope of the best fit curve is increased to 0.9 and the root mean square error (RMS) is also evidently decreased to ∼0.07 km−1compared with the previous one ∼0.21 km−1,
which suggest the correction is reasonable. However, the two measurements still have some differences after the correc-tion, especially in highly turbid conditions with a maximum difference of up to 0.6 km−1. The discrepancy may be mostly due to the fact that the comparison is performed at different altitudes, i.e., the MPL data were obtained at 130 m while the visibility sensor at about 2 m above ground. Although the measurements were taken around noon (10:00–14:00 local
10 20 30 40 50 0 5 10 15 20 25
Aerosol extinction to backscatter ratio (sr)
Occurring frequency 10 20 30 40 50 0 0.2 0.4 0.6 0.8 1
Aerosol extinction to backscatter ratio (sr)
Cumulative frequency
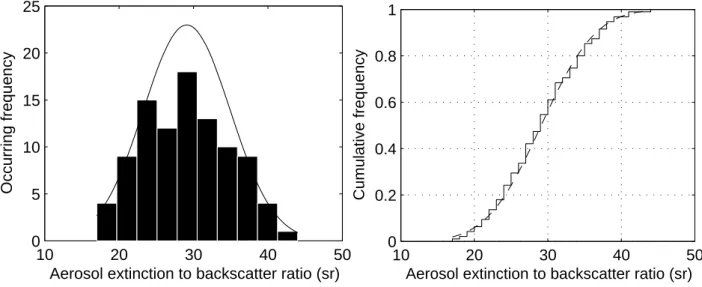
Fig. 6. (a) Frequency distribution and (b) cumulative frequency distribution of the aerosol extinction-to-backscatter ratio over Hong Kong.
The solid line in (a) and dashed line in (b) are Gaussian distribution fit curves according to the statistical parameters listed in Table 3.
time) when the boundary layer is generally considered to be well-mixed, the extinction coefficient actually increases with height within the mixing layer, as observed from the avail-able extinction coefficient profile above the missing height; therefore, the extinction coefficient from the visibility sensor may be less than those calculated from the MPL data. De-spite all the above sources of error, it can be shown that the extinction coefficients estimated from MPL have a good re-lationship with in situ measurement of the visibility sensor as their correlation coefficient reaches a value of above 0.90 and the RMS drops to a relatively small value of 0.07 km−1. The analysis indicates that LR derived by the combina-tion of MPL and MODIS can reasonably represent the actual characteristics of atmospheric aerosols over Hong Kong.
4.2 Overview of LR characteristics
For the whole measurement period, the extinction-to-backscatter ratio has an averaged value of 29.1±5.8 sr with a maximum of 44 sr (5 March 2004) and minimum of 18 sr (15 July 2003) over Hong Kong as estimated from the MODIS AOD and the LIDAR AOD below 4 km. In general, LR can be used to identify the dominant aerosol type (Ackermann, 1998). It is suggested that larger particles accompanied by less-absorbing particles result in smaller LRs and highly ab-sorbing particles should have larger LRs (Ansmann et al., 2001). For maritime aerosols, Ackermann (1998) found the average LR range from 17 sr to 24 sr. Recently, De Tomasi and Perrone (2003) reported LR measurements over south-eastern Italy with average values ranging from 23 sr to 44 sr for air masses advected from the West Atlantic and
Mediter-ranean Sea. On the southwestern coast of India (Goa),
Chazette (2003) reported an average value of 35.7±10 sr in
February 1999. Muller et al. (2001b), using six-wavelength aerosol LIDAR, retrieved more than one year of LRs ranging from 35 to 55 sr for a mixture of marine and continental aerosol conditions and from 20 to 30 sr for clean-marine conditions at wavelength of 532 nm over Hulule Is-land in the Indian Ocean. Hence, the mean LR calculated in this study suggests more characteristics similar to those of maritime aerosols.
Figure 6a shows that the modal value of LR (18 out of 95) is observed in the range 27.8 sr to 30.5 sr if all the available LRs are binned into ten equally spaced segments. The solid line denotes the Gaussian distribution fit curve according to the parameters listed in Tables 3. The Gaussian distribution is used to represent the cumulative frequency distribution of the LR. Two tests, namely the Jarque-Bera test and the Lil-liefors test, are employed to check the quality of the fitted distribution function. The Jarque-Bera test evaluates the hy-pothesis that a sample has a normal distribution with an un-specified mean and variance, against the alternative that the sample does not have a normal distribution. The Lilliefors test is similar to the Kolmogorov-Smirnov test except for ad-justing the parameters of the normal distribution which is es-timated from sample rather than specified in advance. For both tests, threshold values reaching a significance level of 95% are given in Table 3. We find that both tests accepted the hypothesis that the binned LR distribution approximates a Gaussian distribution at the 95% confidence level. Figure 6b shows the cumulative frequency distribution of the LR (solid line) and Gaussian distribution fit curve (dashed line).
Table 3. Statistical parameters of extinction-to-backscatter ratio observed in Hong Kong.
No. of skewness kurtosis µ σ significance
sample level
lower upper lower upper
95 0.183 2.457 27.908 29.095 30.282 5.100 5.827 6.798 95%
4.3 Seasonal characteristics of LR
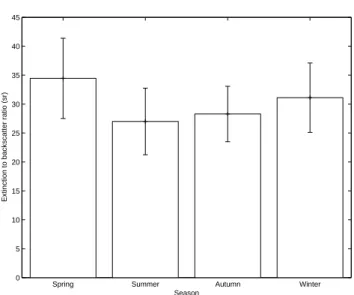
Figure 7 shows the seasonal variation of LR in Hong Kong. In this analysis we take March, June, September and Decem-ber, respectively, as the first month of spring, summer, au-tumn and winter. The error bar is the standard deviation of LR in each season. The highest peak of LR is 34.4±6.9 sr in the spring and the lowest value is 26.4±6.4 sr in the sum-mer. The lower troposphere over Hong Kong is affected by continental pollutants. By analyzing aircraft data, Kok et al. (1997) found that complex flow patterns are impor-tant in controlling both the local and regional transport of pollutants over Hong Kong. Under the influence of Asian pollutants, high values of LR, up to 100 sr, and an aver-age of 59±24 sr have been measured during the February– March 1999 INDOEX intensive field experiment (Franke et al., 2001). The monthly mean extinction-to-backscatter ra-tio of the haze layer over the PRD region in October 2004 is 46.7 sr (Ansmann et al., 2005). Therefore, the higher LR values in spring are quite realistic and due to the influence
of the continental outflow over Southern China. In
con-trast, the lower LR values in the summer are characteristic of maritime aerosols. This interpretation is consistent with the back-trajectory and residence time analysis by Louie (2005), which shows prevailing northeasterly winds from the conti-nent in autumn and winter and a southerly flows from the South China Sea in summer. The Asiatic monsoon is the dominant driver of winds over the PRD region, and signifi-cantly influences the local and regional pollutants transport (Chang and Krishnamurti, 1987). In winter, strong radia-tive cooling over the continent creates a high-pressure anti-cyclone that drives the cold and dry air from the continent to the ocean, resulting in a weak to moderate northeasterly or strong northerly winds (Murakami, 1979). In spring, mod-erate northeasterly winds are predominant. In summer, a low-pressure trough draws moist warm air from the ocean towards the continent, resulting in frequent occurrence of precipitation. Finally, in autumn, oceanic southerly weak-ens while easterly and northeasterly flows become stronger. Over Hong Kong, the persistent northeast monsoon in spring and winter carries pollutants from various potential sources over the southeastern regions of China, while the southerly monsoon brings cleaner maritime air during the summer. In general the different prevailing wind directions in summer
Spring Summer Autumn Winter
0 5 10 15 20 25 30 35 40 45 Season
Extinction to backscatter ratio (sr)
Fig. 7. Seasonal mean aerosol extinction-to-backscatter ratio at
523 nm derived from MPL together with MODIS AOD measure-ments in Hong Kong between May 2003 and June 2004. The error bars represent the standard deviation.
and winter are the main cause of the seasonal variations of the LR over Hong Kong.
Table 4 presents the statistical parameters of the seasonal aerosol extinction-to-backscatter ratio, ˚Angstr¨om exponent and surface extinction coefficient observed in Hong Kong. The correlation coefficient is –0.51 in summer indicating a significant anti-correlation between the ˚Angstr¨om expo-nent and the LR. While the mean LR is 27±5.8 sr and the mean ˚Angstr¨om exponent is 1.49±0.68. The large value of
˚
Angstr¨om exponent indicates the existence of smaller parti-cles, possibly pollutant-related. However, the corresponding small value of LR may be attributed to the mixing of some sea-salt aerosols (Ackermann, 1998; Muller et al., 2001a; Franke et al., 2001; Cattrall et al., 2005).
4.4 Relationship of LR with meteorological conditions and optical parameters
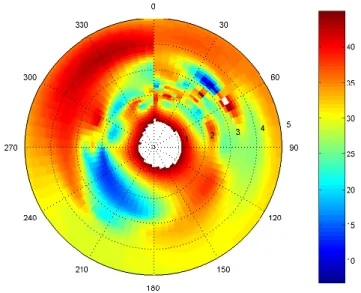
To understand the variation of LR at a location, it is impor-tant to examine the relationship between LR and the vari-ous potential pollutant sources. Figure 8 presents the LR distribution in relation to wind direction and wind speed
Table 4. Statistical values of aerosol extinction-to-backscatter ratio,
˚
Angstr¨om exponent and surface extinction coefficient for different seasons.
Spring summer autumn winter
Aerosol extinction-to-backscatter ratio, sr
Mean 34.4 27 28.3 31.1 Std. 6.9 5.8 4.8 6.0 Maximum 44 37 39 39 Minimum 25 18 19 19 Median 35 26 28 32.5 ˚ Angstr¨om exponent Mean 0.90 1.49 1.05 0.76 Std. 0.38 0.68 0.36 0.25 Maximum 1.63 2.99 2.19 1.31 Minimum 0.49 0.41 0.41 0.31 Median 0.87 1.48 1.03 0.72
Surface extinction coefficient, km−1(MPL)
Mean 0.32 0.14 0.35 0.42
Std. 0.13 0.09 0.15 0.18
Maximum 0.52 0.42 0.81 0.90
Minimum 0.09 0.05 0.09 0.12
Median 0.32 0.11 0.33 0.43
Surface extinction coefficient, km−1(Visibility sensor)
Mean 0.21 0.09 0.20 0.22
Std. 0.08 – 0.08 0.09
Maximum 0.33 0.09 0.41 0.50
Minimum 0.08 0.09 0.08 0.13
Median 0.21 0.09 0.20 0.21
observed by an Automatic Weather Station (AWS) collo-cated with the MPL. It is seen that the LR values over Hong Kong are lower (18–28 sr) under prevailing south-westerly conditions when oceanic aerosols are being car-ried over Hong Kong. These low values are also partly due to aerosols composed of sea-salt with negligible absorption. The lowest value of LR found under the northeasterly wind speed (less than 3 m/s) conditions implies that typical oceanic aerosols from the northwest Pacific Ocean have advected to the MPL site. Larger values of LR (up to 40 sr) are asso-ciated with strong southeasterly winds. Moreover, LR may go up to about 40 sr under weak wind conditions regardless of the wind direction; this may be related to the dominance of local urban/industrial emissions with strong absorption near the MPL site. The largest LR values are associated with moderate to strong northwesterly winds (greater than 3 m/s), suggesting that regional transport from the densely-populated southeastern China may have contributed signifi-cant amounts of absorptive aerosols. However, the impact is less significant under moderate-to-weak winds conditions.
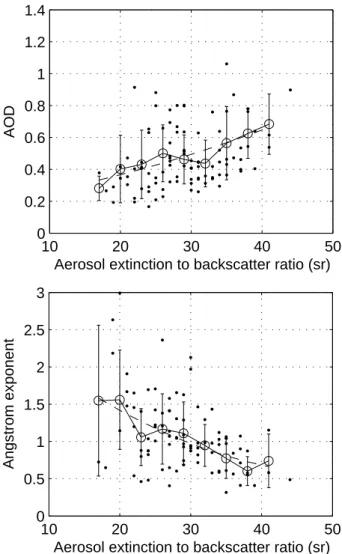
Figure 9 shows the relationship of the retrieved LR, the corresponding ˚Angstr¨om exponent and AOD. Here, the mean and standard deviations are computed at nine equally spaced bins of LR. The dashed line represents the best polynomial fit y=ax2+bx+cwhere y is the AOD (or ˚Angstr¨om exponent), and x is the LR. A least-square procedure was employed to
Fig. 8. The variation of aerosol extinction-to-backscatter ratios (unit
of color scale is sr) as a function of wind speed and direction.
determine the polynomial fit parameters; these parameters, as well as the correlation coefficients of the fit, are listed in Ta-ble 5. Figure 9a shows that a slight increase in AOD is associ-ated with an increasing LR; this may be relassoci-ated to an increase in absorption by aerosols or a relative increase in extinction induced by hygroscopic particles. Figure 9b shows that the LR increases as the ˚Angstr¨om exponent decreases, which is different from the study by Ansmann et al. (2001), but simi-lar to the result of Anderson et al. (2003) found for pollution outbreaks advected from China over the Pacific. We note that the ˚Angstr¨om exponent is directly related to the slope of a Junge-type size distribution. Because LR is dependent upon the aerosol phase function and the single scatter albedo in the form Sa=ω04πP (π ), it is sensitive not only to changes
in particle size, but also to the shape and refractive index. Except for absorptive particles, the large dust like aerosols characterized by a relatively small backscattering component may be responsible for the larger LR. A low ˚Angstr¨om expo-nent may result from continuous city construction, low plant coverage, ubiquitous local floating dust and large amounts of soot generated from industrial coal combustion and culinary natural gas (Li et al., 2003). Large ˚Angstr¨om exponents and the corresponding small LRs might be related to the mixing of sea-salt and urban aerosols. According to the mean radius of basic aerosol constitution of Standard Radiation Atmo-sphere (SRA), the effective radius of water-soluble aerosol is smaller than that of soot and dust-like aerosol. We note that water-soluble aerosol is predominant over the PRD, but the particle effective radius will increase due to the mani-foldness of soot and/or dust-like aerosol particles as the air parcel becomes more polluted. This implies that (a) the rel-atively lower optical depth (i.e. in a clean atmosphere) is as-sociated with a small extinction-to-backscatter ratio and (b)
10 20 30 40 50 0 0.2 0.4 0.6 0.8 1 1.2 1.4
Aerosol extinction to backscatter ratio (sr)
AOD 10 20 30 40 50 0 0.5 1 1.5 2 2.5 3
Aerosol extinction to backscatter ratio (sr)
Angstrom exponent
Fig. 9. (a) Scatter plots of LR versus AOD and (b) LR versus
˚
Angstr¨om exponent. The circles and error bars represent the corre-sponding average values and standard deviations, respectively, com-puted at 9 equally spaced bin of LR. The dashed lines represent fitting curves by using the polynomial in Table 5.
large particles contribute more under the situation of a heavy haze event. The latter is related to the fact that continental air mass brings not only absorptive industrial and urban aerosols but also dust-like particles from bare ground or remote area, and fine particles consisting mainly of water-soluble materi-als under clean conditions. In addition, the large LRs can materi-also be explained by deviations between the scattering character-istics of spheres and spheroids as well as due to absorption by the dust particles.
5 Conclusions
The aerosol extinction-to-backscatter ratio at 523 nm from May 2003 to June 2004 has been examined based on the ex-tinction coefficient profile by MPL and the MODIS AOD
Table 5. Parameters of polynomial fits (y=ax2+bx+c, where y is the AOD or ˚Angstr¨om exponent and x is the LR) and the corre-sponding correlation coefficients (R2)for both cases.
AOD vs. LR Angstr¨om exponent vs. LR˚ R2 0.93 –0.93
a –0.00013 0.00077 b 0.0625 –0.0830 c 0.1894 2.7687
in Hong Kong. Comparisons between the LIDAR-derived aerosol extinction coefficients near the surface and Belfort visibility sensor measured scatter coefficients are conducted. After absorption correction and wavelength correction good agreements between the two parameters with a correlation coefficient of 0.91 and an RMS of 0.07 km−1are noted, in-dicating a reasonable LR retrieval over the MPL site. Pre-liminary analysis indicates that the aerosol extinction-to-backscatter ratio spans the range from 18 sr to 44 sr. The average LR is about 29.1±5.8 sr in this study which is well within the value for oceanic aerosols. Two statistical tests have been employed to check the frequency distribution of the LR, and both tests confirm that the frequency distribution is Gaussian.
Specifically, the temporal distribution of LR is used to link and interpret LR variations with climatic and synoptic back-ground conditions. This study reveals an essential depen-dence of LR on the Asiatic monsoon which is the dominant circulation feature over the PRD and East Asia. The lower LR value in summer is characteristic of the dominance of oceanic aerosols. In contrast, the larger LR values in spring and winter are associated with the contribution of local and regional industrial pollutants transported by the prevailing northerly and easterly winds over the observation site. Fur-thermore, there is a strong dependence of LRs on synoptic conditions such as wind speed and wind direction; larger val-ues of LR are found to correspond well with strong easterly and northerly winds and significantly lower LR values are associated with prevailing southerly. In addition, the correla-tion between LR and AOD together with the anti-correlacorrela-tion between LR and the ˚Angstr¨om exponent imply that the LR can be used to link up the macroscopic and microscopic char-acteristics of aerosols over the PRD region.
Continental and anthropogenic aerosols have a major im-pact on the LR values during the spring and winter seasons, which play a very important role in the regional aerosol bud-get. The LR data obtained in this study over Hong Kong pro-vides valuable information for LIDAR retrieved aerosol ex-tinction coefficient and gives an excellent chance to further investigate the vertical distribution of aerosols. Finally, we also note that these data are also very useful as input parame-ters for exact radiative transfer models (RTM) over southern China.
Acknowledgements. The MODIS data are provided by the NASA’s
Earth-Sun System Division, archived and distributed by the Goddard Earth Sciences (GES), Data and Information Services Center (DISC) and Distributed Active Archive Center (DAAC). We would like to acknowledge the Hong Kong University of Science and Technology (HKUST) for providing the LIDAR data for this study. This study is partially supported by the joint research grants from the National Natural Science Foundation of China (NSFC) and Research Grant Council (RGC) of Hong Kong (Grant number: N HKUST630/04), the grant from NSFC (Grant Number: 90211001, 40575001) and the grant from the National Basic Research Program (also called 973 Program, Grant Number: G1999045700) of China. We are also grateful for the large amounts of valuable comments on the earlier draft published on ACPD provided by two anonymous reviewers and editors of this journal. Edited by: R. Volkamer
References
Ackermann, J.: The extinction-to-backscatter ratio of tropospheric aerosols: a numerical study, J. Atmos. Ocean. Tech., 15, 1043– 1050, 1998.
Ackermann, J., Volger, P., and Wiegner, M.: Significance of multiple scattering from tropospheric aerosols for ground-based backscatter, Appl. Opt., 38(24), 5195–5201, 1999.
Anderson, T. L., Covert, D. S., Ahlquist, N. C., Howell, S. G., Clarke, A. D., and McNaughton, C. S.: Variability of aerosol optical properties derived from in situ aircraft measure-ments during ACE – Asia, J. Geophys. Res., 108(D23), 8647, doi:10.1029/2002JD003247, 2003.
Andreae, M. O. and Crutzen, P. J.: Atmospheric aerosols: Biogeo-chemical sources and their role in atmospheric chemistry, Sci-ence, 276, 1052–1058, 1997.
Ansmann, A., Riebesell, M., Wandinger, U., Weitkamp, C., Voss, E., Lahmann, W., and Michaelis, W.: Combined Raman elastic-backscatter lidar for vertical profiling of moisture, aerosol ex-tinction, backscatter, and lidar ratio, Appl. Phys., B55, 18–28, 1992.
Ansmann, A., Wagner, F., Althausen, D., Muller, D., Herber, A., and Wandinger, U.: European pollution outbreaks during ACE 2: Lofted aerosol plumes observed with Raman lidar at the Portuguese Coast, J. Geophys. Res., 106(D18), 20 725–20 733, 2001.
Ansmann, A., Wagner, F., Muller, D., et al.: European pollution out-breaks during ACE 2: Optical particle properties inferred from multiwavelength lidar and star-Sun photometry, J. Geophys. Res., 107(D15), Art. No. 4259, doi:10.1029/2001JD001109, 2002.
Ansmann, A., Engelmann, R., Althausen, D., Wandinger, U., Hu, M., Zhang, Y., and He, Q.: High aerosol load over the Pearl River Delta, China, observed with Raman lidar and Sun photometer, Geophys. Res. Lett., 32(13), doi:10.1029/2005GL023094, 2005. Balis, D. S., Amiridis, V., Zerefos, C., et al.: Raman lidar and sunphotometric measurements of aerosol optical properties over Thessaloniki, Greece during a biomass burning episode, Atmos. Environ., 37(32), 4529–4538, 2003.
Cao, J. J., Lee, S. C., Ho, K. F., Zhang, X. Y., Zou, S. C., Fung, K., Chow, J. C., and Watson, J. G.: Characteristics of carbonaceous
aerosol in Pearl River Delta Region, China during 2001 winter period, Atmos. Environ., 37(11), 1451–1460, 2003.
Cattrall, C., Reagan, J., Thome, K., and Dubovik, O.: Variability of aerosol and spectral lidar and backscatter and extinction ratios of key aerosol types derived from selected Aerosol Robotic Net-work locations, J. Geophys. Res., 110(D10), Art. No. D10SA11, doi:10.1029/2004JD005124, 2005.
Chang, C. P. and Krishnamurti, T. N.: Monsoon Meteorology. Ox-ford Monograph on Geology and Geophysics, No. 7, OxOx-ford Univ. Press, New York, 1987.
Charlson, R. J., Schwartz, S. E., Hales, J. M., Cess, R. D., Coakley, J. A., Hansen, J. E., and Hofmann, D. J.: Aerosols and global warming response, Science, 256(5057), 598–599, 1992. Chazette, P.: The monsoon aerosol extinction properties at Goa
dur-ing INDOEX as measured with lidar, J. Geophys. Res., 108(D6), doi:10.1029/2002JD002074, 2003.
Chu, D. A., Kaufman, Y. J., Ichoku, C., Remer, L. A., Tanre, D., and Holben, B. N.: Validation of MODIS aerosol op-tical depth retrieval over land, Geophys. Res. Lett., 29(12), doi:10.1029/2001GL013205, 2002.
Collis, R. T. H. and Russell, P. B.: Lidar measurement of particles and gases by elastic backscattering and differential absorption in Laser Monitoring of the Atmosphere, edited by: Hinkley, E. D., pp. 71–152, Springler-Verlag, New York, 1976.
De Tomasi, F., Blanco, A., and Perrone, M. R.: Raman lidar moni-toring of extinction and backscattering of African dust layers and dust characterization, Appl. Opt., 42(9), 1699–1709, 2003. De Tomasi, F. and Perrone, M. R.: lidar measurements of
tropo-spheric water vapor and aerosol profiles over southeastern Italy, J. Geophys. Res., 108(D9), doi:10.1029/2002JD002781, 2003. Di Girolamo, P., Ambrico, P. F., Amodeo, A., Boselli, A.,
Pap-palardo, G., and Spinelli, N.: Aerosol observations by lidar in the nocturnal boundary layer, Appl. Opt., 38(21), 4585–4595, 1999.
Dubovik, O., Holben, B. N., Eck, T. F., Smirnov, A., Kaufman, Y. J., King, M. D., Tanre, D., and Slutsker, I.: Variability of ab-sorption and optical properties of key aerosol types observed in worldwide locations, J. Atmos. Sci., 59, 590–608, 2002. Dulac, F. and Chazette, P.: Airborne study of a multi-layer aerosol
structure in the eastern Mediterranean observed with the airborne polarized lidar ALEX during a STAAARTE campaign (7 June 1997), Atmos. Chem. Phys., 3, 1817–1831, 2003,
http://www.atmos-chem-phys.net/3/1817/2003/.
Fernald, F. G.: Analysis of atmospheric lidar observations: Some comments, Appl. Opt., 23(5), 652–653, 1984.
Ferrare, R. A., Melfi, S. H., Whiteman, D. N., Evans, K. D., and Leifer, R.: Raman lidar measurements of aerosol extinction and backscattering: 1. Methods and comparisons, J. Geophys. Res., 103(D16), 19 663–19 672, 1998.
Ferrare, R. A., Turner, D. D., Brasseur, L. H., et al.: Raman lidar measurements of the aerosol extinction-to-backscatter ratio over the Southern Great Plains, J. Geophys. Res., 106(D17), 20 333– 20 347, 2001.
Franke, K., Ansmann, A., Muller, D., Althausen, D., Wagner, F., and Scheele, R.: One-year observations of particle lidar ratio over the tropical Indian Ocean with Raman lidar, Geophys. Res. Lett., 28, 4559–4562, 2001.
Franke, K., Ansmann, A., Muller, D., et al.: Optical properties of the Indo-Asian haze layer over the tropical Indian Ocean, J.
Geo-phys. Res., 108(D2), Art. No. 4059, doi:10.1029/2002JD002473, 2003.
Grund, C. J. and Eloranta, E. W.: The University of Wisconsin High Spectral Resolution lidar, Opt. Eng., 30, 6–12, 1991.
Intergovernmental Panel on Climate Change (IPCC): Climate Change 2001: The Science of Climate Change, Technical Sum-mary of theWorking Group I Report, Cambridge Univ. Press, New York, 2001.
Kaufman, Y. J., Tanre, D., Remer, L. A., Vermote, E., Chu, A., and Holben, B. N.: Operational remote sensing of tropospheric aerosol over land from EOS Moderate Resolution Imaging Spec-troradiometer, J. Geophys. Res., 102, 17 051–17 067, 1997. Kaufman, Y. J. and Tanre, D.: Algorithm for remote sensing of
tropospheric aerosol from MODIS, Algorithm Theoretical Basis Documents (ATBD-MOD-02), 85 pp., 1998.
Klett, J. D.: Lidar inversion with variable backscatter/extinction ra-tios, Appl. Opt., 24(11), 1638–1643, 1985.
Kok, G. L., Lind, J. A., and Fang, M.: An airborne study of air quality around the Hong Kong territory, J. Geophys. Res., 102, 19 043–19 057, 1997.
Kovalev, V. A.: Sensitivity of the lidar solution to errors of the aerosol backscatter-to-extinction ratio: Influence of a monotonic change in the aerosol extinction coefficient, Appl. Opt., 34(18), 3457–3462, 1995.
Li, C. C.: Remote sensing of aerosol optical depth with MODIS and its application in the regional environmental air pollution studies, PhD thesis, Peking Univ., Beijing, China, 2002.
Li, C. C., Mao, J. T., Lau, K. H., Chen, J., Yuan, Z., Liu, X., Zhu, A., and Liu, G.: Study on the characteristics of distribution and seasonal variation of aerosol optical depth in eastern China with MODIS products, Chinese Sci. Bull., 48(22), 2488–2495, 2003. Lohmann, U. and Feichter, J.: Impact of sulphate aerosols on albedo and lifetime of clouds: A sensitivity study with the ECHAM4 GCM, J. Geophys. Res., 102, 13 685–13 700, 1997.
Louie, P. K. K.: Seasonal characteristics and regional transport of PM2.5 in Hong Kong, Atmos. Environ., 39, 1695–1710, 2005. Maletto, A., McKendry, I. G., and Strawbridge, K. B.: Profiles
of particulate matter size distributions using a balloonborne lightweight aerosol spectrometer in the planetary boundary layer, Atmos. Environ., 37, 661–670, 2003.
Mattis, I., Ansmann, A., Muller, D., et al.: Dual-wavelength Raman lidar observations of the extinction-to-backscatter ratio of Saharan dust, Geophys. Res. Lett., 29(9), doi:10.1029/2002GL014721, 2002.
Mattis, I., Ansmann, A., Muller, D., et al.: Multiyear aerosol ob-servations with dual-wavelength Raman lidar in the framework of EARLINET, J. Geophys. Res., 109(D13), Art. No. D13203, doi:10.1029/2004JD004600, 2004.
Muller, D., Franke, K., Wagner, F., et al.: Vertical profiling of optical and physical particle properties over the tropical Indian Ocean with six-wavelength lidar 1. Seasonal cycle, J. Geophys. Res., 106(D22), 28 567–28 575, 2001a.
Muller, D., Franke, K., Wagner, F., et al.: Vertical profiling of optical and physical particle properties over the tropical Indian Ocean with six-wavelength lidar 2. Case studies, J. Geophys. Res., 106(D22), 28 577–28 595, 2001b.
Muller, D., Ansmann, A., Wagner, F., et al.: European pollu-tion outbreaks during ACE 2: Microphysical particle properties and single-scattering albedo inferred from multiwavelength
li-dar observations, J. Geophys. Res., 107(D15), Art. No. 4248, doi:10.1029/2001JD001110, 2002.
Muller, D., Franke, K., Ansmann, A., et al.: Indo-Asian pol-lution during INDOEX: Microphysical particle properties and single-scattering albedo inferred from multiwavelength lidar observations, J. Geophys. Res., 108(D19), Art. No. 4600, doi:10.1029/2003JD003538, 2003.
Muller, D., Mattis, I., Ansmann, A., et al.: Closure study on optical and microphysical properties of a mixed urban and Arctic haze air mass observed with Raman lidar and Sun photometer, J. Geophys. Res., 109(D13), Art. No. D13206, doi:10.1029/2003JD004200, 2004.
Muller, D., Mattis, I., Wandinger, U., et al.: Raman lidar obser-vations of aged Siberian and Canadian forest fire smoke in the free troposphere over Germany in 2003: Microphysical particle characterization, J. Geophys. Res., 110(D17), Art. No. D17201, doi:10.1029/2004JD005756, 2005.
Murakami, T.: Winter monsoonal surges over East and Southeast Asia, J. Meteor. Soc. Japan, 57, 133–158, 1979.
Murayama, T., Masonis, S. J., Redemann, J., et al.: An intercom-parison of lidar-derived aerosol optical properties with airborne measurements near Tokyo during ACE-Asia, J. Geophys. Res., 108(D23), Art. No. 800, doi:10.1029/2002JD003259, 2003. NASA: U.S. Standard Atmosphere Supplements, U.S. Govt. Print.
Off., Washington, D.C., 1976.
Pappalardo, G., Amodeo, A., Mona, L., et al.: Raman lidar observa-tions of aerosol emitted during the 2002 Etna eruption, Geophys. Res. Lett., 31(5), Art. No. L05120, doi:10.1029/2003GL019073, 2004.
Phadnis, M. J. and Carmichael, G. R.: Numerical investigation of the influence of mineral dust on the tropospheric chemistry of East Asia, J. Atmos. Chem., 36, 285–323, 2000.
Razenkov, I. A., Eloranta, E. W., Hedrick, J. P., and Garcia J. P.: Improvement of the arctic high spectral resolution lidar, Proc. ILRC22, 91–94, 2004.
Remer, L. A., Kaufman, Y. J., Tanre, D., Mattoo, S., Chu, D. A., Martins, J. V., Li, R., Ichoku, C., Levy, R. C., and Kleidman, R. G.: The MODIS Aerosol Algorithm, Products, and Validation, J. Atmos. Sci., 62(4), 947–973, 2005.
Sakai, T., Nagai, T., Nakazato, M., et al.: Ice clouds and Asian dust studied with lidar measurements of particle extinction-to-backscatter ratio, particle depolarization, and water-vapor mix-ing ratio over Tsukuba, Appl. Opt., 42(36), 7103–7116, 2003. Salemink, H. W. M., Schotanus, P., and Bergwerff, J. B.:
Quantita-tive lidar at 532nm for vertical extinction profiles and the effect of relative humidity, Appl. Phys., 34, 187–189, 1984.
Sasano, Y., Browell, E. V., and Ismail, S.: Error caused by using a constant extinction/backscattering ratio in the lidar solution., Appl. Opt., 24, 3929–3932, 1985.
Sassen, K. and Cho, B. S.: Subvisual-thin cirrus lidar dataset for satellite verification and climatological research, J. Appl. Mete-orol., 31, 1275–1285, 1992.
Smirnov, A., Holben, B. N., Kaufman, Y. J., Dubovik, O., Eck, T. F., Slutsker, I., Pietras, C., and Halthore, R. N.: Optical properties of atmospheric aerosol in maritime environments, J. Atmos. Sci., 59, 501–523, 2002.
Twomey, S.: Influence of pollution on the short-wave albedo of clouds, J. Atmos. Sci., 34, 1149–1152, 1977.
Measure-ment of the aerosol total scatter-backscatter ratio, Appl. Opt., 11, 2886–2889, 1972.
Wandinger, U., Muller, D., Boeckmann, C., Althausen, D., Matthias, V., Boesenberg, J., Weib, B., Fiebig, M., Wendisch, M., Stohl, A., and Ansmann, A.: Optical and physical charac-terization of biomass burning and industrial pollution aerosols from multiwavelength lidar and aircraft measurements, J. Geo-phys. Res., 107, doi:10.1029/2000JD000202, 2002.
Welton, E. J., Voss, K. J., Gordon, H. R., Maring, H., Smirnov, A., Holben, B. N., Schmid, B., Livingston, J. M., Russell, P. B., Durkee, P. A., Formenti, P., and Andreae, M. O.: Ground-based lidar measurements of aerosols during ACE-2: lidar description, results, and comparisons with other ground-based and airborne measurements, Tellus 52B, 636–651, 2000.
Welton, E. J., Voss, K. J., Quinn, P. K., Flatau, P., Markowicz, K., Campbell, J., Spinhirne, J. D., Gordon, H. R., and Johnson, J.: Measurements of aerosol vertical profiles and optical properties during INDOEX 1999 using micropulse lidars, J. Geophys. Res., 107(D1), 8019, doi:10.1029/2000JD000038, 2002.
Zuev, V. E.: Laser Beams in the Atmosphere, Plenum Press, New York, p. 504, 1982.