HAL Id: hal-00317112
https://hal.archives-ouvertes.fr/hal-00317112
Submitted on 1 Jan 2002
HAL is a multi-disciplinary open access
archive for the deposit and dissemination of
sci-entific research documents, whether they are
pub-lished or not. The documents may come from
teaching and research institutions in France or
abroad, or from public or private research centers.
L’archive ouverte pluridisciplinaire HAL, est
destinée au dépôt et à la diffusion de documents
scientifiques de niveau recherche, publiés ou non,
émanant des établissements d’enseignement et de
recherche français ou étrangers, des laboratoires
publics ou privés.
observed with the Athens Digisonde
I. Tsagouri, A. Belehaki
To cite this version:
I. Tsagouri, A. Belehaki. On the nature of nighttime ionisation enhancements observed with the
Athens Digisonde. Annales Geophysicae, European Geosciences Union, 2002, 20 (8), pp.1225-1238.
�hal-00317112�
Annales
Geophysicae
On the nature of nighttime ionisation enhancements observed with
the Athens Digisonde
I. Tsagouri1and A. Belehaki1
1Institute for Space Applications and Remote Sensing, National Observatory of Athens, Metaxa and Vas. Pavlou, P. Penteli
15236, Greece
Received: 2 July 2001 – Revised: 19 March 2002 – Accepted: 22 March 2002
Abstract. True height electron density profiles observed with the Athens Digisonde were analyzed together with geo-magnetic data indices for six geo-magnetic storms in September and October 2000 in an effort to define the ionospheric struc-ture during events of nighttime ionisation enhancements and to discuss the physical processes that may cause them. An upwelling of the F2-layer, limited to the dark hemisphere, was evident in all storm events as the ionospheric response to enhanced geomagnetic activity, but nighttime positive ef-fects and nighttime height enhancements are attributed to two distinct mechanisms, according to our findings. Height en-hancements are wave-like disturbances and the time delay of their occurrence at middle latitudes depends on the in-crease rate of the AE index, and consequently, on the rate that the solar wind input energy dissipates in the auroral iono-sphere. Thus, they most probably originated in the auroral oval region and propagated toward the equator-like TID dis-turbances, with a periodicity that depends on the ionisation density. On the other hand, foF2 increases do not share the same wavy appearance, which could mean that they are not connected to TIDs and are not of auroral oval origin. The increased nighttime density can only be speculated to be due to increased downward fluxes from the plasmasphere.
Key words. Ionosphere (ionosphere-magnetosphere
inter-actions; ionospheric disturbances; mid-latitude ionosphere)
1 Introduction
The ionosphere-thermosphere system response to geomag-netic storms is initiated at high latitudes, where energetic particle precipitation, convection electric fields and associ-ated Joule heating are taking place. The Pr¨olss (1993) phe-nomenological model represents one of the most popular de-scriptions of the ionospheric storm-induced effects, which was further extended by Fuller-Rowell et al. (1994; 1996), al-though in this model only daytime positive storm effects are
Correspondence to: I. Tsagouri ([email protected])
predicted. According to this description negative ionospheric storm effects are attributed to neutral composition changes, while daytime positive effects are attributed to travelling at-mospheric disturbances (TADs). A TAD is a therat-mospheric phenomenon, which accompanies atmospheric gravity waves (AGWs). During a substorm associated energy injection at auroral latitudes, a whole spectrum of gravity waves is gen-erated. At some distance from the source region these waves will be superimposed to form an impulse-like perturbation, the TAD, which moves with high velocity from auroral to equatorial latitudes (Bauske and Pr¨olss, 1997). The AGWs and the TADs have been studied in great detail, usually by observing the associated so-called travelling ionospheric dis-turbances (TIDs), which describe the effect of the TADs on the ionosphere (Balthazor and Moffett, 1999). A particu-larly useful ionospheric tracer of TIDs was found to be the peak height of the F2-layer, hmF2. In Pr¨olss’s scenario, pos-itive storm effects are caused by an uplifting of the F2-layer at any mid-latitude station located in the sunlit hemisphere. The storm-induced effects scenario in the night-side hemi-sphere is different. Here, the lack of ionisation production will not allow for the formation of large positive effects, al-though TAD-associated changes in the layer height will be observable at any local time.
Within the last few years, it was well confirmed that posi-tive storm effects are also observed in the night-side hemi-sphere (Oliver and Hagan, 1991; Burnside et al., 1991; Szuszczewicz et al., 1998; Tsagouri et al., 2000; Belehaki and Tsagouri, 2002). They are also predicted by numerical simulations (Mansilla and Manzano, 1998) and many respon-sible mechanisms have been occasionally proposed. For ex-ample, Oliver and Hagan (1991), in a study of storm-induced gravity waves, invoked the assumption of downward plas-maspheric fluxes as a source of enhanced nighttime densi-ties. This mechanism is an open issue even in normal con-ditions (Szuszczewicz et al., 1998). It is not ascribed to any storm mechanism, although there is observational and theo-retical evidence for the existence of storm time gravity-wave-induced perturbations in atmospheric densities (Trinks and
Mayr, 1976; Mayr and Volland, 1976; Potter et al., 1976). These perturbations can cause ionospheric perturbations in combination with the ionisation existence in the night side. Burnside et al. (1991) attributed unusually high nighttime densities to converging plasma flow in the F region due to a surprisingly large vertical shear in the meridional wind ve-locity, rather than to a decrease in the molecular gas density and the subsequent reduction in the ion recombination rate (that may occur in the case of thermospheric downwelling), while Mansilla and Manzano (1998) considered an uplifting of plasma to higher altitudes as the main cause of nighttime positive effects.
According to Fuller-Rowell et al. (1994), initial positive phases are wind driven effects observed in the daytime dur-ing the main phase of the storm, consistent with the consen-sus picture. They also maintain that if a positive phase is driven by winds before dusk, it will rotate into the night-side and nighttime positive effects of this type have been observed (Szuszczewicz et al., 1998; Tsagouri et al., 2000). However, the understanding of positive phase observations is not always so simple, such as in cases of nighttime initi-ated positive effects. Thermospheric downdwelling with an associated decrease in mean-molecular-mass and an atten-dant reduction in dissociate recombination is a mechanism invoked by Fuller-Rowell et al. (1994) to be present in the recovery phase. This could also be the case in the expansion phase. Downdwelling could be a candidate mechanism for positive phase storms commencing at night (Szuszczewicz et al., 1998). In a recent work, Belehaki and Tsagouri (2002) demonstrated that the existence of a new source of ionisation is necessary to explain nighttime positive effects and, there-fore, the increased nighttime density can only be speculated to be due to increased downward fluxes from the plasmas-phere (Rishbeth, 1987; Richards, 1994). In fact, the plas-maspheric flux term can also modify the value of hmF2 and contribute to the height increase (Szuszczewicz et al., 1998). Finally, Belehaki and Tsagouri (2002) attributed the lati-tudinal effect in observation of nighttime ionisation enhance-ments at middle latitudes to the solar wind−magnetospheric coupling conditions, which may cause a restriction in the neutral composition disturbance zone to higher latitudes. In such cases, the observation of the effects of plasmaspheric fluxes at middle latitudes is more probable.
From the above short review in the recent literature, it is obvious that the question of the triggering mechanism of nighttime ionisation enhancements observed systematically from middle latitude stations is not answered yet. In this contribution, we will make an effort to approach this problem by analyzing data from ionospheric soundings taken with the Athens Digisonde Portable Sounder (Reinisch, 1996). The systematic study of the calculated electron density profiles during several storm intervals aims to determine the iono-spheric structure during events of nighttime ionisation en-hancements and to investigate the possible mechanisms that produce such type of disturbances.
2 Events overall perspective
This work is based on the study of three storm periods that occurred in September and October 2000. Six distinct mag-netic storms were determined. These events were studied in detail in the light of the global solar wind-magnetosphere-ionosphere interaction in a previous work (Belehaki and Tsagouri, 2002), where the conditions under which night-time positive effects occur in the middle latitude ionosphere were determined and a possible mechanism that drives these phenomena was also discussed. Regarding the ionospheric mechanism responsible for the height variations, it was demonstrated that during either positive or negative night-time effects, an upwelling of the F2-layer occurred in as-sociation with disturbed periods. To further investigate the impact of the geomagnetic activity on the ionospheric struc-ture, and thus, the origin of positive storm phases, the iono-spheric response over Athens in height structure and in elec-tron density is studied in more detailed during selected mag-netic storms, using true height profile data from the Athens (103.5◦E, 36.23◦N geomagnetic) digisonde.
The Athens Digisonde Portable Sounder autoscales the ionograms and provides radio channel information in real time. Data and ionograms are available in real time on the World Wide Web via our home page (http://www.iono.noa.gr). Polarisation switching and multi-beam forming are the important prerequisites for success-ful autoscaling under disturbed and undisturbed conditions. Autoscaling algorithms find the leading edge of the O echo traces, i.e. h0(f ), and determine the standard ionosphere characteristics. ARTIST software provides reliable vertical electron density profiles, using the Chebyshev polynomial fitting technique (Reinisch and Huang, 1983; Huang and Reinisch, 1996). Regarding the topside vertical electron den-sity profile, the new technique of Huang and Reinisch (2001) is applied. This method uses information from ground-based ionosonde measurements. The profile above the peak is ap-proximated by an α−Champan function, with a scale height that is derived from the profile shape at the F2 peak.
To have an indicator of the auroral oval activity, the values of the four AE magnetospheric indices with 1 min resolu-tion are used, provided by WDC-C2 Kyoto (http://swdcdb. kugi.kyoto-u.ac.jp/wdc/). It has to be noted that these are the preliminary values of the AE indices, which explain the existence of some spikes. However, these artificially large values are discernible and thus, they do not affect the phys-ical information extracted by the indices. The AE index and also the joint AU and AL indices were introduced by Davis and Sugiura (1966) as a measure of the global auro-ral electrojet activity. The AU and AL indices are moni-toring the eastward and westward electrojets, respectively, while the AE index, which is equal to the difference AU –
AL, corresponds to the separation between AU and AL en-velopes. It depends solely upon the maximum eastward and westward electrojet currents and is independent of zonal cur-rents, if any, existing in the high-latitude ionosphere. The
mea-Fig. 1. The overview plot that describes the ionospheric conditions over Athens in response to geomag-netically disturbed conditions recorded from 29 September to 8 October 2000 are presented. The development of the
Dst index is presented in the first panel, in hourly resolution. In the following two panels, the 1-min values of the AU ,
ALand AE indices are presented. The vertical dotted lines indicate the local midnight. The variations in the peak height of the F2-layer are presented in the fourth panel of Fig. 1. In terms of the d(hmF2)% deviations from the quiet values, the peak height of the F2-layer, together with the lower F2-layer boundary (hmF2–B0), are given in the following panel, and finally, the rela-tive d(foF2)% deviations with respect to quiet values for this time interval fol-lowed by the d(ITEC)% variations are plotted in the two bottom panels. The solid lines represent the observed pa-rameters, while the dotted lines repre-sent their diurnal quiet time pattern.
sure of the equivalent zonal current” (Mayaud, 1980). Ac-cording to Akasofu (1981), the AE index is a very good in-dicator of the physical processes that occurred in the auro-ral ionosphere following an episode of enhanced solar wind energy input. The magnetosphere dissipates the input so-lar wind power partly to the auroral ionosphere as kinetic power of the auroral particles (UA =AE ·1015erg/s) is lost in the ionosphere due to collisions and since Joule heating (Uj = 2 · 1015AEerg/s) is associated with electric current flow in the resistive ionosphere. Hence, the use of auroral electrojet indices may lead to useful information regarding the amount of energy accumulated in the auroral ionosphere and consequently, transformed to kinetic and thermal energy during the course of a substorm episode in the auroral iono-sphere.
To have a measure of the ring current injection rate as the magnetospheric response to the solar wind, the hourly values of the preliminary Dst index provided by WDC-C2 Kyoto are used (http://swdcdb.kugi.kyoto-u.ac.jp/wdc/).
29 September – 8 October 2000: The overview plot that describes the ionospheric conditions over Athens in response to geomagnetically disturbed conditions recorded during this period is given in Fig. 1. The development of the Dst index is presented in the first panel, in hourly resolution. In the fol-lowing two panels, the one-minute values of the AU , AL and
AEindices are presented. The vertical dotted lines indicate the local midnight.
This period covers a time interval of 10 days and consists of two distinct geomagnetic storms. The first geomagnetic storm is gradually driven and results from a low level
so-lar wind-magnetospheric coupling (Belehaki and Tsagouri, 2002). It is characterized by moderate intensity and fully recovers on 1 October at 21:00 UT, as indicated by both AE and Dstindices. The second storm is more intense and its de-velopment consists of two distinct steps. The start of the Dst decrease (∼07:00 UT on 2 October) is followed by an activa-tion of the AE magnetospheric indices almost immediately. First, a sharp decrease in AL indicates that the triggering of this substorm results from the unloading of energy from the tail. During the progress of the event, the two mecha-nisms, driven and loading-unloading, seem to operate simul-taneously, as indicated by the more or less symmetric de-velopment of the AL and AU indices. This storm seems to recover at 02:00 UT on 4 October. Meanwhile, the Dst reached a minimum of –86 nT and the AE index reached values of 1000 nT, indicating moderate geomagnetic activ-ity and a high level auroral oval activactiv-ity. Right afterwards, the Dst index starts to decrease again with a high rate of change, marking the initial phase of the second step of this storm, which coincides with a reactivation of the magneto-spheric activity. This time the Dst index reached a minimum of −192 nT at 14:00 UT on 5 October, while the AE index exceeded 1000 nT, reaching values of 2000 nT. This storm can be classified as a Type B storm (Kamide et al., 1998) as the ring current presents a two-step development. This is initially the result of large-scale convection in the magneto-sphere, and eventually, the substorm associated injection of ionospheric oxygen ions into the inner magnetosphere.
The ionospheric observations during this period from the Athens Digisonde, which performs routine vertical sound-ings every 15 min, are presented in the last four panels of Fig. 1. Although the ionograms were automatically scaled, all the ionograms data were further edited to ensure data integrity and minimize uncertainties, especially during pe-riods of high disturbances. Three F2-region characteris-tics, the critical frequency foF2, the peak height of the F2-layer, hmF2, and the F2 thickness parameter, B0 (Reinisch and Huang, 1998), in addition to the total electron con-tent (ITEC) estimates, were used to extract these plots. All parameters were compared to their diurnal quiet time be-haviour, formed by the average of the quiet days 20 Oc-tober (−2 nT< Dst < 7 nT and Kp<1) and 21 October (0 nT<Dst<18 nT and Kp<2-), when no substorm activity was detected by the AE indices. Also, during the day be-fore, 19 October 2000, only weak isolate substorm activity was recorded by the AE index at auroral latitudes, when
−13 nT<Dst<3 nT and Kp<3. More precisely, the varia-tions in the hmF2 are presented in the fourth panel of Fig. 1 in terms of the d(hmF2)% deviations from the quiet values, and the hmF2, together with the lower F2-layer boundary (hmF2−B0), is given in the following panel. Finally, the relative d(foF2)% deviations with respect to the quiet values for this time interval, followed by the d(ITEC)% variations, are plotted in the two bottom panels. The solid lines sent the observed parameters, while the dotted lines repre-sent their diurnal quiet time pattern. In reviewing the data in Fig. 1, the following points are noted:
1. Systematic nighttime positive effects appear in d(foF2)% variations around local midnight. The pos-itive deviations in plasma frequency ranged from 5% (negligible) to 60% (156% density enhancement), with the more intense effects occurring in the more magnetospherically active periods. The maximum nighttime ionisation enhancement occurred at night between 4 and 5 October (156%). It is noticeable that immediately afterwards, a well-defined SSC occurring at 03:26 UT caused a new activation of the storm main phase. This sudden release of a large amount of energy to the magnetosphere-ionosphere system had, as a consequence, the lack of positive effects during the two following nights (5–6 and 6–7 October) (Belehaki and Tsagouri, 2002). Noticeable enhancements were also observed at night from 29 to 30 September (50% density enhancement), from 2 to 3 October (120% density enhancement), and from 7 to 8 October (40% density enhancement), during ring current and auroral injection phases.
2. The d(ITEC)% variations are well correlated, with the d(foF2)% variations showing the same development pattern during the whole sequence of the events and in-dicating net ionisation enhancements during nighttime positive effects.
3. The nighttime ionosphere structure is also an interest-ing feature of this event. Most of the nighttime in-tervals are characterized by an F2-layer uplifting, ob-served from 19:00 to 06:00 LT, while during daytime hours the ionosphere recovers to normal heights. Sig-nificant deviations of the observed hmF2 values with re-spect to the quiet values (from 20% to 40%) occurred at night between 29–30 September, 2–3, 4–5 and 5– 6 October, accompanied by nighttime positive effects. Also, noticeable deviations in hmF2 occurred at night between 30 September and 1 October, when the ionisa-tion density over Athens remained primarily at its quiet values. Nevertheless, during that night, significant au-roral activity was detected by the AE index, although
Dst remained at fairly weak levels of activity. This fact, together with the observation that the uplifting of the F2-layer is much more evident as the solar wind-magnetosphere coupling reaches higher levels, gives ev-idence that the variation of the peak height of the F2-layer is probably dependent on the energy deposited by the solar wind in the auroral ionosphere, as described by the AE index. Indeed, during the night hours, be-tween 29–30 September, a weak height increase was ob-served, probably caused by the very weak auroral activ-ity indicated by the AE index, although significant ion-isation enhancement (more than 40% density enhance-ment) was observed over Athens during that night. 4. No consistent relation between peak density and height
was found; thus, the occurrence of nighttime positive ef-fects seems to be independent of the variations in height.
12–16 October 2000: The overview plot for this event is presented in Fig. 2 in the same format as in Fig. 1. At the be-ginning of this interval, the magnetosphere-ionosphere sys-tem was in a moderately disturbed state. The start of this storm can be determined as the time of occurrence of a SSC detected at 22:28 UT on 12 October, which results in a rapid ring current development and a rapid increase in all AE in-dices as well. The initial and main storm phases lasted for about 6 h, as seen by the Dst development. The Dst reached a minimum of −63 nT. During this six-hour interval, the AE index reached extremely large values (∼1500 nT), indicat-ing very strong Joule heatindicat-ing in the auroral oval. The storm recovery phase lasted 9 h. Six hours later, a second grad-ually driven storm was detected. This storm had no initial phase. Its main phase lasted more than 24 h, due to slowly in-creasing southward Bz-IMF (Belehaki and Tsagouri, 2002). Probably, the large-scale magnetospheric convection caused the slow development of the ring current, as indicated by the slowly decreasing Dst index. Indeed, the start of this storm was marked by the asymmetric enhancement of AU and AL indices recorded between 17:00 UT and 21:00 UT on 13 October. The AU was severely disturbed and the AL index decreased very slowly, indicating the energisation of the directly driven mechanism that directly dissipates the so-lar wind input energy in the auroral ionosphere. The last four panels present again the relative deviations of hmF2 from the quiet day values, hmF2, hmF2-B0, d(foF2)% and d(ITEC)%. The diurnal quiet time behaviour at Athens, overplotted in the sixth panel, is again formed by the average of the quiet days, 20 and 21 October. The main observations may be summarized as follows:
1. Negative effects are observed at night from 12 to 13 Oc-tober. This is the ionospheric response to the first storm event that was caused by an SSC. This ionisation deple-tion event was accompanied by a very large increase in height (almost 60%), initiated one hour after the sharp and large increase in the AE index (00:40 LT), when Athens was still on the night side.
2. During the second night of this time interval (13 to 14 October) that corresponds to the initial and main phases of the second storm, positive nighttime effects are evident over Athens. The foF2 deviations with respect to the quiet values reached 20%. Noticeable height enhancements were observed during that night. The time variation of d(hmF2) has the same behaviour as the AE index, shifted slightly in time: it is obvious that the very large increase in height at 03:00 LT is re-lated to the AE increase detected at 00:00 LT.
3. The same pattern of ionisation enhancement with stronger intensity (this time a maximum of 70% was recorded) was observed during the next night (14 to 15 October) and also during the last night of this storm event interval (15 to 16 October), although its intensity is obviously attenuated. Although the magnetic storm
was in its recovery phase during the last two nights, sig-nificant auroral electrojet injections are still recorded by all AE indices. Thus, it is not surprising that despite the fact that the geomagnetic storm is in its recovery phase, the auroral activations produced significant height in-creases at night, which exceeded 20%.
4. The d(ITEC)% variations are well correlated to the d(foF2)% variations in both negative and positive phases. Once again, nighttime positive effects are as-sociated with total electron content enhancements. 5. Again, no consistent relation between the peak density
and height was found.
16–21 September 2000: This storm time interval is pre-sented in Fig. 3, which follows the format of Figs. 1 and 2. This event was the result of an interplanetary coronal mass ejection (ICME) detected in the analysis of ACE solar wind data by Belehaki and Tsagouri (2002). The Dst index was already depressed and the AE indices were activated prior to the arrival of a fast forward shock approximately at 19:00 UT on 17 September. Immediately after the shock arrival, the
Dst index decreased very rapidly, reaching its minimum value of −172 nT at 23:00 UT on 17 September. The AE index reached values of 2000 nT, although there are some spikes exceeding the 2000 nT, but these might be attributed to the fact that these are preliminary values of the AE in-dex. The very sharp decrease in the AL index indicates a very sudden energisation of the westward auroral electrojet fed by the cross tail current disruption. While the system recovered, at 14:44 UT on 18 September a new SSC caused a deceleration in Dst recovery and an intensification of the auroral electrojets, apparent in AE. Finally, at 06:00 UT on 19 September, new storm activity is produced. Dst reached the minimum value of −80 nT on 19 September, which re-covered slowly until the end of the next day. During this last event, rather intense substorm activity is recorded, with the
AEindex having values up to 1000 nT. The behaviour of the ionosphere at middle latitudes is presented in the last pan-els of the Fig. 3. The diurnal quiet time behaviour of each parameter is now formed by the corresponding observations during the quiet day 11 September (9 nT< Dst <24 nT and
Kp<1), when no substorm activity was detected by the AE indices. Also, during the day before, 10 September 2000, no substorm activity was recorded by the AE index at auroral latitudes, when 0 nT<Dst<20 nT and Kp<1. In reviewing the data in Fig. 3, the following points are noted:
1. Nighttime ionospheric behaviour was characterized by ionisation depletion during the two successive storms discussed above. The d(foF2)% variations are well cor-related with d(ITEC)% variations.
2. Noticeable uplifting of the F2-layer is observed dur-ing the first two nights of this interval (16 to 17 and 17 to 18 September), with the maximum increase in height observed the second night of the major storm oc-currence and when the Dst and AE indices recorded
Fig. 2. Same as Fig. 1 for the interval 12–16 October 2000.
their maximum for this time interval. No significant height increase was observed during the second storm event. Indeed, the auroral oval activity expressed by the
AEindex was in low levels during this event, although some peaks in hmF2 some hours after local midnight on 20 and 21 September coincide with enhancements of the auroral oval activity.
Summarizing the above observations we can note the fol-lowing first results: an upwelling of the F2-layer, limited to the dark hemisphere, in response to enhanced geomagnetic activity, is evident in all of the storm events under study. These increases are common features of the ionospheric be-haviour during events of either ionisation depletions or en-hancements at night. They are apparent even in storm re-covery phases, always limited to the dark side hemisphere,
and the more intense effects occur during the more magneto-spherically active periods. Hence, one could say that their oc-currence and their characteristics (strength, LT initiation and duration) depend strongly on the auroral activity and the AE index development, in particular. The following sections in-vestigate the characteristics of the observed height enhance-ments to explore the nature of these mechanisms.
3 Height enhancements characteristics
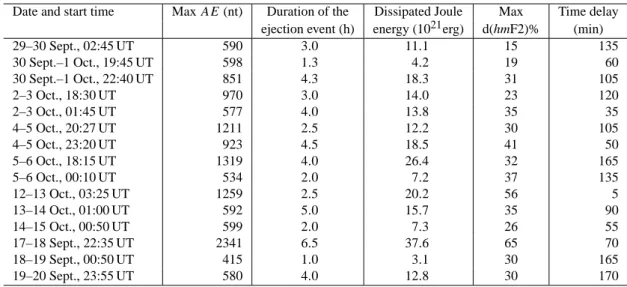
The 3-D plots of the true height variation for various plasma frequencies during nighttime hours are presented below in an effort to study the nighttime ionospheric height structure during disturbed periods. In Fig. 4, the density structure dur-ing the night between 20 and 21 October 2000 is presented.
Fig. 3. Same as Fig. 1 for the interval 16–21 September 2000.
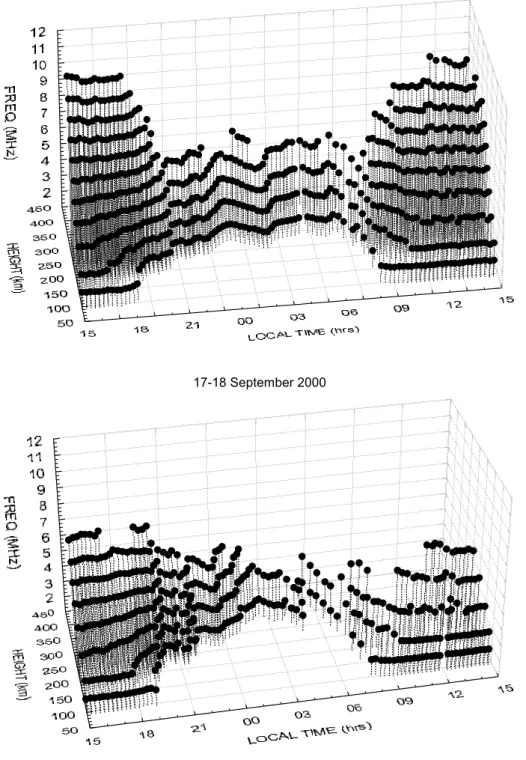
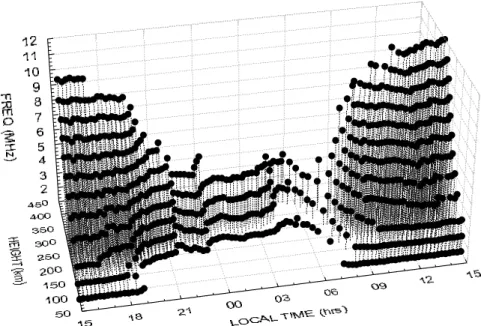
This is a very quiet interval and is taken as a reference. In Figs. 5 and 6, the density structure for two nights (2–3 Oc-tober and 13–14 OcOc-tober, respectively), during which ionisa-tion enhancements are observed over Athens, are presented as characteristic examples. Finally, two nighttime intervals (17–18 September and 12–13 October) were selected as rep-resentative cases for ionisation depletion events and are pre-sented in Figs. 7 and 8.
During the night from 20 to 21 October 2000 (Fig. 4), ge-omagnetically quiet conditions lead to a rather normal iono-spheric height-density structure. No fluctuations are ob-served, except possibly for an abrupt rise around 23:00 LT and another one around sunrise, which are expected features of the nighttime ionospheric structure before sunrise (Rish-beth and Garriott, 1969; Oliver and Hagan, 1991).
Then we investigated the cases of nighttime positive
ef-fects. Two characteristic examples are presented in Figs. 5 and 6. Intense fluctuations are evident in almost all of the nights under study. For all 5 cases of this group, some com-mon features can be reported:
1. Height fluctuations are always initiated around local sunset and seem to terminate around local sunrise. Dur-ing daytime hours, the fluctuations are totally absent. 2. The period of the fluctuations does not remain constant
during an event, and is not the same at all plasma fre-quencies, making it difficult to specify a typical period. In general, smaller periodicities (of 1 or 2 h) are ob-served before local midnight, while after local midnight the periodicity is increased (to about 4 h) before the dis-turbance is totally attenuated. This observation may be connected to the fact that the F2-layer is denser, before
1232 I. Tsagouri and A. Belehaki: On the nature of nighttime ionisation enhancements 20-21 October 2000
Fig. 4. The 3-D plot of the height vari-ation for plasma frequencies 2–12 MHz versus the local time for the night hours between 20 and 21 October 2000. This is an undisturbed night taken as the quiet reference.
2-3 October 2000
Fig. 5. The 3-D plot of the height vari-ation for plasma frequencies 2–12 MHz versus the local time for the night hours between 2 and 3 October 2000. Ioni-sation enhancement was observed over Athens.
local midnight. A tendency for increasingly smaller pe-riodicities at increasingly higher frequencies has also been found.
3. The amplitude of the height fluctuation ranges from 50 to 100 km, depending on altitude and/or frequency. Nighttime periods characterized by negative storm effects are discussed next. From the four cases reported in this in-vestigation, only two indicative examples are presented in Figs. 7 and 8, for the nighttime intervals of 17–18 September and 12–13 October, respectively. Summarizing our results, we can report:
1. Wave-like perturbations in height can be clearly
recog-nized during all nights of ionospheric depletion. Once again, the disturbance started around local sunset and declines around local sunrise. During daytime hours, no propagating waves were observed.
2. The periodicity behaviour is similar to the pattern de-rived before, although the values are somewhat larger, typically 3 h before local midnight, and 4.5–5 afterward. This difference may be attributed to the fact that the F2-layer is less dense during ionisation depletion events. In summary, the observed height variations have wave-like characteristics. Their periodicity ranges from 1 h to 5.5 h, tending toward smaller periodicities during ionisation
en-I. Tsagouri and A. Belehaki: On the nature of nighttime ionisation enhancements 1233 13 - 14 October 2000
Fig. 6. The 3-D plot of the height vari-ation for plasma frequencies 2–12 MHz versus the local time for the night hours between 13 and 14 October 2000. Ion-isation enhancement was observed over Athens.
17-18 September 2000
Fig. 7. The 3-D plot of the height vari-ation for plasma frequencies 2–12 MHz versus the local time for the night hours between 17 and 18 September 2000. Ionisation depletion was observed over Athens.
hancements and before local midnight, when the ionisation density is greater. This dependence on ionisation density may be a possible explanation for the wave-like enhance-ments observation to be more evident during nighttime posi-tive effects. Moreover, a dependency of the periodicity on the frequency and/or altitude may be explained in terms of the at-mospheric density decrease with altitude (Richmond and Lu, 2000). During daytime hours, the fluctuations have totally disappeared, but then other mechanisms, such as ion drag, dominate (Hajkowicz, 1990; Balthazor and Moffett, 1999).
4 Auroral activity and height enhancements
The observations described above imply a temporal correla-tion between the appearance of height enhancements and AE index injections. Moreover, the characteristics of the night-time ionospheric structure (i.e. wavy disturbances, periodic-ity and amplitude of observed variations) might be related to the quantitative characteristics of the AE index injections. To further investigate this dependence, we compared the AL,
AUand AE indices evolution with the d(hmF2)% deviations individually for each event of nighttime uplifting of the
F2-1234 I. Tsagouri and A. Belehaki: On the nature of nighttime ionisation enhancements 12-13 October 2000
Fig. 8. The 3-D plot of the height vari-ation for plasma frequencies 2–12 MHz versus the local time for the night hours between 12 and 13 October 2000. Ion-isation enhancement was observed over Athens.
layer. Since height enhancements were observed between 18:00 and 06:00 in LT, we concentrated on this range of hours, using AE indices and hmF2 data with 15-min reso-lution. The variations of the AE indices, together with the d(hmF2)% deviations for the night intervals presented in the previous section, are shown in Fig. 9(a–d). The following as-sumptions were made in order to study the effect of auroral energy injection on ionospheric height variations: first, we consider as significant height deviations those exceeding the 10% level with respect to normal height values. Second, we regard as a reasonable threshold for the auroral activity af-fecting the ionosphere at geomagnetic latitudes over Athens (36.23◦N) the value of 300 nT for AE. Auroral activations that cause AE disturbances with less than 300 nT produce height variations of less than 10%.
The AE indices, together with the d(hmF2)% deviations for the night of 2–3 October, are presented in Fig. 9a. The energy injection, indicated by the AE index’s rapid increase starting at 18:30 LT, seems to result in the first height distur-bance (of about 20%) 2 h later. A very smooth deviation in both auroral electrojet indices, implying direct deposition of the solar wind energy to the auroral ionosphere that started at 01:45 LT, led to a gradual increase in the AE index. The height enhancement followed with a time delay of 35 min.
The night of 12–13 October (Fig. 9b) is the most inter-esting one, since it is the most representative of our study corresponding to ideal conditions. The AE index was really low from 19:00 to about 03:00 LT and no significant hmF2 deviations were observed at Athens. At 03:25 LT, a single rapid increase in the AE index was recorded (the AE index reached its maximum value 1300 nT in 45 min), indicating that the unloading mechanism in energy dissipation is the dominant one and this time, the associated height rise started almost simultaneously (with a 5-min delay). The maximum
hmF2 deviation was about 55% for this night. During next
night (Fig. 9c), a gradual increase in the AE index led to a prolonged increase in hmF2 with a 90-min delay. The max-imum deviation in hmF2 was 35%. Finally, the AE indices, together with the d(hmF2)% deviations for the night of 17– 18 September, are plotted in Fig. 9d. This night is definitely the most complicated case encountered in this study. Here, prolonged high level activity, described by intense variations in the AE index (evident also in both auroral oval activity indices), resulted in a consistent increase in hmF2. At the end of this event, the deviation in hmF2 reached 60% with respect to normal values.
The above observations and the corresponding results from the analysis of all nighttime intervals analyzed in this study are summarized in Table 1. The dates of the aurora associated F2-layer uplifting and the start time of each en-ergy ejection event is noted in the first column of Table 1, while the next three columns refer to auroral energy injec-tion characteristics: the maximum value of the AE index for each event is given in the second column, the duration of each event in hours is noted in the third column and the estimated amount of the dissipated Joule heating in the auroral oval is shown in the fourth column. The last two columns give in-formation about the related height enhancement events: the maximum (%) deviation of the hmF2 with respect to the nor-mal values is given in the fifth column, while the last column shows the observed time delay in between the energy injec-tion events at auroral latitudes, and the height enhancements observed at middle latitude ionosphere.
In conclusion, we denote that energy deposition at auroral latitudes triggers a F2-layer height enhancement that is ob-servable at middle latitudes at F2-layer altitudes with a time delay. No consistent relation was detected between height enhancement characteristics (magnitude or time delay) and the individual activity of each auroral electrojet separately (westward or eastward), but their combined effect seems to
I. Tsagouri and A. Belehaki: On the nature of nighttime ionisation enhancements 1235
Fig. 9. The development of AL, AU and AE indices is compared with the d(hmF2)% deviations individually for four events of nighttime uplifting of the F2-layer. The night hours between 18:00 LT and 06:00 LT are presented in this figure for the nights between 2–3 October (a), 12–13 (b) and 13–14 (c) and 17–18 September (d). The events of height enhancements and the AE peak that caused them are marked with the grey colour.
Table 1. Summary of the auroral oval energy injection events in conjunction with the ionospheric height enhancements at middle latitudes Date and start time Max AE (nt) Duration of the Dissipated Joule Max Time delay
ejection event (h) energy (1021erg) d(hmF2)% (min)
29–30 Sept., 02:45 UT 590 3.0 11.1 15 135 30 Sept.–1 Oct., 19:45 UT 598 1.3 4.2 19 60 30 Sept.–1 Oct., 22:40 UT 851 4.3 18.3 31 105 2–3 Oct., 18:30 UT 970 3.0 14.0 23 120 2–3 Oct., 01:45 UT 577 4.0 13.8 35 35 4–5 Oct., 20:27 UT 1211 2.5 12.2 30 105 4–5 Oct., 23:20 UT 923 4.5 18.5 41 50 5–6 Oct., 18:15 UT 1319 4.0 26.4 32 165 5–6 Oct., 00:10 UT 534 2.0 7.2 37 135 12–13 Oct., 03:25 UT 1259 2.5 20.2 56 5 13–14 Oct., 01:00 UT 592 5.0 15.7 35 90 14–15 Oct., 00:50 UT 599 2.0 7.3 26 55 17–18 Sept., 22:35 UT 2341 6.5 37.6 65 70 18–19 Sept., 00:50 UT 415 1.0 3.1 30 165 19–20 Sept., 23:55 UT 580 4.0 12.8 30 170
better describe the ionospheric structure response.
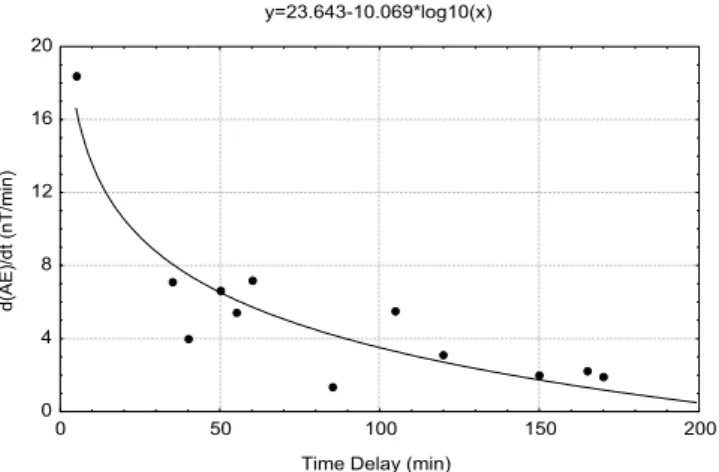
To better organize the above findings and in an effort to quantitatively relate the auroral activity with the ionospheric response at middle latitudes, the rate of AE index increase was estimated for the most clear cases, and is presented in Fig. 10 as a function of the time delay in height enhancement observations with reference to the onset of an energy dissi-pation episode. It is obvious that the time delay of height en-hancements increases with the decreasing AE index deriva-tive, indicating that the height enhancements are strongly as-sociated to the rate of the solar-wind energy dissipation at the
auroral ionosphere. Sudden release of the energy at auroral latitudes is followed after a short time delay (probably less than 5 min) by an uplifting of the F2-layer (see, for example, the 12–13 October event in Fig. 9b), while gradually driven energy dissipation may affect the ionospheric structure a few hours later (see, for example, the driven event of 13–14 Oc-tober presented in Fig. 9c). Since the Athens Digisonde ob-serves significant height enhancement only when the AE ex-ceeds 300 nT, the dissipated energy may also be a key param-eter for height disturbance observations at middle latitudes. In support of this, we present the maximum percentage of
1236 I. Tsagouri and A. Belehaki: On the nature of nighttime ionisation enhancements
y=23.643-10.069*log10(x)
Time Delay (min)
d( A E )/ dt ( n T/m in) 0 4 8 12 16 20 0 50 100 150 200
Fig. 10. The rate of AE index increase, estimated for 12 clear cases of nighttime height enhancements, as a function of the time delay in height enhancements observation with reference to the onset of an energy dissipation episode.
hmF2 variation versus the dissipated Joule energy in the
au-rora causing the F2 uplifting event in Fig. 11a, and versus the maximum value of the AE index for each event in Fig. 11b. A clear dependence is evident there, although uncertainties in the estimation of the relevant quantities do not allow us to determine the exact form of the dependence.
Assuming that the height enhancements propagate from auroral latitudes to middle latitudes, such as TID distur-bances, and that the time delay is related to the propagation velocity of them, the above statement also holds for the prop-agation velocities’ behaviour and may be an explanation for the large range of velocities that have been reported. More precisely, studies based on meridionally spaced “chains” of ionosondes give high velocity values. For example, Hajkow-icz and Hunsucker (1987) found an equatorward propaga-tion velocity of about 800 m/s and a constant period of about 135 min. Similar results were reported by Yeh et al. (1994) in a study based on spaced TEC measurement from geosta-tionary satellite signals, and from ionosonde chains. Their derived velocities correspond more to the meridional veloc-ity component of the disturbance front than to the true phase velocity of TID propagation. Taking into account any de-viation from the equatorward propagation, these estimated values correspond to much smaller phase velocities. On the other hand, whenever the spaced beam reception method was used at the EISCAT incoherent scatter station, the de-termined phase velocities never exceeded 400 m/s (Ma et al., 1998). Measurements from the MU radar gave even smaller estimates (averaging about 240 m/s) (Oliver et al., 1997), while Super-DARN (Hall et al., 1999) velocities were simi-lar to TID velocities. Furthermore, Afraimovich et al. (2000) devised a technique for determining TID parameters using GPS-arrays whose elements can be selected from a large set of GPS stations and determined a phase velocity of about 300 m/s.
Supposing that the source region of the observed
distur-Max AE (nT) Max (hmF2)% 10 20 30 40 50 60 70 200 600 1000 1400 1800 2200 2600
Dissipated Joule Energy (1021 erg)
Max (hmF2)% 10 20 30 40 50 60 70 0 5 10 15 20 25 30 35 40 45
Fig. 11. (a) The maximum d(hmF2)% variation versus the dissi-pated Joule energy in the aurora causing the F2 uplifting event. (b) The maximum d(hmF2)% variation versus the maximum value of
AEindex for each event.
bances is the auroral oval region (∼60◦) and assuming that they propagate in an equatorward direction, rough estimates of their propagation velocities can be made. In the cases pre-sented above, the propagation velocity ranges from 270 m/s to 1280 m/s, which again correspond better to the meridional velocity component of the disturbance front than to the true phase velocity propagation. But since deviation of the az-imuth of TID propagation from the equatorward direction to the westward direction by 10–20◦, on average, has been re-ported (Oliver et al., 1997; Ma et al., 1998; Hall et al., 1999; Afraimovich et al., 2000), the true phase velocities may be much smaller.
5 Discussion and conclusions
In an effort to define the ionospheric structure at middle lat-itudes during events of nighttime ionisation enhancements, three storm periods in September and October 2000 were an-alyzed, when six distinct magnetic storms were determined. These storms were also analyzed by Belehaki and Tsagouri (2002) in light of the global solar wind-magnetosphere-ionosphere interaction using solar wind data, magnetospheric indices and ionospheric observations from an EW and NS
chain of middle latitude stations for each storm event. The data analysis gave evidence that the solar wind conditions leading to storm events, which are reflected in Dst develop-ment, are closely related to the occurrence of nighttime posi-tive effects at middle latitudes. In particular, it was found that systematic nighttime positive effects were observed at mid-dle latitudes during gradually driven magnetic storms. An interesting remark was that they were always associated with F2 peak height enhancements. The opposite, however, was not always valid, since peak height enhancements could also be followed by nighttime ionisation depletions.
The height variations for various plasma frequencies dur-ing nighttime hours were studied in detail with observations from the Athens Digisonde. The height enhancements were estimated to be as much as 60% from their corresponding quiet values, having wave-like characteristics, which were found to be quite similar in both ionisation enhancement and depletion periods. Their periodicity ranges from 1 h to 5.5 h, with a tendency for smaller periodicities to occur during ion-isation enhancements and before local midnight, when the ionisation density appears greater. This dependence on ioni-sation density may be a possible explanation for the wave-like enhancement’s observation to be more evident during nighttime positive effects. Moreover, a dependence of the periodicity and of the amplitude on the frequency and/or al-titude was indicated that might be explained in terms of the atmospheric density dependence on altitude (Richmond and Lu, 2000). A rather consistent feature is their rapid attenua-tion in daytime. This attenuaattenua-tion is attributed to the ion drag that retards the gravity wave propagation associated with the high ionization density of the F-region in daytime (Hajkow-icz, 1990; Balthazor and Moffett, 1999).
Investigating the effect of the auroral oval activity on the ionospheric response over Athens, the relation of the AE in-crease rate with the time delay in observing height enhance-ments was determined with reference to the onset of each energy dissipation episode. It is concluded that the time de-lay of height enhancement increases with decreasing the AE time derivative, indicating that the occurrence of height en-hancements is strongly associated with the rate of the solar-wind energy dissipation in the auroral ionosphere.
Taking into account the wave-like character of height en-hancements and their correlation with the auroral oval activ-ity, these perturbations they may be considered as TID man-ifestations. Assuming then that they propagate from auroral latitudes to middle latitudes, such as TID disturbances, and that the time delay is related to their propagation velocity, the above statement also holds true for the propagation ve-locities’ behaviour and may be an explanation for the large range of velocities that have been reported. TID consider-ation could justify a possible explanconsider-ation for ionisconsider-ation en-hancements (Pr¨olss, 1993; Miller, 1997), although the lack of ionisation in the night-side hemisphere does not support any traditional scenario in ionisation enhancements attribu-tion. Indeed, no consistent relation between the F2 peak den-sity and height variations were found, so it follows that the variations in the two ionospheric parameters are attributed to
two distinct mechanisms. Moreover, the height increases are common features of the ionospheric behaviour during events of either ionisation decreases or increases at night. This is in confirmation of the storm scenario proposed by Pr¨olss (1993) in which changes in layer height are predicted for any lo-cal time. An additional feature that supports the idea that a new source of ionisation is responsible for the observed nighttime ionisation enhancements is the very good correla-tion between the ITEC deviacorrela-tions from their quiet values and the foF2 deviations. Since a net increase of ionisation is ob-served during nighttime ionisation enhancements, it follows that the responsible mechanism cannot simply be an internal redistribution of ionisation.
The plasmaspheric fluxes’ scenario fits very nicely to our findings and agrees with what was previously suggested (e.g. Rishbeth, 1987; Richards, 1994). The possibility of observ-ing its effects is a question of geomagnetic latitude and of so-lar wind conditions that triggered the magnetic storm (Bele-haki and Tsagouri, 2002). The launch of waves from the au-roral oval in any activation of auau-roral electrojets, according to our findings, is an additional mechanism, which occurs independently of the feeding with ionisation from the plas-masphere.
Summarizing, we can conclude that nighttime ionisation enhancements and nighttime F2 uplifting are attributed to two distinct mechanisms. Height enhancements are wave-like disturbances that most probably originate in the auroral oval region and propagate toward the equator-like TID dis-turbances. Their observation depends on the ionisation den-sity of the ionosphere, which makes their appearance dur-ing ionisation depletion periods less evident. On the other hand, nighttime ionisation enhancements observed in terms of foF2 do not share the same wavy appearance, which may mean that they are not connected to TIDs, nor to auroral oval origin. The increased nighttime density can only be speculated to be due to increased downward fluxes from the plasmasphere (Rishbeth, 1987; Richards, 1994). In fact, the plasmaspheric flux term can also modify the value of
hmF2 and be a contributor to the increased height
observa-tion (Szuszczewicz et al., 1998).
Acknowledgements. We are grateful to the WDC-C2 for
Geomag-netism, Kyoto for providing the provisional Dst-index and prelim-inary AE indices. This work was supported by the General Sec-retariat for Research and Technology of the Greek Ministry for Development under the research project “Installation and develop-ment of a fully automated Digisonde by the National Observatory of Athens” (http://www.iono.noa.gr).
Topical Editor M. Lester thanks B. Reinisch and another referee for their help in evaluating this paper.
References
Afraimovich E. L., Kosogorov. E. A., Leonovick, L. A., Palamart-couk, K. S., Perevalova, N. P., and Pirog, O. M.: Determining parameters of large scale travelling ionospheric disturbances of auroral origin using GPS-arrays, J. of Atmospheric and Solar-Terrest. Physics, 62, 553–565, 2000.
Akasofu S.-I.: Energy coupling between the solar wind and the magnetosphere, Space Sci. Rev., 28, 121–190, 1981.
Balthazor R. L. and Moffett, R. J.: Morphology of large scale travel-ling atmospheric disturbances in the polar thermosphere, J. Geo-phys. Res., 104, 15–24, 1999.
Bauske R. and Prolss, G. W.: Modelling the ionospheric response to travelling atmospheric disturbances, J. Geophys. Res., 102, 14 555–14 562, 1997.
Belehaki A. and Tsagouri, I.: On the occurrence of storm induced night-time ionisation enhancements at ionospheric middle lati-tudes, J. Geophys. Res. (in press), 2002.
Burnside, R. G., Templey, C. A., Sulzer, M. P., Fuller-Rowell, T. J., Torr, D. G., and Roble, R. G.: The neutral thermosphere at Are-bico during geomagnetic storms, J. Geophys. Res., 96, 1289– 1301, 1991.
Davis, T. N. and Sugiura, M.: Auroral electrojet activity index AE and its universal time variations, J. Geophys. Res., 71, 785–801, 1966.
Fuller-Rowell, T. J., Codrescu, M. V., Moffett R. J., and Quegan, S.: Response of the thermosphere and ionosphere to geomagnetic storms, J. Geophys. Res., 99, 3893–3914, 1994.
Fuller-Rowell T. J., Codrescu, M. V., Rishbeth, H., Moffett R. J., and Quegan, S.: On the seasonal response of the thermosphere and ionosphere to geomagnetic storms, J. Geophys. Res., 101, 2343–2353, 1996.
Hajkowicz, L. A.: A global study of traveling ionospheric distur-bances (TIDs) followinga step-like onset of auroral substorms in both hemispheres, Planet. Space Sci., 38, 913–923, 1990. Hajkowicz, L. A. and Hunsucker, R. D.: A simultaneous
observa-tion of large scale periodic TIDs in both hemispheres following the onset of auroral disturbances, Planet. Space Sci., 35, 785– 791, 1987.
Hall G. E., MacDougall, J. W., Cecile, J.-F., Moorcroft, D. R., and St.-Maurice, J. P.: Finding gravity wave source positions using the Super Dual Auroral Radar Network, J. Geophys. Res., 104, 67–78, 1999.
Huang, X. and Reinisch, B. W.: Vertical electron density profiles from the Digisonde network, Adv. Space Res., 18, 6, 121–129, 1996.
Huang, X. and Reinisch, B. W.: Vertical total electron content from ionograms in real time, Radio Sci., 36, 335–342, 2001.
Kamide Y., Yokoyama, N., Gonzalez, W., Tsurutani, B. T., Daglis, I. A., Brekke, I., and Masuda, I.: Two-step development of geo-magnetic storms, J. Geophys. Res., 103, 6917–6921, 1998. Ma S. Y., Schlegel K., and Xu, J. S.: Case studies of the
propaga-tion characteristics of auroral TIDs with EISCAT CP2 data using maximum entropy cross-spectral analysis, Ann. Geophysice, 42, 161–167, 1998.
Mansilla G. A. and Manzano, J. R.: Some theoretical aspects of ionospheric storms at middle latitudes, Annali di Geofisica, 4, 511–517, 1998.
Mayaud P. N.: Derivation, Meaning and Use of Geomagnetic In-dices, AGU Geophysical Monograph, Series, 1980.
Mayr H. G. and Volland, H.: Composition waves in the thermo-sphere, J. Geophys. Res., 81, 671–676, 1976.
Miller, C. A.: Electrodynamics of midlatitude spread F2. A new the-ory of gravity wave electric fields, J. Geophys. Res., 102, 11 533– 11 538, 1997.
Oliver W. L. and Hagan, M. E.: Simulation of a gravity wave over the middle and upper atmosphere radar, J. Geophys. Res., 96, 9793–9800, 1991.
Oliver W. L., Otsuka, Y., Sato, M., Takami, T. and Fukao, S.: A climatology of F region gravity wave propagation over the mid-dle and upper atmosphere radar, J. Geophys. Res., 102, 14 449– 14 512, 1997.
Potter W. E., Kayser D. C., and Mauersberger, K.: Direct mea-surements of neutral wave characteristics in the thermosphere, J. Geophys. Res., 81, 5002–5012, 1976.
Pr¨olss, G. W.: On explaining the local time variation of ionospheric storm effects, Ann. Geophysicae, 11, 1–9, 1993.
Reinisch, B. W.: Modern Ionosondes, in: Modern Ionospheric Sci-ence, (Eds) Kohl, H., Ruster, R., and Schlegel, K., European Geophysical Society, 37191 Katlenburg-Lindau, Germany, 440– 458, 1996.
Reinisch, B. W. and Huang, X.: Automatic Calculation of Electron Density Profiles from Digital Ionograms, 3, Processing of Bot-tomside Ionograms, Radio Sci., 18, 477–492, 1983.
Reinisch, B. W. and Huang, X.: Finding better B0 and B1 parame-ters for the IRI F2-profile function, Adv. Space Res., 22, 6, 741– 747, 1998.
Richards, P. G., Torr, D. G., Buonsanto, M. J., and Sipler, D. P.: Ionospheric effects of the March 1990 magnetic storm: Compar-ison of theory and measurement, J. Geophys. Res., 99, 23 359– 23 365, 1994.
Richmond, A. D. and Lu, G.: Upper-atmospheric effects of mag-netic storms: a brief tutorial, J. of Atmospheric and Solar-Terrest. Physics, 62, 1115–1127, 2000.
Rishbeth, H., Fuller-Rowell T. J., and Rodger, A. S.: F-layer storms and thermospheric composition, Phys. Scr., 36, 327–336, 1987. Rishbeth, H. and Garriott, O. K.: Introduction to Ionospheric
Physics, Academic Press New York and London, 1969. Szuszczewicz, E. P., Lester, M., Wilkinson, P., Blanchard, P.,
Abdu, M., Hanbaba, R., Igarashi, K., Pulinets, S., and Reddy, B. M.: A comparative study of global ionospheric responses to intense magnetic storm conditions, J. Geophys. Res., 103, 11 665–11 684, 1998.
Trinks, H. and Mayr, H. G.: Large scale neutral composition gravity waves in the thermosphere observed by ESRO 4, J. Geophys. Res., 81, 4023–4026, 1976.
Tsagouri I., Belehaki, A., Moraitis, G., and Mavromichalaki, H.: Positive and negative ionospheric disturbances at middle lati-tudes during geomagnetic storms, Geophys. Res. Lett., 27, 3579– 3582, 2000.
Yeh, K. C., Ma, S. Y., Lin, K. H., and Conkright, R. O.: Global ionospheric effects of the October 1989 geomagnetic storm, J. Geophys. Res., 99, 6201–6218, 1994.