HAL Id: hal-00763885
https://hal.inria.fr/hal-00763885
Preprint submitted on 14 Dec 2012
HAL is a multi-disciplinary open access
archive for the deposit and dissemination of sci-entific research documents, whether they are pub-lished or not. The documents may come from teaching and research institutions in France or abroad, or from public or private research centers.
L’archive ouverte pluridisciplinaire HAL, est destinée au dépôt et à la diffusion de documents scientifiques de niveau recherche, publiés ou non, émanant des établissements d’enseignement et de recherche français ou étrangers, des laboratoires publics ou privés.
Analytical and numerical study of the apparent diffusion
coefficient in diffusion MRI at long diffusion times and
low b-values
Jing-Rebecca Li, Denis Le Bihan, Thong Quoc Nguyen, Denis Grebenkov,
Cyril Poupon, Houssem Haddar
To cite this version:
Jing-Rebecca Li, Denis Le Bihan, Thong Quoc Nguyen, Denis Grebenkov, Cyril Poupon, et al.. Analytical and numerical study of the apparent diffusion coefficient in diffusion MRI at long diffusion times and low b-values. 2012. �hal-00763885�
1
Analytical and numerical study of the apparent diffusion
coefficient in diffusion MRI at long diffusion times and low
b-values
J.R. Li1,2*, D. Le Bihan2, T.Q. Nguyen1, D. Grebenkov3, C. Poupon2, H. Haddar1
1
INRIA Saclay Equipe DEFI, CMAP Ecole Polytechnique, Palaiseau Cedex, France 2
NeuroSpin, CEA-Saclay Center Gif sur Yvette, France 3
LPMC CNRS Ecole Polytechnique, Palaiseau, France
Running title: ADC at long diffusion times and low b values
Correspondent:
Jing-Rebecca Li
INRIA Saclay-Equipe DEFICMAP, Ecole Polytechnique Route de Saclay, 91128, Palaiseau Cedex, France jingrebecca.li@inria.fr
+33-1-69-08-94-82
2
Abstract
Diffusion magnetic resonance imaging provides a measure of the average distance travelled by water molecules in a medium and can give useful information on cellular structure and structural change when the medium is biological tissue. In this paper, two approximate models for the apparent diffusion coefficient at low b-values and long diffusion times are formulated and validated. The first is a steady-state partial differential equation model that gives the steady-state (infinite time) effective diffusion tensor for general cellular geometries. For nearly isotropic diffusion where the intra-cellular compartment consists of non-elongated cells, a second approximate model is provided in the form of analytical formulae for the eigenvalue of the steady-state effective diffusion tensor. Both models are validated by numerical simulations on a variety of cells sizes and shapes.
3
Introduction
Diffusion MRI (DMRI) provides a measure of the average distance travelled by water molecules in tissues and can give useful information on tissue structure and changes that occur when the tissue is challenged physiologically or pathologically. A large number of works have appeared in the last 25 years that show that DMRI measurements can be correlated with various physiological or pathological conditions, especially, but not only, in the brain [1]. The most striking example comes from the detection of acute cerebral ischemia on the basis of lower than normal apparent diffusion coefficient a few minutes after stroke [2, 3]. Diffusion MRI also has been used for cancer detection and treatment monitoring, as diffusion seems to be linked to tumor cellularity [4, 5, 6]. Finally, recent work has suggested that water diffusion MRI could also be used to visualize changes in tissue microstructure that might arise during neuronal activation: a transient decrease in water diffusion has been reported in the human brain visual cortex during activation by a black and white flickering checkerboard [7]. Based on the known sensitivity of diffusion MRI to cell size in tissues [8, 9] and on optical imaging studies that have revealed changes in the shape (in particular swelling) of neurons and glial cells during brain activation [10, 11, 12], the observed ADC findings have been tentatively ascribed to a transient swelling of cortical cells.
However, even though the potential applications of diffusion MRI have multiplied rapidly, the understanding of the exact biophysical mechanisms behind the properties of water diffusion measurements obtained by MRI in biological tissue is still limited. In most articles that demonstrate a statistically significant correlation between the measured DMRI signal and some physiological or pathological parameters, the connection is usually explained only qualitatively.
The effort to make a more quantitative connection between tissue properties and the measured diffusivity has led to the development of various biophysical models. Solutions to such models can be obtained analytically in some simple conditions, for instance, assuming infinitely short duration gradient pulses and a diffusion partial
4
differential equation (PDE) model in simple geometries [13, 14]). For more realistic modeling, validation can be obtained using computer simulations on PDE models [15, 16, 17] or using Monte-Carlo simulations of the individual diffusive displacements of water molecules in given tissue configurations [18, 19]. Whenever possible, validation must be obtained in vivo using biological models where certain tissue parameters have been controlled. In vivo experiments can also be used to estimate some parameters required by the biophysical models [20].
In this article, we consider the diffusion MRI signal attenuation at relatively long diffusion times and low b-values. We start with the multiple compartments Bloch-Torrey PDE [21, 22] as the full, ‘gold-standard’, model. We show that the apparent diffusion coefficient, which depends on the diffusion gradient direction vector q/||q||, of the DMRI signal obtained at low values, or more precisely, the slope of the log signal versus b-value curve at b=0, which we denote by ADC0(q/||q||), converge to a limit as the diffusion time increases. We call this limit the steady-state limit of the ADC0. We show that, for general cellular geometries, this steady-state limit can be obtained by solving a set of time-independent PDEs using mathematical homogenization theory [23] to obtain the homogenized diffusion tensor which we denote by DH. In other words, ADC0(q/||q||) approaches qTDHq/||q||2, as the diffusion time increases to infinity. In addition, we show that if the diffusion is nearly isotropic, i.e., if for any q, qTDHq/||q||2 =DH (a homogenized diffusion coefficient) and if the intra-cellular compartment is made up of cells that are not elongated, DH can be accurately approximated by two existing analytical models that relate DH to the biophysical parameters of the tissue, namely, the diffusion coefficients in compartments, the membrane permeability and the average inter-cell distance.
Our numerical analysis uses experimental parameters typically obtained with clinical scanners, i.e., using pulsed gradient spin-echo (PGSE) sequences with somewhat long diffusion times (e.g. 10-85 ms) and low b-values (b between 0 and 500 s/mm2). First, we will show that a three-compartment model of tissue, consisting of the intra-cellular, the extra-cellular, and membrane compartments, can be replaced by a two-compartment model consisting of only the intra-cellular and extra-cellular
5
compartments, along with a permeability condition on the infinitely thin interface between the intra and extra-cellular compartments. Next, we will show that
ADC0(q/||q||) approaches qTDHq/||q||2 as the diffusion time increases for general two-compartment tissue geometries, including a configuration of many randomly oriented and placed cylindrical and spherical cells. Finally, given the additional assumption that the cells are not too elongated and that the diffusion is nearly isotropic, we show that two existing analytical models give good approximations to the homogenized diffusion coefficient, DH=qTDHq/||q||2 for any q. We support this last conclusion by numerical simulations on periodic arrays of cubic cells, spherical cells squeezed to high volume fraction, and polyhedral cells. We then analyze how DH is sensitive to tissue parameters and show that at low permeability, DH is mainly influenced by the extracellular space.
.
Theory
Multiple-compartment Bloch Torrey PDE model with finite permeability
The water magnetization in biological tissue in the presence of applied magnetic field gradient pulses at the voxel level can be modeled by a multiple compartment Bloch-Torrey PDE [21, 22] and this model is our starting point. This model is complex enough to incorporate some interesting and useful biological properties of tissue, but at the same time, it is sufficiently simple to allow theoretical analysis. In this article we consider the tissue to be made of two compartments, i and e, representing the ensemble of homogeneous intracellular spaces, and the extra-cellular space, respectively. We model the cell membranes as infinitely thin (compared to cell size) permeable interfaces. However, we will also show that a three-compartment model, where the third compartment is the membrane layer, approaches the diffusion behavior of the two-compartment model as the thickness of the membrane layer goes to 0 if we replace the membrane layer by an infinitely thin interface with permeability = Dm/h,
6
thickness. Thus, any results we obtain for the two-compartment model can be applied directly to the three-compartment model if the membrane layer is thin.
The two/three compartment Bloch-Torrey PDE model should be seen as a starting point to investigate the relationship of cellular geometry to measured diffusivity. More complex models may also be introduced, for instance considering a compartment of water molecules in interaction with membranes [11], but this is out of the scope of this work.
We start from a mass of water molecules located at x0 at t = 0 and we search for the
magnetization at time t due this initial density. For a given magnetic field gradient with normalized time profile g(t), max(abs(g(t)))=1, intensity ||G|| and direction vector G/||G||, the magnetization in compartment j (where j can be i, e, the intra-cellular or the extra-cellular compartment, respectively), denoted mj, satisfies the Bloch-Torrey PDE:
[1] with q := G, where is the gyromagnetic ratio of water proton. We note here that g(t) is made negative for t>=TE/2, where TE is the echo time. The intrinsic diffusion coefficients in the intra-cellular and extra-cellular compartments are Di, De, respectively. The initial mass can be located anywhere in the voxel:
[2] The PDE in Eq. [1] and the initial condition in Eq. [2] need to be supplemented by interface conditions where two compartments come together. The first is the conservation of flux:
[3] where nk is the outward pointing normal and jk is the interface between compartments j and k, and the second is a permeability condition:
[4] where is the membrane permeability. The total signal (non-normalized) is then
7
where the integral is taken over all compartments and all initial conditions.
In a homogeneous medium with free (hence Gaussian) diffusion, the plot of the log of the signal versus b-value, where the b-value depends on q and t as:
, [6]
would be linear and the slope of the line, also called the first moment with respect to b-value, would be the intrinsic diffusion coefficient. In biological tissue, the medium is heterogeneous. Fitting the data by a straight line thus leads only to an “apparent diffusion coefficient” (ADC) which is a complex mixture of the tissue parameters [24]:
. [7]
However, at high b values (above 1000s/mm² in the brain) the log of the signal attenuation is not linear with the b-value because diffusion is not Gaussian [25] at physically relevant diffusion times. Because of the curvature of log signal curve, the ADC appears to depend on the b-value and a more comprehensive model must be used. For instance, the log signal curve can be fitted by a bi-exponential [26, 11]:
, [8]
where Df and Ds, vf, 1-vf, are the fitted diffusion coefficients and volume fractions of two Gaussian diffusion pools. In the limit of short diffusion time, Df and Ds, vf, 1-vf, have physical interpretation as the intrinsic diffusion coefficients of the two pools, for instance the extra-cellular and intra-cellular compartments and their respective volume fractions. However, when the diffusion time increases, because of the exchange between the pools those fitted parameters become complicated mixture of the intrinsic diffusion coefficients, the exchange time (or the permeability) between the compartments, their shapes, and the acquisition parameters [27].
The log signal curve can also be fitted as a cumulant expansion of the b-value. Limiting to the second order (quadratic polynomial) in b-value one gets [28, 29]:
8
where KUR0 is called Kurtosis and characterizes the deviation of the signal from a mono-exponential decay in b-value. In this article we denoted the linear term (the first moment with respect to b-value) by ADC0 instead of ADC (as a deviation from the notation in [28, 29]) to distinguish it from the ADC defined by Eq. [7]. ADC0 can be thought of as the derivative of the fitted quadratic polynomial function, extrapolated to b
= 0. If we take the derivative of the the bi-exponential function in Eq. [8] at b = 0, we
obtain:
[10]
thus, making a connection between the bi-exponential model and ADC0.
It is important to note that although ADC0 is independent of the b-value by construction, it is no longer an intrinsic parameter and highly depends on the diffusion time, as well as the combined tissue properties, the object of this work.
Effective diffusion tensor of homogenization
In a homogeneous medium, the ADC0 would be simply the intrinsic diffusion coefficient. At long diffusion times, water molecules have had time to travel a diffusion distance that is long compared to the average size of the cells (hence water molecules switch back and forth between the intra and extracellular compartments several times), one can expect that some kind of ‘effective’ diffusion tensor can be used to describe the average diffusion behavior.
We have used the theory of homogenization to obtain the infinite diffusion time effective diffusion tensor DH. Because homogenized equations are usually formulated for problems with infinite permeability, = ∞, on the interface between different compartments, we had to make a limit argument on the width of the interface to obtain the set of steady-state PDE below (see derivation in the Appendix) taking into account a finite permeability < ∞ between the intra-cellular and extra-cellular compartments. At the same time, this limit argument can also be used to justify the replacement of the
9
three-compartment model comprising of the intra-cellular, the extra-cellular, and a thin membrane layer compartment (with = ∞) by a two-compartment model where the membrane layer is replaced by an infinitely thin interface with permeability =Dm/h,
where Dm is the intrinsic diffusion coefficient in the membrane layer, and h is the membrane layer thickness. Similar equations have first appeared in [30] in the context of effective conductivity, but as far as we know, these equations have not been used in the modeling the long time diffusion MRI signals in the presence of finitely permeable membranes.
In mathematical homogenization theory [23] a series solution of the diffusion problem can be formulated in powers of , where is the length scale of the spatial variation of the medium, in our case, around the average cell size. The leading order solution, which we will describe below, is accurate when is small compared to the diffusion distance.
We assume the computational domain is a cube, denoted C, with side length W: , that contains a configuration of cells. The computational cube C is assumed to repeat periodically in all three coordinate directions many times to make up one voxel. We assume C is small compared to the size of the voxel from which we get the DMRI signal. Hence, we can make the approximation that C is repeated an infinite number of times in all three coordinate directions.
The homogenized diffusion tensor DH is given by
[11]
where the entries of the matrix are:
, [12]
and where the auxiliary function is defined piecewise on j and satisfies the time-independent PDE
10
[13]
The vector em is the unit vector in the mth coordinate direction. In summary, to obtain we solve three time-independent equations of the form in Eq. [13] for each of the three coordinate directions and use the formula in Eq. [12]. We note that the PDE in Eq. [13] does not depend on time and the diffusion gradient, hence it is less computationally expensive to solve than the original time-dependent Bloch-Torrey equation. At long diffusion times, ADC0, computed by solving the Bloch-Torrey PDE numerically, should
approach the steady-state value, , predicted by the homogenized diffusion tensor (see [23]).
Analytical approximations for the isotropic two-compartment effective diffusion tensor
In a nearly isotropic medium, the eigenvalues of are approximately equal. The effective diffusion tensor DH can then be replaced by an effective diffusion coefficient
DH. In the case of two compartments, the intra-cellular and the extra-cellular spaces, there are approximate analytical expressions for DH in the literature for periodically placed spherical cells.
In the field of composite media the following analytical approximations for DH were given for circular cells in two dimensions (denoted here DHJ for Hasselman and Johnson) [31] and spherical cells in three dimensions (denoted here DTR for Torquato and Rintoul) [32]:
11
[14]
d being the space dimension (2 or 3), R the radius of the cells, is the membrane
permeability, vi is the intra-cellular volume fraction, and ve = 1-vi is the extra-cellular volume fraction. To generalize this formula to non-spherical cells, we replace R with the following expression
[15]
where L is the distance between the nearest cell centers. We prefer to use L (called the average inter-cell distance in the rest of the paper) instead of R because the formula will be applied to geometries containing multiple cells of different shapes and sizes. In that case, an average radius may be not well defined, whereas an average inter-cell distance is easily defined: we simply count how many cells are in the computational domain C and define L by
, [16]
where W is the side length of C. In other words, L is the inverse of the cubic root the cellularity (number of cells per unit volume).
An early paper in the field of diffusion MRI contains a different analytical approximation. In [33] the following formula was proposed to approximate DH in the case of spherical cells (not valid for 2 dimensional disks):
[17]
where we denote the DH approximation by for the four authors Latour, Svoboda, Mitra, Sotak. We also will replace R with the expression in Eq. [15].
12
Finally, we mention one more analytical formula for DH , denoted DNFJH for the authors, in the special case when the extra-cellular volume fraction is 0, i.e., when vi = 1, given in
[34]:
[18]
which is valid for two and three dimensions.
The approximations for DH, DHJ (2D), DTR(3D) , DLSPS,(3D), and DNFJH (2D and 3D), are called analytical approximations because they are given by simple explicit formulae. These analytical approximations contain five intrinsic biological parameters: the intrinsic diffusion coefficients, De and Di, of the extra-cellular and intra-cellular compartments, the membrane permeability , the intra-cellular volume fraction vi, and the average inter-cell distance L.
Methods
We numerically solved the Bloch-Torrey PDE Eqs. [1]-[4] on the computational domain at b =0, 50, 100, 200, 500, 1000, 1500, 2000, 2500, 3000,
3500, 4000 s/mm2 for the PGSE sequence at fixed and by varying the magnetic field G to get a simulation of the DMRI signal decay and an estimate of ADC0. No noise was added to the data. The pulse duration was fixed at = 2.5ms and several values of between 10 and 85 ms were simulated. We imposed pseudo-periodic boundary conditions on the six faces of C (same as in [16]) to mimic the effect of C repeating an infinite number of times in all three coordinate directions. The numerical method we used is a finite volume space discretization coupled to Runge-Kutta Chebyshev time integration (the code was written in Matlab and Fortran90).
We estimated the time-dependent ADC0 from Eq. [9] by a quadratic fit of the calculated MRI signal in s/mm2. A low range of b-values was chosen to minimize the fitting error of the slope at b = 0 because in this paper we are interested foremost in how
13
ADC0 approaches its steady-state value, rather than how ADC0 could be most robustly computed in practice. For comparison we also computed the bi-exponential fit of ADC0 from Eqs [8] and [10] in s/mm2 (range considered as optimal for a biexponential fit of human brain data [35]).
We computed DH by solving the steady-state PDE in Eq. [13] (the code was written in Matlab) three times, once in each coordinate direction. The computational domain is the same C as for the Bloch-Torrey PDE and the spatial discretization is also the same finite volume discretization. The numerical solutions were obtained on laptop computer (DELL Latitude E6410 Intel(R) Core(TM) i7 CPU M640 @ 2,8GHz). The details of the numerical method will be the topic of a future paper.
Results
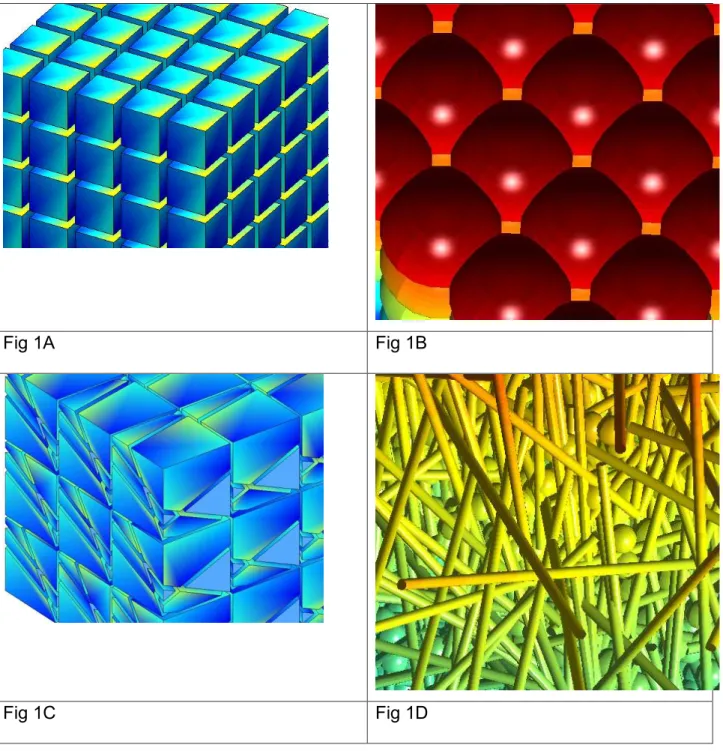
We solved the Bloch-Torrey PDE in Eqs. [1]-[4] on four geometries shown in Fig 1A, 1B, 1C and 1D. The first (Fig 1A) is a periodic array of cubic cells with inter-cell distance L. The second (Fig 1B) is a periodic array of spherical cells with inter-cell distance L that are squeezed together: we enlarge the radius of the spheres, but we do not allow the spheres to cross each other. The squeezed spherical geometry is interesting because the cells touch their neighbors in an area that becomes larger as the cellular volume fraction increases. We can increase the cellular volume fraction of squeezed spherical cells to 100%, at which point, this geometry becomes cubic cells with no extra-cellular space. The third (Fig 1C) is a periodic array of 8 polyhedral cells with different shapes and sizes packed together, the average inter-cell distance is L=5 µm because there are
8 cells in a 103 µm3 volume. The fourth is a combination of cylindrical cells (with diameter 3 µm) and spherical cells (with diameter 8 µm), oriented and placed randomly in a computational domain C = [0,175]3 µm3 (Fig 1D is a zoom of about one tenth of the computational domain) and the extra-cellular volume fraction is ve = 0.17, with the
cylindrical cells taking 43% and the spherical cells taking 40% of the total volume fraction, respectively.
14
Fig 1A Fig 1B
Fig 1C Fig 1D
1. The three-compartment model
First, we show that the homogenized diffusion tensor DH of a three-compartment model consisting of the intra-cellular, the extra-cellular, and the membrane compartments, with respective diffusion coefficients, Di,De,Dm, and = ∞, can be approximated by the DH of
15
a two-compartment model with Di, De, and an interface condition between the intra-cellular and the extra-intra-cellular compartments if we fix the interface permeability to be =
Dm/h, where h is the thickness of the original membrane layer. The standard
steady-state PDE for the three-compartment model with infinite permeability is given in Eq. [20] of the Appendix and it is a well-known result of homogenization theory [23].
We took a two-dimensional cellular geometry with periodically placed square cells with a membrane layer of thickness h and inter-cell distance L (see Fig 2A). The extra-cellular volume fraction is fixed at ve = 0.13 and h is reduced from being 30% of L to 6% of L,
with L going from 2 to 10 µm. We simulated two membrane permeabilities: = 10-4m/s
and = 10-5 m/s, in other words, setting Dm = h, for different values of h. We chose
the intrinsic diffusion coefficients to be De=Di=3x10⁻³mm2/s (diffusion coefficient of free
water at 37°C). We computed DH of the three-compartment model according to Eq. [20] of the Appendix and then we calculated DHh=0, which is the effective tensor from the two-compartment model by solving Eq. [13]. In Fig 2B, because the diffusion is isotropic, we just plot DH, the effective diffusion coefficient, which is the eigenvalue of
DH, divided by DHh=0. We see that when h is less than 5% of L, DH of the three-compartment model is within 95% of DHh=0 of the two-compartment model for both permeabilities.
16
2. Relationship between ADC0 and DH
Now we show that ADC0(q/||q||) approaches the homogenized diffusion coefficient
qTDHq/||q||2 as the diffusion time, (), increases. This fact follows directly from homogenization theory, because the diffusion behavior of the homogenized system is the limit, as time goes infinity, of the diffusion behavior of heterogeneous Bloch-Torrey PDE model [23]. Hence, the ADC0 of the latter approaches DH, which is the ADC0 of the homogenized system. Nevertheless, we conducted some numerical experiments to illustrate the time convergence of ADC0 to DH. For simplicity, we chose q/||q|| = [0,0,1].
First we show that ADC0 obtained by applying the biexponential model (eq. [8], [10]) using 12 b-values between 0 and 4000 s/mm2 and the cumulant expansion model (eq. [9]) using 5 b-values between 0 and 500 s/mm2 are quite close to each other. We computed the DMRI signal by numerically solving Bloch-Torrey equations [1]-[4] with the PGSE sequence =2.5ms =10 to 85ms (in 5ms intervals) at b =0, 50, 100, 200,
500, 1000, 1500, 2000, 2500, 3000, 3500, 4000 s/mm2 in the gradient direction q/||q|| = [0,0,1]. On the domain of the randomly oriented and placed cylinders and spheres (Fig 1D) with ve = 0.17 and De=Di=3x10⁻³mm2/s, = 10-5 m/s, the signal attenuation at the 5
lowest b-values do not vary much with diffusion time (shown in Fig 3 for =
10,20,30,40ms), as opposed to the higher b-values, which have higher relative
variations with diffusion time. We see from Fig 3 (the legend) that ADC0poly and
ADC0biexp differ less than 3%. Thus, in the rest of the paper, ADC0 will be computed by a quadratic fit of 5 b-values between 0 and 500 s/mm2.
17 Fig 3
In Fig 4A, we show the convergence as the diffusion time increases (from =10 ms to =85 ms) of ADC0 (in the gradient direction [0,0,1]) to the homogenized diffusion coefficient DH (the third eigenvalue of homogenized diffusion tensor DH) for the geometries shown in Fig 1A (cubes) and Fig 1D (random cylinders and spheres) with
De=Di=3x10⁻³mm2/s, = 10-5 m/s and = 5x10⁻⁵ m/s . In Fig 4B, we plotted the inverse
diffusion time on the x-axis in log scale and the absolute value of ADC0/DH-1 on the y-axis in log scale. We see a clearly linear relationship between the log of the diffusion time and the log of the relative difference between ADC0 and DH, suggesting the fit ADC0≈Dp+C/(-/3), where DH is expected to be close to the extrapolated value
Dp at infinite diffusion time, and is the exponent of time convergence. In the legend of Fig 4B, we include the 95% confidence interval of the estimate of which is [1.17,1.18] for cubes at = 10-5 m/s, [0.98,0.99] for cubes at = 5x10⁻⁵ m/s, [0.57,0.59]
18
respectively. The range of that we obtained here is consistent with the results of [34] (for the special case of ve = 0). In Fig 4C, we computed the 95% confidence intervals for the fit of Dp, the extrapolated value at infinite diffusion time, using 5 values of =
[65,70,75,80,85] ms. We obtained that the relative difference between DH and the 95% interval of Dp is less than 3% for both geometries and both permeabilities (see legend of Fig 4C).
Fig 4A
19
3. Relationship of DH to tissue parameters and the approximate analytical formulae.
The analytical formulae DHJ (2D), DTR (3D) (Eq. [14]) and DLSMS (3D) (Eq. [17]) are not exact and are derived as approximations of DH for periodic spherical cells and moderate vi. However, we now show numerically that they are also accurate for more general geometrical shapes and high vi (low extra-cellular volume), as long as the cells are not
too elongated, and if the most of the diffusion occurs in the extra-cellular space, rather than directly between neighboring cells.
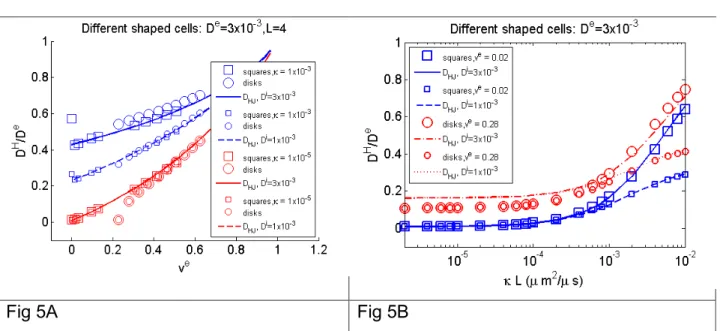
In Fig 5A, we plot DH for two-dimensional array of square cells, marked ‘squares’, and two-dimensional array of circular cells, marked ‘disks’, for L = 4 µm, De=3x10⁻³mm2/s, Di=3x10⁻³mm2/s or Di=1x10⁻³mm2/s, and membrane permeability = 10-5m/s or = 10
-5
m/s for a wide range of ve. We plot the DH normalized by the intrinsic extra-cellular diffusion coefficient De. We see that at low permeability, there is no difference in DH between Di=3x10⁻³mm2/s and Di=1x10⁻³mm2/s. Thus, we remark that the DH reflects
mainly the extra-cellular space at low permeability. We also see that it is not possible to distinguish between circular and square shapes at low permeability. As long as there is a contiguous (unbounded in space) extra-cellular domain, the circular and square cells fall on the same curve, which varies only with ve and not the shape of the cells. This curve is very accurately described by the analytical formula DHJ. However, one can see that the curve for the circular cells behaves differently than that for the square cells as
ve approaches 0.22, i.e., when the circular cells begins to touch each other at a tangent point. Once the circular cells make contact, the extra-cellular space is cut into non-contiguous sections, and the DH rapidly decreases to 0 as shown in Fig 5A at low permeability.
With square cells, at high permeability, we see an odd phenomenon: the DH at ve = 0 is
20
look only at all the ve strictly > 0. The physical explanation of why DH at ve = 0 is higher
than nearby ve>0 for high permeability is that at higher permeability, the water molecules have an easier time going directly from cell to cell when ve = 0, as compared
to having to go through two membranes when the extra-cellular space still exists (nearby small ve > 0). But at lower permeability, water molecules have a hard time
going directly from cell to cell, so the DH at ve = 0 is lower than nearby ve>0.
In Fig 5B, we show that DH depends only on the product L , in other words, as long as the product of and L remains constant, DH will be constant. This fact is easy to see from the analytical formula DHJ, but we also show it numerically by computing DH for many = 10-2,10-3,10-4,10-5,10-6 m/s and L=2,4,6,8,10 µm and plotting DH as a function of L. Clearly, we see all the DH, given a fixed ve, fall on the same curve when plotted against the product L. And again, at low , Di=3x10⁻³mm2/s and Di=1x10⁻³mm2/s
cannot be distinguished. We note DHJ is less accurate at high ve. In addition, we can see that while keeping constant, changing L has a small effect on DH unless is very large.
21
Now we show numerical results for three-dimensional geometries. The first example is periodic cubic cells (Fig 1A) where the distance between the cell boundaries is h, which we varied from 1% to 10% of L, the inter-cell distance. In other words, when h> 0, the cubic cells do not touch each other. Polyhedral cells (Fig 1C) also do not touch each other; the distance between the polyhedral cells is also h. The spherical cells (Fig 1B) are squeezed together: we enlarge the radius of the spheres, but we do not allow the spheres to cross each other. The squeezed spherical geometry is interesting because the cells touch their neighbors in an area that becomes larger as the cellular volume fraction increases. We can increase the cellular volume fraction of squeezed spherical cells to 100%, at which point, this geometry becomes cubic cells with no extra-cellular space. The cubic cells provide an extra-cellular space that is always at least h wide. The squeezed spherical cells provide an extra-cellular space that is pinched in the areas where the neighboring cells touch, so this extra-cellular is more tortuous.
Fig 6A Fig 6B
In Fig 6A, we plot the normalized DH of cubic, polyhedral, and squeezed spherical cells. The DH of cubic cells can be accurately approximated by the analytical formula DTR for both high and low permeability (except at ve = 0 and high permeability due to direct
diffusion from cell to cell without passing through extra-cellular space, as discussed already in the two-dimensional example above). At low permeability, the DH of the squeezed spherical cells is accurately approximated by the analytical formula DLSMS.
22
Hence, we conclude that DTR is useful when the extra-cellular space is of a uniform width (h in the case of cubic cells) and DLSMS is useful when the extra-cellular space is pinched off by neighboring cells touching each other. For both, there must not be a lot of direct diffusion from cell directly to neighboring cell. At high permeability, because the effect of direct diffusion between cells, the DH of the squeezed spheres is much higher than that given by the formula DLSMS. The DH of the polyhedral cells is close to the cubic cells, especially, at low permeability, supporting the argument again that at low permeability, the shape of the cells cannot be distinguished, only the extra-cellular volume fraction.
In Fig 6B, we show that in three dimensions also, only the product L affects DH , not and L separately, by simulating = 10-2,10-3,10-4,10-5,10-6 m/s and L=2,4,6,8,10 µm and
plotting DH against L. Only cubic cells are shown, but the other geometries also exhibit this property. We also include the computed DH for cubic cells when ve = 0 and show
that it is perfectly described by the analytical formula DNFJH. It is clear at low permeability, because the diffusion is controlled via the extra-cellular space, ve=0 results
in a lower DH than a small ve >0, ve = 0.07 in this case. However, at higher permeability,
because the important contribution of the direct diffusion between neighboring cells without passing through the extra-cellular space, the DH at ve = 0 is greater than the DH
at a small ve = 0.07. This conclusion may seem counter-intuitive, but it is clearly
illustrated in Fig 6B. In addition, as in two dimensions, we can see that changing L has a very small effect on DH unless L is very large.
Discussion
Effects of diffusion on the MRI signal are generally described with the Bloch-Torrey PDE. This PDE can be applied to some tissue models, e.g., the presence of two or three compartments, such as the intra-cellular, extra-cellular and membrane compartments. However, for these multiple compartment models, solutions to this PDE cannot be obtained analytically.
23
In this paper, we conducted an analytical and numerical study of the first moment of the log of the DMRI signal in b-value at b=0, denoted ADC0, that we obtained by fitting a quadratic polynomial to the log signal at low b-values (between 0 and 500 s/mm2). We showed that as the diffusion time increases, ADC0 approaches DH, the homogenized diffusion coefficient, which we showed can be obtained by solving a set of time-independent PDEs that are easier to solve than the time-dependent Bloch-Torrey PDE. This way of computing DH is valid for arbitrary cellular geometries.
In addition, we showed that three analytical formulae originally derived for DH of periodic spherical cells: DHJ, DTR (Eq. [14]) and DLSMS (Eq. [17]), also work well for more general shapes of cells at relatively low permeability, as long as the cells are not too elongated and an average inter-cell distance can be defined.
We showed that DH is mainly an indicator of the extra-cellular space at low permeability: decreasing the intrinsic intracellular diffusion coefficient by a factor of 3 had no impact on DH at low permeability. Increasing the average inter-cell distance (increasing cell size at the expense of the cell density so that the total cellular volume fraction remained constant) leads to a moderate decrease in DH only at high cell permeability. On the other hand DH is much affected by changing in the extracellular volume fraction ve, a much more efficient mechanism linking variations of DH with cell size. We infer that at long diffusion times and low b-values water molecules which have remained in cells (not crossing cell membranes), do not contribute much to the signal attenuation.
From experimental point of view, the microstructure of a tissue is not known and has to be inferred by DMRI, in particular, through ADC. We have showed that if ADC0 is obtained at several ‘long’ diffusion times, even if they are still different from DH
, some kind of extrapolation procedure is expected to allow one to get DH from those ADC0 values. Once DH has been obtained in this way, we hope to be able to use the relationship of DH to the tissue parameters, or the analytical approximations to DH that we studied in this paper, to draw certain conclusions about the tissue sample, keeping
24
in mind of course, that these conclusions will mainly concern the extra-cellular space. This is a possible direction of future work.
In practice, in in vivo imaging, the signal attenuation at very low b values would be very noisy as the level of signal attenuation would be small and the effects of blood microcirculation (Intra-voxel Incoherent Motion or IVIM, REF DLB 1988) would interfere with the ADC0 estimation. Hence, the slope at b = 0 should be extrapolated from the log of the whole signal curve obtained from a large range of b-values and fitted either as a polynomial function or a bi-exponential function, and then the slope of this function should be computed analytically at b = 0 to give ADC0.
The two most biologically relevant geometries of tissues that we simulated in this paper are the randomly oriented and placed cylindrical and spherical cells (Fig 1D) for modeling cerebral grey matter and the squeezed spherical cells (Fig 1B) for modeling tumor cells.
In the brain cortex, cell shapes are very complex, they may be “star” like, with neural bodies extended by long axons and dendrites. Indeed, in the brain cortex neuronal cell bodies measure approximately 1 to 10 µm, occupying 12% of the cortex volume, while the rest is occupied by the neuropile (34% by axons, 35% by dendrites, measuring respectively 0.5 and 0.9 µm in average), 14% by spines and 6% by the extracellular space which is of the order of 10–30 nm (REF). A lower-limit of around 0.5 µm for intracellular dimensions has been estimated in the synaptic neuropile, which contains the highest density of cellular membranes in gray matter (REF). Furthermore, many subcellular structures, such as mitochondria, vesicles, nuclear membranes also represent obstacles to diffusion. In short, about 90% of cellular elements in the brain cortex are smaller than 1µm. Hence, an improvement of the geometry in Fig 1D (randomly oriented and placed cylinders and spheres) would be necessary to model realistic brain tissue. Such improvements are feasible and present another direction of future work.
25
In summary, ADC0, the first moment, at low b-value, of the log of the DMRI signal attenuation at long diffusion time is mainly a marker of the extracellular space. It can provide information on tissues, as most changes in tissue structure (cell size, cell density) would usually impact the extracellular space fractional volume, but only from an indirect way, i.e., a “negative”, connected imprint of the cellular network. Indeed, the long diffusion time ADC0 will miss tissue structure events involving solely the intracellular space. Clearly, to complete the picture and get information on the intracellular space as well, signal from high b-values (above 3000 or 4000 s/mm²) must be included in the diffusion models. Diffusion studies performed at short diffusion times, when intra-cellular diffusion is not yet quenched, on preclinical scanners equipped with high performance gradient system, would also provide highly valuable information on tissue structure (REF NADYA).
26
Appendix
Derivation of the steady-state two-compartment model formula
In the usual formulation of the multiple compartments homogenization problem, the permeability across interfaces is assumed to be infinite, i.e., the concentration is continuous across the interface. In our problem, the interface permeability is finite and there is a discontinuity in the concentration on the interface.
We derive the time-independent formulation for the two-compartment homogenization problem (shown in Eq. [13]) by introducing an artificial third compartment: an interface compartment consisting of a layer of thickness hlying on the interface between e and i
. We will label the original interface between e and i by and we will label the outer boundary of the artificial interface layer by and the inner boundary of
the interface layer by . We shall label the artificial interface layer l,hand the associated inter-cellular compartment i,h and the associated extra-cellular compartment e,h.
We will start with the standard formulation where the concentration is continuous at the interfaces between the three compartments, i.e., the permeability between e,h and l,h (on ) and between i,h and l,h (on ) is assumed to be infinite. To mimic the effect of the finite permeability between e and i we impose an intrinsic diffusion coefficient in the layer that depends on h in the following way:
[19]
To first order, this relationship will ensure that the permeability condition between e and i (Eq. [4]) is satisfied.
27
The standard formulation of the three-compartment homogenization PDE is the following for each coordinate direction m [23]:
[20]
We will now derive the time-independent homogenized PDEs in the limit as h goes to 0, which is given in Eq. [13]. In Eq. [20] it is not difficult to see the limit as h goes 0 of the first and the last two equations will become the first and the last two relations of Eq(13). We need only to derive equations 2 and 3 in Eq. [13].
From the third equation in Eq. [20] and the divergence theorem, we infer that is almost constant along the width of the thin layer i.e.,
.
The above approximation holds up to O() terms. Taking , one gets, from the third equation of Eq. [20], , and . Therefore , which is what we need to obtain the second equation of Eq. [13]. Next, using a Taylor expansion, for ,
.
We then obtain, using the third and fourth equations in Eq. [20],
. Taking the limit h = 0, we obtain of third equation of Eq. [13].
28
References
[1] D. Le Bihan and H. Johansen-Berg, “Diffusion mri at 25: Exploring brain tissue structure and function,” NeuroImage, no. 0, pp. –.
[2] S. Warach, D. Chien, W. Li, M. Ronthal, and R. R. Edelman, “Fast magnetic resonance diffusion-weighted imaging of acute human stroke,” Neurology, vol. 42, no. 9, pp. 1717–, 1992.
[3] Y. Hasegawa, M. Fisher, L. L. Latour, B. J. Dardzinski, and C. H. Sotak, “Mri diffusion mapping of reversible and irreversible ischemic injury in focal brain ischemia,” Neurology, vol. 44, no. 8, p. 1484, 1994.
[4] T. Sugahara, Y. Korogi, M. Kochi, I. Ikushima, Y. Shigematu, T. Hirai, T. Okuda, L. Liang, Y. Ge, Y. Komohara, Y. Ushio, and M. Takahashi, “Usefulness of diffusion-weighted mri with echo-planar technique in the evaluation of cellularity in gliomas,” J. Magn. Reson. Imaging, vol. 9, no. 1, pp. 53–60, 1999.
[5] D. Schnapauff, M. Zeile, M. B. Niederhagen, B. Fleige, P.-U. Tunn, B. Hamm, and O. Dudeck, “Diffusion-weighted echo-planar magnetic resonance imaging for the assessment of tumor cellularity in patients with soft-tissue sarcomas,” J. Magn. Reson. Imaging, vol. 29, no. 6, pp. 1355–1359, 2009. [6] Y. Tsushima, A. Takahashi-Taketomi, and K. Endo, “Magnetic resonance (mr) differential diagnosis of breast tumors using apparent diffusion coefficient (adc) on 1.5-t,” J. Magn. Reson. Imaging, vol. 30, no. 2, pp. 249–255, 2009.
[7] D. LeBihan, S.-i. Urayama, T. Aso, T. Hanakawa, and H. Fukuyama, “Direct and fast detection of neuronal activation in the human brain with diffusion mri,” PNAS, vol. 103, no. 21, pp. 8263–8268, 2006. [8] D. L. Buckley, J. D. Bui, M. I. Phillips, and S. J. Blackband, “Mri measurement of cell volume fraction in the perfused rat hippocampal slice,” Magn. Reson. Med., vol. 42, no. 3, pp. 603–607, 1999. [9] J. Flint, B. Hansen, P. Vestergaard-Poulsen, and S. J. Blackband, “Diffusion weighted magnetic resonance imaging of neuronal activity in the hippocampal slice model,” NeuroImage, vol. 46, pp. 411– 418, June 2009.
[10] R. Andrew and B. Macvicar, “Imaging cell volume changes and neuronal excitation in the hippocampal slice,” Neuroscience, vol. 62, pp. 371–383, Sept. 1994.
[11] D. LeBihan, “The ’wet mind’: water and functional neuroimaging.,” Physics in medicine and biology, vol. 52, pp. –, Apr. 2007.
[12] I. TASAKI The Japanese Journal of Physiology, vol. 49, no. 2, pp. 125–138, 1999.
[13] D. Grebenkov, “Nmr survey of reflected brownian motion,” Reviews of Modern Physics, vol. 79, no. 3, pp. 1077–1137, 2007.
[14] D. S. Grebenkov, “Laplacian eigenfunctions in nmr. ii. theoretical advances,” Concepts Magn. Reson., vol. 34A, no. 5, pp. 264–296, 2009.
29
[15] S. N. Hwang, C.-L. Chin, F. W. Wehrli, and D. B. Hackney, “An image-based finite difference model for simulating restricted diffusion,” Magnetic Resonance in Medicine, vol. 50, no. 2, pp. 373–382, 2003.
[16] J. Xu, M. Does, and J. Gore, “Numerical study of water diffusion in biological tissues using an improved finite difference method.,” Physics in medicine and biology, vol. 52, pp. –, Apr. 2007.
[17] K. D. Harkins, J.-P. Galons, T. W. Secomb, and T. P. Trouard, “Assessment of the effects of cellular tissue properties on adc measurements by numerical simulation of water diffusion,” Magn. Reson. Med., vol. 62, no. 6, pp. 1414–1422, 2009.
[18] M. Hall and D. Alexander, “Convergence and parameter choice for monte-carlo simulations of diffusion mri,” Medical Imaging, IEEE Transactions on, vol. 28, pp. 1354 –1364, Sept. 2009.
[19] G. T. Balls and L. R. Frank, “A simulation environment for diffusion weighted mr experiments in complex media,” Magn. Reson. Med., vol. 62, no. 3, pp. 771–778, 2009.
[20] K. D. Harkins, J.-P. Galons, J. L. Divijak, and T. P. Trouard, “Changes in intracellular water diffusion and energetic metabolism in response to ischemia in perfused c6 rat glioma cells,” Magn. Reson. Med., vol. 66, no. 3, pp. 859–867, 2011.
[21] H. Torrey, “Bloch equations with diffusion terms,” Physical Review Online Archive (Prola), vol. 104, no. 3, pp. 563–565, 1956.
[22] D. S. Grebenkov, “Pulsed-gradient spin-echo monitoring of restricted diffusion in multilayered structures,” Journal of Magnetic Resonance, vol. 205, pp. 181–195, Aug. 2010.
[23] A. Bensoussan, J.-L. Lions, and G. Papanicolaou, Asymptotic analysis for periodic structures, vol. 5 of Studies in Mathematics and its Applications. Amsterdam: North-Holland Publishing Co., 1978. [24] D. Le Bihan, E. Breton, D. Lallemand, P. Grenier, E. Cabanis, and M. Laval-Jeantet, “Mr imaging of intravoxel incoherent motions: application to diffusion and perfusion in neurologic disorders.,” Radiology, vol. 161, no. 2, pp. 401–407, 1986.
[25] E. O. Stejskal and J. E. Tanner, “Spin diffusion measurements: Spin echoes in the presence of a time-dependent field gradient,” The Journal of Chemical Physics, vol. 42, no. 1, pp. 288–292, 1965. [26] T. Niendorf, R. M. Dijkhuizen, D. G. Norris, M. van Lookeren Campagne, and K. Nicolay, “Biexponential diffusion attenuation in various states of brain tissue: Implications for diffusion-weighted imaging,” Magn. Reson. Med., vol. 36, no. 6, pp. 847–857, 1996.
[27] J. Karger, H. Pfeifer, and W. Heinik, “Principles and application of self-diffusion measurements by nuclear magnetic resonance,” Advances in magnetic resonance, vol. 12, pp. 1–89, 1988.
[28] E. X. Wu and M. M. Cheung, “Mr diffusion kurtosis imaging for neural tissue characterization,” NMR Biomed., vol. 23, no. 7, pp. 836–848, 2010.
[29] D. A. Yablonskiy and A. L. Sukstanskii, “Theoretical models of the diffusion weighted mr signal,” NMR Biomed., vol. 23, no. 7, pp. 661–681, 2010.
30
[30] H. Cheng and S. Torquato, “Effective conductivity of periodic arrays of spheres with interfacial resistance,” Proceedings: Mathematical, Physical and Engineering Sciences, vol. 453, pp. 145–161, Jan. 1997.
[31] D. Hasselman and L. F. Johnson, “Effective thermal conductivity of composites with interfacial thermal barrier resistance,” Journal of Composite Materials, vol. 21, pp. 508–515, June 1987.
[32] S. Torquato and M. D. Rintoul, “Effect of the interface on the properties of composite media,” Phys. Rev. Lett., vol. 75, pp. 4067–, Nov. 1995.
[33] L. L. Latour, K. Svoboda, P. P. Mitra, and C. H. Sotak, “Time-dependent diffusion of water in a biological model system.,” Proceedings of the National Academy of Sciences, vol. 91, no. 4, pp. 1229– 1233, 1994.
[34] D. S. Novikov, E. Fieremans, J. H. Jensen, and J. A. Helpern, “Random walks with barriers,” Nat Phys, vol. 7, pp. 508–514, June 2011.
[35] J. H. Jensen and J. A. Helpern, “Progress in diffusion-weighted imaging: concepts, techniques and applications to the central nervous system,” NMR Biomed., vol. 23, no. 7, pp. 659–660, 2010.