HAL Id: hal-02929652
https://hal.inrae.fr/hal-02929652
Submitted on 3 Sep 2020
HAL is a multi-disciplinary open access
archive for the deposit and dissemination of sci-entific research documents, whether they are pub-lished or not. The documents may come from teaching and research institutions in France or abroad, or from public or private research centers.
L’archive ouverte pluridisciplinaire HAL, est destinée au dépôt et à la diffusion de documents scientifiques de niveau recherche, publiés ou non, émanant des établissements d’enseignement et de recherche français ou étrangers, des laboratoires publics ou privés.
Tobias Chilla, Anna Heugel, Thomas Streifeneder, Elisa Ravazzoli, Peter
Laner, Ulrike Tappeiner, Francesca Teston, Lukas Egarter, Thomas Dax,
Ingrid Machold, et al.
To cite this version:
Tobias Chilla, Anna Heugel, Thomas Streifeneder, Elisa Ravazzoli, Peter Laner, et al.. The Alps 2050 Atlas ALPS 2050: COMMON SPATIAL PERSPECTIVES FOR THE ALPINE AREA. TOWARDS A COMMON VISION Inspire Policy Making by Territorial Evidence. [Contract] European Union; ESPON 2020 Monitoring Committee. 2019, 78 p. �hal-02929652�
HAL Id: hal-02929652
https://hal.inrae.fr/hal-02929652
Submitted on 3 Sep 2020
HAL is a multi-disciplinary open access
archive for the deposit and dissemination of sci-entific research documents, whether they are pub-lished or not. The documents may come from teaching and research institutions in France or abroad, or from public or private research centers.
L’archive ouverte pluridisciplinaire HAL, est destinée au dépôt et à la diffusion de documents scientifiques de niveau recherche, publiés ou non, émanant des établissements d’enseignement et de recherche français ou étrangers, des laboratoires publics ou privés.
TOWARDS A COMMON VISION Inspire Policy
Making by Territorial Evidence
Tobias Chilla, Anna Heugel, Jean-François Ruault, Thomas Streifeneder, Elisa
Ravazzoli, Peter Laner, Ulrike Tappeiner, Francesca Teston, Lukas Egarter
To cite this version:
Tobias Chilla, Anna Heugel, Jean-François Ruault, Thomas Streifeneder, Elisa Ravazzoli, et al.. The Alps 2050 Atlas ALPS 2050 COMMON SPATIAL PERSPECTIVES FOR THE ALPINE AREA. TO-WARDS A COMMON VISION Inspire Policy Making by Territorial Evidence. 2019. �hal-02929652�
The Alps 2050
Atlas
ALPS 2050
COMMON SPATIAL PERSPECTIVES FOR THE ALPINE AREA.
TOWARDS A COMMON VISION
The Alps 2050
Atlas
ALPS 2050
COMMON SPATIAL PERSPECTIVES FOR THE ALPINE AREA.
TOWARDS A COMMON VISION
Authors
Tobias Chilla, Anna Heugel – University of Erlangen (Germany), Leadpartner
Thomas Streifeneder, Elisa Ravazzoli, Peter Laner, Francesca Teston, Ulrike Tappeiner, Lukas Egarter – EURAC Research Bolzano (Italy)
Thomas Dax, Ingrid Machold – Federal Institute for Less Favoured and Mountainous Areas BABF Vienna (Austria) Marco Pütz – WSL Birmensdorf / Zürich (Switzerland)
Naja Marot – University of Ljubljana (Slovenia) Jean-François Ruault – IRSTEA Grenoble (France) Advisory Group
Katharina Erdmenger, Romana Mynarikova, Jens Staats - Federal Ministry of the Interior, Building and Community (Germany);
Vera Bornemann, Permanent Secretariat of the Alpine Convention, Innsbruck, Austria; Silvia Jost, Federal Office for Spatial Development, Switzerland;
Michael Roth, Federal Ministry for Sustainability and Tourism, Department VII/5, Coordination, Spatial Planning and Regional Policy, Austria;
Lenca Humerca-Šolar, Ministry of the Environment and Spatial Planning, Directorate for Spatial Planning, Construction and Housing, Slovenia;
Nicolas Gouvernel, General Commission for Territorial Equality, Unit Building Territorial Development Capacities, France;
Henrik Caduff, Office of Construction and Infrastructure, Liechtenstein;
Francesco Tulipano, Ministry for Infrastructure and Transport, Division Territorial Development, Planning and International Projects, Italy.
Technical Support
Manuela Burkert (survey implementation), Dominik Bertram, Cornelia Müller, Anja Sperr, Maren Teufel (data management and cartography) – University of Erlangen (Germany)
ESPON EGTC
Michaela Gensheimer (Senior Project Expert), Johannes Kiersch (Financial Expert) Piera Petruzzi (Senior Project Expert - Outreach), Laurent Friederes (Head of Unit Evidence & Outreach), Ilona Raugze (Director)
Editorial team
This publication is based on results of the ESPON ALPS 2050 project. The information and views set out here are those of the authors and do not necessarily reflect the official opinion of the European Union and the ESPON 2020 Monitoring Committee.
Information about ESPON can be found at www.espon.eu. ISBN 978-99959-55-66-3
Luxembourg, 2019
Table of contents
1 Introduction . . . . 9
1.1 The Alps 2050 Atlas . . . 9
1.2 Spatial focus: Perimeters and topography . . . 10
2 Settlement system . . . . 12
3 Services of General Interest . . . . 15
4 Demography . . . . 19
4.1 Population change . . . 19
4.2 Population density . . . 23
4.3 Population change and the urban-rural differentiation . . . 24
4.4 Ageing index . . . 26
4.5 Women between 25 and 35 . . . 27
4.6 Natural change and migratory dynamics . . . 28
5 Economy . . . . 32
5.1 Economic strength and disparities . . . 32
5.2 Regional disparities . . . 35
5.3 Labour and employment . . . 36
5.4 Innovation . . . 39
5.5 Tourism . . . 41
6 Ecology and ecosystem services . . . . 44
6.1 Protected areas . . . 44 6.2 Soil sealing . . . 45 6.3 Eco-system services . . . 48 7 Energy . . . . 50 8 Climate Change . . . . 53 9 Transport . . . . 57
10 The European perspective on the Alps . . . . 62
11 Governance . . . . 64
11.1Domestic level . . . 64
11.2Transnational level . . . 69
11.3Cross-border level . . . 70
List of Figures
Fig. 1 Population change 2001-2010 based on the DEGURBA classification, LAU level 24 Fig. 2 Population change 2001-2010 comparing urban and rural spaces – on the left hand
side for the pre-Alpine areas, on the right hand side for the inner-Alpine areas 25 Fig. 3 GDP change on regional level – comparing pre- and inner-Alpine districts 34 Fig. 4 GDP change on regional level – comparing districts of different national affiliation 34 Fig. 5 Change of labour force in the agricultural sector on regional level – comparing pre-
and inner-Alpine districts 38 Fig. 6 Change of labour force in agricultural sector on regional level – comparing districts of
different national affiliation 38 Fig. 7 Economic strength and potential for renewable energy on regional level –
differentiating urban and rural territories 52 Fig. 8 Adaptive capacity to climate change and economic strength on regional level
– differentiating urban and rural territories 56 Fig. 9 Adaptive capacity to climate change and economic strength on regional level
– differentiating national affiliations 56 Fig. 10 Development of transalpine traffic flows 2000-2014 – road vs. rail 59 Fig. 11 Development of transalpine traffic flows 2000-2014 – transit vs. regional flows 60 Fig. 12 Comparing Alps, Pyrenees and Apennines with regard to population and GDP 62 Fig. 13 Institutional mapping of the domestic contexts: country size, Alpine share, and
planning typology 64
List of Maps
Map 1 Spatial focus and political perimeters of the Alps 2050 space 10 Map 2 The Alpine mountains in the Alps 2050 perimeter 10 Map 3 Settlement system – Population size of municipalities 12 Map 4 Urban and rural areas following the DEGURBA approach 14 Map 5 Travel time to doctors by car 16 Map 6 Travel time to primary schools by car 17 Map 7 Travel time to train stations by car 18 Map 8 Population change 2010-2015 on municipal level 19 Map 9 Population change 2001-2010 on municipal level 20 Map 10 Population change 2001-2010 on municipal level in Europe 21 Map 11 Population density – in area proportional mapping (left hand side) and population
proportional mapping (right hand side) 23 Map 12 Ageing index 2015 on municipal level 26 Map 13 Women between 25 and 35 2017 27
Map 14 Net natural change 2011-2015 28 Map 15 Net migration 2011-2015 29 Map 16 Population change and the role of migration and natural change 2011-2015 30 Map 17 Share of foreign residents 2015 31 Map 18 GDP per capita 2014 32 Map 19 GDP change 2008-2014 33 Map 20 Employment change 2008-2014 36 Map 21 Share of labour force in agricultural sector 2014 37 Map 22 Patent applications per mio. inhabitants 2012 39 Map 23 Tourism intensity 2015 – overnight stays per 100 inhabitants 41 Map 24 Tourism capacity 2015 – bedplaces per 100 inhabitants 42 Map 25 Bedplaces change 2001-2010 43 Map 26 Protected areas 44 Map 27 Soil sealing 2012 45 Map 28 Soil sealing changes 2009-2012 47 Map 29 Eco-system services – Leisure demand and supply 48 Map 30 Eco-system services – Demand and supply of surface water 49 Map 31 Technical potential of renewable energy resources 50 Map 32 Hydropower potential 51 Map 33 Overall adaptive capacity to climate change 53 Map 34 Projected change of air temperatures until 2100 54 Map 35 Development of transalpine traffic flows 2006-2016 57 Map 36 Development of transalpine freight traffic flows 2000-2014 58 Map 37 Metropolitan linkages considering rail passenger transport - quality of rail
infrastructure linking the pre-Alpine metropolises 61 Map 38 Mountain areas in Europe following the ESPON typologies project 63 Map 39 Transnational cooperations and macroregional strategies 69 Map 40 Cross-border and international cooperations 70 Map 41 Agriculture and Tourism capacity 71 Map 42 Patents and Population change 72 Map 43 Environmental change – combining Energy potential and Adaptive capacity to
climate change 73 Map 44 Cluster analysis on the basis of the indicators population change 2011-2015,
List of Tables
Tab. 1 Population change 2001-2015 comparing the inner- and pre-Alpine area 22 Tab. 2 Population change 2001-2015 comparing urban areas, towns and suburbs and rural
areas based on the DEGURBA classification 22 Tab. 3 Population change 2001-2015 differentiated by national affiliation 23 Tab. 4 Development of regional disparities 2008-14: variation coefficient in % (NUTS 3) 35 Tab. 5 Characteristics of the planning system on the national level 65 Tab. 6 Characteristics of the planning system on the regional level 67
Abbreviations
AC Alpine Convention
ALCOTRA Alpes Latines Coopération Transfrontalière
ARGE ALP Arbeitsgemeinschaft Alpenländer (ital. Comunità di Lavoro delle Regioni Alpine) ARPAF Alpine Region Preparatory Action Fund
ASP Alpine Space Programme
CGET Commissariat général à l’égalité des territoires (engl. General Commissariat for
Territorial Equality)
CNM Mountain National Council DEGURBA Degree of Urbanisation
EEA European Environment Agency
EGTC European Grouping Of Territorial Cooperation
EPO European Patent Office
ESPON European Territorial Observatory Netwrk
EU European Union
EUSALP EU Strategy for the Alpine Region
GDP Gross Domestic Product
JRC Joint Research Centre
IPCC Intergovernmental Panel on Climate Change IUCN International Union for Conservation of Nature
LAU Local Administrative Unit
LEADER Liaison Entre Actions de Développement de l’Économie Rurale (engl. Links between actions for the development of the rural economy)
NACE Nomenclature statistique des activités économiques dans la Communauté européenne (engl. Statistical Classification of Economic Activities in the European Community)
NGO Non Governmental Organisation
NUTS Nomenclature des unités territoriales statistiques (engl. Nomenclature of Territorial Units for Statistics)
OECD Organisation for Economic Co-operation and Development
OSM OpenStreetMap
PPS Power Purchasing Standard
PROFECY Processes, Features and Cycles of Inner Peripheries in Europe SCI Special Conservation Interest
SGI Services of General Interest
SPA Special Protection Area
SRES Special Report on Emissions Scenarios TCP Territorial Cooperation Programme
1
Introduction
1 .1
The Alps 2050 Atlas
This atlas is part of the ESPON project Alps 2050 that develops spatial visions and perspectives for the Alpine region towards the year 2050. The spatial perimeter goes beyond the Alps in the morphological sense (which is mostly congruent with the Alpine Convention perimeter) but also considers the Territorial Cooperation Programme Alpine Space and the Macro-regional strategy EUSALP.
The Atlas brings together the relevant maps from the project that show structures, patterns and trends that contextualise the spatial development. Firstly, this atlas serves analytical purposes and gives background information for the Alps 2050 main report, and secondly, provides general visualisation, orientation and inspiration.
Obviously, the selected set of maps cannot cover all relevant themes in a perfectly balanced way. The availability of meaningful data that covers the transnational area adequately on selected territorial levels is clearly a limiting factor. But still, we think that visualising the existing data helps to fuel the debate on territorial development in the Alps.
The main impressions from the Atlas can be summarised in the following bullet points:
• Territorial development in the Alpine Region is characterised by diversity and complexity.
Comparing the different thematic maps reveals very different pictures: Sometimes underlining the relevance of the morphological context, sometimes stressing the contrast between urban and rural areas, sometimes revealing differences between North and South or East and West. • The complexity underlines the postulate of contingency: spatial development is not necessarily
determined by mountains and morphology, but spatial development is a political process open for political struggles, societal debates and democratic decisions.
• Aiming at tailor made territorial strategies means to carefully consider this complexity on the ground, considering parallels and differences. From a transnational perspective, the parallels
can be perceived as common challenges that stand in the heart of macro-regional strategy implementation. At the same time, regional and national differences can be a potential for diversity, best developed on political levels of the European multi-level system in subsidiarity. • The Alpine region certainly is a very dynamic region offering multiple opportunities for future
development without focussing solely on growth dynamic.
For those who like to refer to cartographic reflections on the Alps, we should mention here two other interesting works that are presenting indicators for the Alpine Convention perimeter, namely the ‘Alpine convention Vademecum’ (Alpine Convention 20101) and ‘The Alps in 25 maps’ publication
(Alpine Convention 2018 2).
1 http://www.alpconv.org/en/publications/alpine/Documents/Vademecum_web.pdf 2 http://www.alpconv.org/en/publications/alpine/Documents/25maps.pdf
1 .2
Spatial focus: Perimeters and topography
Linz Wien Bern Graz Vaduz Verona Milano Zürich Genève Monaco Bolzano München Venezia Grenoble Nürnberg Innsbruck Marseille Ljubljana Stuttgart 100 kmTerritorial level: NUTS0 (2013) Source: FAU & Eurac Research, Alps 2050, 2018 Origin of Data: European Commission, Alpine Space Programme, Eurac Research EuroGeographics for the cities University of Geneva for administrative boundaries © ESPON, 2018
Spatial Focus Alps 2050
INTERREG Alpine Space
EUSALP Alpine Convention
Map 1 Spatial focus and political perimeters of the Alps 2050 space
IT FR DE AT CZ CH HR SI BE BA HU SK LU PL LI 100 km
Territorial level: Grid / LAU 2 (2011) / NUTS 0 Source: FAU, Alps 2050, 2018 Origin of Data: Swiss National Park, 2018 EuroGeographics for the cities University of Geneva for administrative boundaries © ESPON 2018
Altitude/Topography Index
INTERREG Alpine Space
Alpine Convention
EUSALP
high morphology following Altitude/Topography index by Swiss National Park
The maps (Map 1 and Map 2) show the perimeters that are relevant for the Alps 2050 project, namely
• The Alpine Convention (AC, signed in 1991) whose perimeter has been aligned on municipal
level based mainly on morphological arguments, i.e. that the perimeter marks the mountainous parts. In this report, this part will be named the inner-Alpine area.
• The INTERREG Alpine Space Programme started in 2000 and is now running in the fifth period
2014-20. Its perimeter goes far beyond the mountain area and also includes the surrounding metropoles and ‘hinterland’.
• The macro-region EUSALP (launched only in 2016) is similar but not identical with the ASP
space. The areas of the ASP and EUSALP perimeter that go beyond the Alpine Convention space will be named pre-Alpine areas in this report. Its delimitation is based on the regional level.
The perimeters are not trivial, in particular due to territorial reforms on the French side: Recent reforms have changed the political geography, and this will lead most probably to a larger territory in the Western EUSALP and Alpine Space. For the time being, the perimeter of the Alpine Space period 2014-20 (http://www.alpine-space.eu/about/the-programme/which-area-is-covered) and the EUSALP perimeter as defined in the official communication from the European Commission (COM 2015/366 final, p. 11) serve as the spatial focus of this ESPON project.
Moreover, Map 1 and Map 2 display the national borders of the states involved. The numerous national borders which can challenge a harmonious, cohesive and sustainable development.
2
Settlement system
Map 3 Settlement system – Population size of municipalities
Indicator/Methodology: Map 3 shows the size of the municipalities in the year 2010. The number
of inhabitants per community is assigned to one of the seven size categories, differentiated by size and colour of the symbols. – One has to stress that the administrative LAU area is not identical with physical settlement areas. The fact that municipality sizes are not harmonised has consequences for the interpretation of such maps: the larger the administrative municipality, the less exact is the impression of the settlement system: For example, the role of valleys is less visible and the impression of polycentricity can be misleading as dispersed settlements are part of just one formal municipality, as we can see in particular when comparing the French and Slovenian situation. In Slovenia the settlement pattern with around 6,000 settlements is much more dispersed than the map which shows municipalities illustrates. Moreover, the different mandates on the municipal level have to be considered – e.g. the “communauté de communes” in France or “Verwaltungsgemeinschaft” in Germany are very different forms of inter-municipal institutionalization.
Linz Wien Bern Graz Vaduz Verona Milano Zürich Genève Monaco Bolzano München Venezia Grenoble Nürnberg Innsbruck Marseille Ljubljana Stuttgart 100 km
Territorial level: LAU2 (2011)/NUTS0 Source: Eurac Research & FAU, Alps 2050, 2018 Origin of Data: Eurostat & National Statistical Offices, 2013 EuroGeographics for the cities University of Geneva for administrative boundaries Outer perimeter: EUSALP & ASP Alpine Convention
© ESPON, 2018
Settlement system
Vaduz
Number of inhabitants per municipality (2010)
1 - 2.500 > 2.500 - 5.000 > 5.000 - 10.000 > 10.000 - 50.000 > 50.000 - 100.000 > 100.000 - 1.000.000 > 1.000.000 - 1.714.142
Description: The settlement system of the Alps 2050 perimeter shows the following patterns and characteristics:
• Within the Alpine Convention perimeter, the size of municipalities tends to be much lower than beyond; and also the number of municipalities within a certain area tends to be lower in the mountainous area than in the pre-Alpine area.
• The map shows the importance of valleys for settlements, in particular the Inn valley (East of Innsbruck), the Rhine valley (North and South of Liechtenstein), the Isère valley (between Genève and Grenoble), the Sava and Soca valleys in Slovenia, the Po valley (from Milano eastwards) etc.
• The map illustrates the relevance of different political and administrative contexts: The average size of municipalities – for example – is clearly larger in Slovenia (96 km2, 2018) than in France.
• The map clearly displays the importance of the Alpine morphology: the higher the mountains and narrower the valleys, the smaller the settlements.
Despite all the differences between national and regional contexts, there are obvious parallels in the settlement system – the relevance of the morphological structure in the inner Alpine area, and the agglomeration ring all around the mountainous area. As macro-regional strategies are about common challenges and opportunities, the settlement system could be an obvious issue. It might be meaningful to debate transnational instruments for the development of settlement systems that support synergies across borders.
Indicator/Methodology: Map 4 shows the typology of the Commission’s Directorates-General for
Regional and Urban Policy, Agriculture and Rural Development, Eurostat and the Joint Research Centre (JRC) together with the OECD (http://ec.europa.eu/eurostat/web/degree-of-urbanisation/ methodology). The so called DEGURBA methodology classifies Local Administrative Units level (LAU or communes) based on a combination of criteria of geographical contiguity and minimum population threshold applied to 1 km2 population grid cells that are aggregated on LAU-level. The
classification is elaborated as follows:
• Cities (alternate name: densely populated areas): At least 50% of the population lives in urban
centres (with a high population density).
• Towns and suburbs (alternate name: intermediate density areas): At least 50% of the population
lives in urban clusters and less than 50% of the population lives in urban centres.
• Rural areas (alternate name: thinly populated areas): At least 50% of the population lives in
rural grid cells.
Description: Also this map shows differences between the largely rural inner-Alpine areas and the
much more urbanised pre-Alpine areas. However, the picture is less dichotomic than the settlement system in the map before. In particular, the rural character of many regions beyond the mountainous parts is very clearly visible (e.g. French and Bavarian parts). It gets also clear that the Alps 2050 perimeter comprises a ring of metropolises of European relevance, surrounding the mountainous area.
The map shows the importance of spatial reflections on a fine scale: It does make sense to argue on the LAU or NUTS 3 level and not to refer to NUTS 2 too often which is, however, often the case when debating European spatial patterns.
Linz Wien Bern Graz Vaduz Verona Milano Zürich Genève Monaco Bolzano München Venezia Grenoble Nürnberg Innsbruck Marseille Ljubljana Stuttgart 100 km
Territorial level: LAU2 (2011) Source: Eurac Research & FAU, Alps 2050, 2018 Origin of Data: Eurostat & National Statistical Offices, 2013 EuroGeographics for the cities University of Geneva for administrative boundaries Outer perimeter: EUSALP & ASP Alpine Convention
© ESPON, 2018
Urban and rural areas
DEGURBA
cities
towns and suburbs rural areas no data
FUA
FUA
3
Services of General Interest
The analysis of the accessibility of Services of General Interest (SGI) were developed in the framework of the ESPON project PROFECY by TCP International and is described in detail in the PROFECY project report’s annexes. PROFECY identified OpenStreetMap(OSM) as the major data source for locations of SGIs, partly amended by national data sources; the train stations were based on an internal project data base. The accessibility of SGIs was calculated as the car travel time from the centre of each grid cell (resolution 2.5 x 2.5 km) to the next facility, regardless if the grid area is inhabited or not. Depending on the SGI type, only facilities within the same country as the origin grid cell were considered as destinations (in case of public services such as schools and health care), or domestic facilities and facilities in the neighbouring country (in case of private services such as shops, cinemas and also for the train stations). Grid travel times were also aggregated to LAU level by averaging the travel times of all grid cells belonging to one LAU unit. The assignment of grid cells to LAU units was based upon the location of the centre of the grid cell.
In this methodology, the different size of municipalities matters. The larger the municipality, the more generalised is the cartographic picture that can hide small scale morphological contexts. The picture has to be relativised as very negative values often concern only few inhabitants. It makes sense to read this map in parallel to the population density map (Map 11) and the settlement system map (Map 3). Moreover, one might state that the Slovene situation might be better than indicated in the map, due to the relatively large size of the municipal territories.
Linz Wien Bern Graz Vaduz Verona Milano Zürich Genève Monaco Bolzano München Venezia Grenoble Nürnberg Innsbruck Marseille Ljubljana Stuttgart 100 km
Territorial level: LAU2 (2011) Source: TCP & FAU, Alps 2050, 2018 Origin of Data: ESPON Profecy, 2017 EuroGeographics for the cities University of Geneva for administrative boundaries Outer perimeter: EUSALP & ASP Alpine Convention
© ESPON, 2018
Travel time to doctors by car
Travel Time by car in minutes
0 - 5 > 5 - 10 > 10 - 20 > 20 - 40 > 40 - 132 Vaduz
Map 5 Travel time to doctors by car
Indicator/Methodology: Map 5 is based on the calculation of travel time to general doctors by car.
The darker the colour is, the more time it takes within the respective municipality to reach the next doctor. The calculation takes into account that the nearest doctor might be in a neighbouring municipality. The OSM data refer to the service facility “doctors” with the OSM type 2120.
Description: The overall picture very clearly shows the role of the morphology: The accessibility
is much easier in pre-Alpine areas than in inner- Alpine areas. This can obviously be explained by a) the lower population density in mountainous areas that lead to a lower density of medical services and b) to the difficulties to ensure a good technical accessibility in mountainous areas, due to expensive and complex infrastructure issues (tunnels, natural risks etc.). This situation can be observed almost independent from national affiliation, with the exception of Slovenia where in consequence of the big municipality size the picture is not that differentiated. Longer distances caused by the bigger municipality size lead to higher values for the whole municipality.
Linz Wien Bern Graz Vaduz Verona Milano Zürich Genève Monaco Bolzano München Venezia Grenoble Nürnberg Innsbruck Marseille Ljubljana Stuttgart 100 km
Territorial level: LAU2 (2011) Source: TCP & FAU, Alps 2050, 2018 Origin of Data: ESPON Profecy, 2017 EuroGeographics for the cities University of Geneva for administrative boundaries Outer perimeter: EUSALP & ASP Alpine Convention
© ESPON, 2018
Travel time to primary schools by car
Travel Time by car in minutes
0 - 5 > 5 - 10 > 10 - 20 > 20 - 40 > 40 - 71 Vaduz
Map 6 Travel time to primary schools by car
Indicator/Methodology: Map 6 is based on the calculation of travel time to primary school by car. The
map shows values for the municipality level (LAU) that are aggregated from grid data. The darker the colour is, the more time it takes within the respective municipality to reach the next primary school. The classification differentiating the five categories is the same as for doctors. The calculation takes into account that the nearest primary school might be in a neighbouring municipality. The OSM data refer to the service facility “primary schools” with the OSM type 2082.
Description: The explanation is parallel to the accessibility of doctors – the overall picture very clearly
shows the role of the morphology also in this case: The accessibility is much easier in pre-Alpine areas than in the mountainous areas. However, the picture is slightly ‘brighter’ (more yellow/orange colours). This means that the density of primary schools is higher than the density of doctors.
Linz Wien Bern Graz Vaduz Verona Milano Zürich Genève Monaco Bolzano München Venezia Grenoble Nürnberg Innsbruck Marseille Ljubljana Stuttgart 100 km
Territorial level: LAU2 (2011 updated) Source: TCP & FAU, Alps 2050, 2018 Origin of Data: ESPON Profecy, 2017 EuroGeographics for the cities University of Geneva for administrative boundaries Outer perimeter: EUSALP & ASP Alpine Convention
© ESPON, 2018
Travel time to train stations by car
Travel time by car in minutes
0 - 5 > 5 - 10 > 10 - 20 > 20 - 40 > 40 - 129 Vaduz
Map 7 Travel time to train stations by car
Indicator/Methodology: Also this data behind Map 7 were developed in the framework of the ESPON
project PROFECY by TCP International – the same information apply as for the two maps above: The map is based on the calculation of travel time to train stations by car. The map shows values for the municipality level (LAU) that are aggregated from grid data. The darker the colour is, the more time it takes within the respective municipality to reach the next primary school. The calculation takes into account that the nearest train station might be in a neighbouring municipality. The classification of the data (legend) is the same in the two cases introduced above.
Description: In principle, most of the comments from the above introduced cases also apply in this
case. However, there are two specific arguments:
• The spatial pattern shows more clearly the morphology, in particular the valleys that host the rail infrastructure.
• The large net structure of train railway stations is less densely organised than primary schools and doctors.
4
Demography
4 .1
Population change
Linz Wien Bern Graz Vaduz Verona Milano Zürich Genève Monaco Bolzano München Venezia Grenoble Nürnberg Innsbruck Marseille Ljubljana Stuttgart 100 kmTerritorial level: LAU2 (2011 updated) Source: Eurac Research & FAU, Alps 2050, 2018 Origin of Data: Eurostat & National Statistical Offices, 2013 EuroGeographics for the cities University of Geneva for administrative boundaries Outer perimeter: EUSALP & ASP Alpine Convention © ESPON, 2018 Population change 2010-2015 Vaduz Population change in % ≤ -10 > -10 - -5 > -5 - 0 > 0 - 5 > 5 - 10 > 10 - 25 > 25 unincorporated area no data
Map 8 Population change 2010-2015 on municipal level
Indicator/Methodology: Map 8 shows the demographic trend between 2010 and 2015 on
municipality level (LAU): Summarising the different demographic components of in-/outmigration over municipality borders as well as childbirths and deaths, the overall demographic trend can be positive (considered as population growth) or negative (population loss): The darker the colour red is, the stronger is the overall positive trend; the darker the colour blue, the more negative is the trend. NB: The categories comprise different ranges of values (e.g. 0-5% and 25-100%), but they comprise a comparable number of cases.
Description: The overall picture clearly shows the important influence of the degree of urbanisation:
In the observed period, metropolises and the larger cities are almost always the centre of population increase, whereas the patterns in the rural areas are much more diverse: For example, the Southern Tyrol area is demographically developing much more positive then the Belluno region. The difference
is large between the Alpine countries: The differences are obvious e.g. along the French-Italian and the German-Swiss side. Moreover, the particular development paths of corridors are obvious, in particular for the Inn Valley, the High Rhine Valley, Slovenian motorway cross and most of all the Brenner corridor.
Different to the settlement system map, the picture does not primarily reproduce the differences between mountainous and non-mountainous regions. Instead, the diversity of rural spaces and the large scale influence of metropolitan ‘growth poles’ leads to a much more complex picture.
Linz Wien Bern Graz Vaduz Verona Milano Zürich Genève Monaco Bolzano München Venezia Grenoble Nürnberg Innsbruck Marseille Ljubljana Stuttgart 100 km
Territorial level: LAU2 (2011) Source: Eurac Research & FAU, Alps 2050, 2018 Origin of Data: Euostat & National Statistical Offices, 2013 EuroGeographics for the cities University of Geneva for administrative boundaries Outer perimeter: EUSALP & ASP Alpine Convention © ESPON, 2018 Population change 2001-2010 Vaduz Population change in % ≤ -25 > -25 - -10 > -10 - -5 > -5 - 0 unincorporated area no data > 0 - 5 > 5 - 10 > 10 - 25 > 25 - 100 > 100
Map 9 Population change 2001-2010 on municipal level
Indicator/Methodology: The indicator in Map 9 is the same as in the map shown above, but refers to
an earlier period of time, namely 2001-10.
Description: The general trends are similar to the more recent trends described above for the years
Swiss regions. In contrary, the Po Valley in Italy shows very different and much more negative values. The patterns on the French side are now much more diverse than before. In Slovenia, the positive trend of population growth can be identified in the urban and suburban areas and along the motorway, while the mountainous, border and remote areas are clearly loosing population.
Map 10 Population change 2001-2010 on municipal level in Europe
Indicator/Methodology: see above, Map 9 (further information:
http://regdev-blog.eurac.edu/wp-content/uploads/Demographic-change-Europe-Municipalities-map.jpg)
scale. The overall picture underlines the diversity of developments and the comparable positive trend. When negative trends are visible they show more small scale patterns than in other parts of Europe (e.g. Iberian Peninsula, South-Eastern Europe). As already mentioned above, the positive trend in metropolitan regions and the diversity of rural development parts is visible – and can also be found in many other European regions. The demographic development in the Alps, thus, mirrors the demographic trends that can be found European wide.
Indicator/Methodology: Tab. 1 to Tab. 3 show the same indicator as Map 8 and Map 9 and refer to
the period 2001-2015. The municipal data are summed up following different classifications: • Tab. 1 differentiates between the inner-Alpine area (all municipalities that are part of the Alpine
Convention area) and the pre-Alpine area (all municipalities that are part of the Alps 2050 perimeter and lie beyond the Alpine Convention perimeter) (cf. Map 1)
• Tab. 2 differentiates between urban areas, towns and suburbs, rural areas following the DEGURBA classification (cf. Map 4).
• Tab. 3 differentiates the municipalities that are part of the Alps 2050 space by national affiliation.
Tab. 1 Population change 2001-2015 comparing the inner- and pre-Alpine area
Population Change 2001-2015 Change 2001-2010 Change 2010-2015
Alps 2050 + 7,8% + 5,4% + 2,3%
Inner-Alpine + 7,8% + 6,1% + 1,6%
Pre-Alpine + 7,8% + 5,2% + 2,5%
Description: In the period 2001-2015, the population change is positive and the growth rate is the
same in all three spatial categories (all +7,8%). Also when differentiating the decades, the overall trend is positive for all areas. Between 2001 and 2010, the growth rate of the inner-Alpine area is higher than in the Alps 2050 space and in the pre-Alpine area. This is different between 2010 and 2015 – in this period the growth rate of the pre-Alpine area is higher than in the inner-Alpine area.
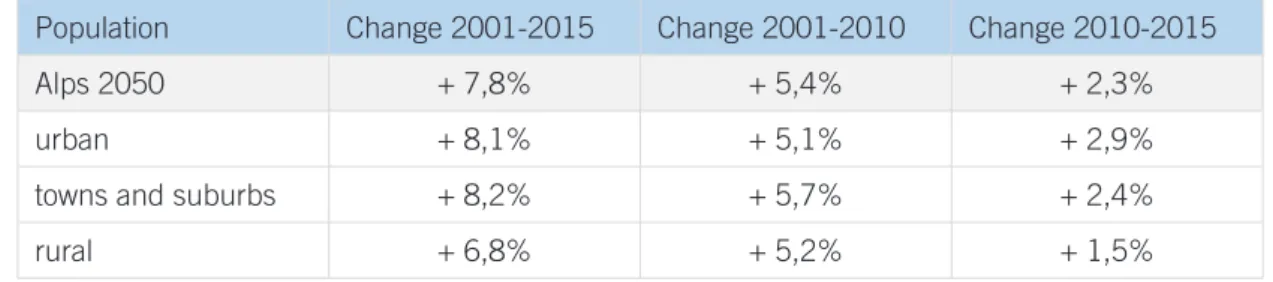
Tab. 2 Population change 2001-2015 comparing urban areas, towns and suburbs and rural
areas based on the DEGURBA classification
Population Change 2001-2015 Change 2001-2010 Change 2010-2015
Alps 2050 + 7,8% + 5,4% + 2,3%
urban + 8,1% + 5,1% + 2,9%
towns and suburbs + 8,2% + 5,7% + 2,4%
rural + 6,8% + 5,2% + 1,5%
Description: Differentiating the Alps 2050 area following the DEGURBA classification, the population
growth in urban areas and towns and suburbs between 2001 and 2015 is nearly the same. The growth rate in rural areas is also highly positive but lies under the growth rate of the urban areas. The same applies in the temporal differentiation.
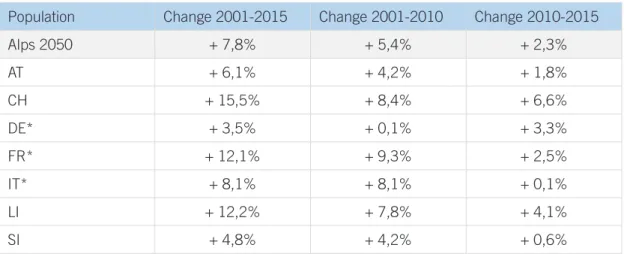
Tab. 3 Population change 2001-2015 differentiated by national affiliation
Population Change 2001-2015 Change 2001-2010 Change 2010-2015
Alps 2050 + 7,8% + 5,4% + 2,3% AT + 6,1% + 4,2% + 1,8% CH + 15,5% + 8,4% + 6,6% DE* + 3,5% + 0,1% + 3,3% FR* + 12,1% + 9,3% + 2,5% IT* + 8,1% + 8,1% + 0,1% LI + 12,2% + 7,8% + 4,1% SI + 4,8% + 4,2% + 0,6%
*parts that belong to the Alps2050 perimeter
Description: Differentiating the population change by national affiliation (Tab. 3), there are obviously
more differences than in Tab. 1 and Tab. 2. In the period 2001-2015, the German parts and Slovenia show growth rates under 5 %, whilst Switzerland, the French parts and Liechtenstein lie clearly over 10 percent. Whereas the trends in Switzerland and Liechtenstein show high growth rates over periods, the German parts had nearly no change between 2001 and 2010 and show a crucial increase of the growth rate after 2010. In contrast, the French and the Italian parts as well as Slovenia show rather high growth rates between 2001 and 2010 and a decline of the rates after 2010.
4 .2
Population density
100 km 100 km Population density 2015 (Inhabitants/km²) ≤ 100 > 100 - 150 > 150 - 200 > 200 - 250 > 250 - 500 > 500 Population density 2015 (Inhabitants/km²) ≤ 100 > 100 - 150 > 150 - 200 > 200 - 250 > 250 - 500 > 500 © ESPON, 2018Territorial level: NUTS 3 (2013) Source: FAU & Eurac Research, Alps 2050, 2018 Origin of data: Eurostat & National Statistical Offices, 2018 EuroGeographics for the cities University of Geneva for administrative boundaries
Population density
Area
proportional map Population proportional map
Map 11 Population density – in area proportional mapping (left hand side) and population proportional mapping (right hand side)
Indicator/Methodology: Map 11 shows the population density on NUTS 3 level – on the left hand side proportional to the surface area (classical cartographic representation), on the right hand side a cartogram using the Gastner-Newman method. In the latter map, the size of the territories is relative to the population (number of inhabitants) of the territories.
Description: This cartographic tool underlines the large differences in demographic patterns within
the Alps 2050 perimeter. The mountainous areas almost ‘disappear’ due to their low population density, the urbanised and metropolitan territories of the pre-Alpine space literally ‘blow up’. The right hand map is somehow the caricature of the ‘metropolitan view on the Alps’.
4 .3
Population change and the urban-rural differentiation
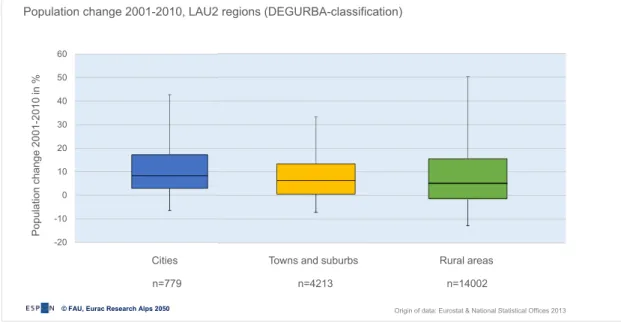
Indicator/Methodology: The visualisation of Fig. 1 and Fig. 2 are so-called box plots. This kind of
visualisation differentiates the quartiles of the values of population change on municipality level for different spatial categorisations. For example, the blue box in Fig. 1 shows the second and third quartile of the population change values for the cities, and the line separating them shows the median value. The vertical line above shows the top quartile, the line below the quartile with the lowest values. The analyses are based on municipal level that are aggregated by different dimensions. The main idea is to confront urban and rural spaces and inner- and pre-Alpine spaces. The graphic is based on the same data as Map 9 (population change 2001-2010).
Population
change
2001-2010
in %
Cities Towns and suburbs Rural areas Population change 2001-2010, LAU2 regions (DEGURBA-classification)
-20 -10 0 10 20 30 40 50 60 n=14002 n=4213 n=779
© FAU, Eurac Research Alps 2050 Origin of data: Eurostat & National Statistical Offices 2013
Fig. 1 Population change 2001-2010 based on the DEGURBA classification, LAU level
Description:Fig. 1 compares the population development in cities, towns/suburbs and rural areas
(DEGURBA classification cf. Map 4). The population development is positive in (more than) three quartiles in the categories cities and towns/suburbs, a bit less in the rural municipalities. The range is much higher in rural areas than in the former two categories. The median shows the highest value for the city category (8,3%) and lower values for the suburban (6,3%) and rural (4,9%) communes.
-20 -10 0 10 20 30 40 50 60 Population change 2001-2010 in %
Cities, towns and suburbs Rural
n=3492 n=9443
Cities, towns and suburbs Rural
n=1200 n=4559
Inner-Alpine areas (Alpine Convention areas, DEGURBA-classification)
Pre-Alpine areas (EUSALP areas beyond the Alpine Convention perimeter, DEGURBA-classification) Population change 2001-2010, LAU2 regions
© FAU, Eurac Research Alps 2050 Origin of data: Eurostat & National Statistical Offices 2013
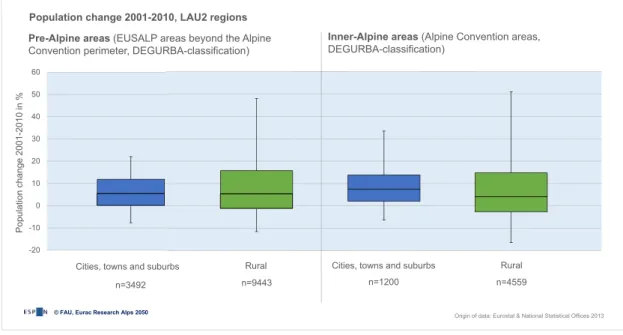
Fig. 2 Population change 2001-2010 comparing urban and rural spaces – on the left hand side
for the pre-Alpine areas, on the right hand side for the inner-Alpine areas
Description: Fig. 2 is more complex: firstly, the categories ‘cities’ and ‘towns and suburbs’ are
merged and confronted to the rural category. On the left hand side, we see the values for the inner-Alpine, mountainous areas; on the right hand side the values for the pre-Alpine areas of the project perimeter. On both sides, we see the higher diversity of development in the rural areas, and the overall more positive development in the urban category. The urban development tends to be stronger in the inner-Alpine areas than in the pre-Alpine areas. This shows a slightly stronger trend of urbanisation in this space. The rural spaces are developing slightly more diverse and less positive in the inner-Alpine than in the pre-Alpine space.
4 .4
Ageing index
Linz Wien Bern Graz Vaduz Verona Milano Zürich Genève Monaco Bolzano München Venezia Grenoble Nürnberg Innsbruck Marseille Ljubljana Stuttgart 100 kmTerritorial level: LAU2 (2011 updated) Source: Eurac Research & FAU, Alps 2050, 2018 Origin of Data: National Statistical Offices, 2018 EuroGeographics for the cities University of Geneva for administrative boundaries Outer perimeter: EUSALP & ASP Alpine Convention
© ESPON, 2018
Ageing index 2015
Vaduz
Persons over 65 / Persons between 0-14 * 100
0 - 50 > 50 - 100 > 100 - 150 > 150 - 200 > 200 - 5100 no aging index unincorporated area no data
Map 12 Ageing index 2015 on municipal level
Indicator/Methodology:Map 12 shows the relation between the number of persons over 65 years
and the number of persons under 14 years old on municipality level.
Description: The overall pattern is similar to the other demographic indicators, and this is not by
chance: Those areas that have a strong immigration tends to be the ‘younger’ as young people are more mobile (migration due to education or career development reasons) and they have a higher probability to already have or get children. Those regions with the highest ageing index are in particular mountainous parts in almost all countries of the Alps 2050 perimeter, showing those regions that are not target regions of migration; also large parts of the Italian lowlands show a high ageing index. Urbanised regions and corridors tend to be younger, due to immigration (universities, labour market). If one takes this picture as an indicator for future development options, many regions in Italy, Southern Switzerland, parts of France and Inner Austria can be regarded as under pressure.
4 .5
Women between 25 and 35
Linz Wien Bern Graz Vaduz Verona Milano Zürich Genève Monaco Bolzano München Venezia Grenoble Nürnberg Innsbruck Marseille Ljubljana Stuttgart 100 kmTerritorial level: NUTS3 (2013) Source: Eurac Research & FAU, Alps 2050, 2018 Origin of Data: Eurostat, 2018 EuroGeographics for the cities University of Geneva for administrative boundaries Outer perimeter: EUSALP & ASP Alpine Convention
© ESPON 2018
Women between 25 and 35
Women between 25 and 35 in % of total population (2017)
4,3 - 5 > 5 - 6 > 6 - 7 > 7 - 8 > 8 - 10,4 Vaduz
Map 13 Women between 25 and 35 2017
Indicator/Methodology: Map 13 shows the share of female inhabitants in the age group between 25
and 35 on the NUTS 3 level. This indicator can be understood as a hint for the further demographic development: The over average share of this population group can be seen as indication for a positive natural demographic development in the coming years (number of births). This indicator is closely related with the demographic dynamic – the more immigration, the more women in the age group 25-35 years can be expected.
Description: The map shows that the highest values can be found in urban areas and in Switzerland,
Northern Austria and large parts of Slovenia. On this spatial scale (NUTS 3), the morphology seems not to play a dominant negative role. In most cases, the patterns reflect the degree of immigration in recent years.
4 .6
Natural change and migratory dynamics
Linz Wien Bern Graz Vaduz Verona Milano Zürich Genève Monaco Bolzano München Venezia Grenoble Nürnberg Innsbruck Marseille Ljubljana Stuttgart 100 kmTerritorial level: NUTS3 (2013) Source: Eurac Research & FAU, Alps 2050, 2018 Origin of Data: Eurostat, 2018 EuroGeographics for the cities University of Geneva for administrative boundaries Outer perimeter: EUSALP & ASP Alpine Convention
© ESPON 2018
Net natural change
Vaduz
Natural change per 1.000 inhabitants (2011-2015)
-8,8 - -4 > -4 - -2 > -2 - 0 > 0 - 2 > 2 - 4 > 4 - 6 > 6 - 7,8
Map 14 Net natural change 2011-2015
Indicator/Methodology: Map 14 shows the dynamic of the natural demographic development, which
means the number of births minus the number of deaths without considering in- and outmigration (on the NUTS 3 level for 2015).
Description: The map clearly shows that many parts of the Alps 2050 perimeter are characterised
by a negative natural change value – in most regions, the number of deaths is higher than the number of births. Exceptions from this trend are many urbanised areas, Switzerland, large parts on the French side and Slovenia except some border regions. Germany, Italy and East/Southern Austria show rather negative values. Those areas that show negative natural values depend to a high extent on the migration dynamics. One should put this map into perspective with regard to the following aspects:
• In general terms, natural dynamics are less important in quantitative terms: on the NUTS 3 level, the number of migrating people is far higher than the number of births and deaths. This is true for Europe as a whole.
• As for all maps, also here the question of scale applies: The NUTS 3 level hides in many cases larger differences on municipality level.
• The patterns of this map are similar to those in the map women between 25 and 35, cf. Map 13.
Linz Wien Bern Graz Vaduz Verona Milano Zürich Genève Monaco Bolzano München Venezia Grenoble Nürnberg Innsbruck Marseille Ljubljana Stuttgart 100 km
Territorial level: NUTS3 (2013) Source: Eurach Research & FAU, Alps 2050, 2018 Origin of Data: Eurostat, 2018 EuroGeographics for the cities University of Geneva for administrative boundaries Outer perimeter: EUSALP & ASP Alpine Convention
© ESPON 2018
Net migration
Vaduz
Net migration per 1.000 inhabitants (2011-2015)
-5,4 - -2 > -2 - 0 > 0 - 2 > 2 - 4 > 4 - 6 > 6 - 8 > 8 - 10 > 10 - 20,5
Map 15 Net migration 2011-2015
Indicator/Methodology: Map 15 shows the dynamic of the migration development, thus the number
of people moving in and out crossing the ‘borders’ of NUTS 3 regions, i.e. leaving or entering the districts of the Alps 2050 regions without considering births and deaths (for 2015).
Description: This map underlines that the Alps 2050 region is – overall speaking – an attracting
space as almost all NUTS 3 regions show a positive migration balance. The overall picture shows a certain North-South divide, but the role of metropolitan spaces is more dominant. The asylum seeking people are not included in a comprehensive manner (2015 was the year of the most important inmigration but only few of these persons were statistically registered).
Linz Wien Bern Graz Vaduz Verona Milano Zürich Genève Monaco Bolzano München Venezia Grenoble Nürnberg Innsbruck Marseille Ljubljana Stuttgart 100 km
Territorial level: NUTS3 (2013) Source: Eurac Research & FAU, Alps 2050, 2018 Origin of Data: Eurostat, 2018 EuroGeographics for the cities University of Geneva for administrative boundaries Outer perimeter: EUSALP & ASP Alpine Convention
© ESPON, 2018
Net population change 2011-2015
Positive change
Positive natural change, positive migration Negative natural change, positive migration Positive natural change, negative migration
Negative change
Positive natural change, negative migration Negative natural change, positive migration Negative natural change, negative migration
Vaduz
Map 16 Population change and the role of migration and natural change 2011-2015
Indicator/Methodology: Map 16 shows the population net change over the period 2011-15 on the
NUTS 3 level. The green colours indicate absolute growth, the red colours absolute loss. The colour intensity shows the different factors for the trend, i.e. if the growth/loss can be traced back to migration flows or to natural demographic development.
Description: The overall picture shows that the demographic development is very diverse over the
Alps 2050 perimeter. Positive developments in both migration and natural development can be found in most metropolitan areas, along the Brenner corridor (Innsbruck-Verona) and in almost all NUTS 3 regions in Switzerland. In principle, this map brings together the two maps presented before, illustrating the natural net development and the migration net development, so the above formulated comments also apply here.
Linz Wien Bern Graz Vaduz Verona Milano Zürich Genève Monaco Bolzano München Venezia Grenoble Nürnberg Innsbruck Marseille Ljubljana Stuttgart 100 km
Territorial level: NUTS3 (2013) Source: EURAC Research & FAU, Alps 2050, 2018 Origin of Data: Eurostat & National Statistical Offices, 2018 EuroGeographics for the cities University of Geneva for administrative boundaries Outer perimeter: EUSALP & ASP Alpine Convention
© ESPON 2018
Share of foreign residents
Foreign residents per total inhabitants 2015 (in %)
1,8 - 7,5 > 7,5 - 10,0 > 10,0 - 12,5 > 12,5 - 15,0 > 15,0 - 17,5 > 17,5 - 63,8 Vaduz
Map 17 Share of foreign residents 2015
Indicator/Methodology: Map 17 shows the share of foreign residents for 2015 on the NUTS 3 level
(defined by having a different nationality than the country of residence). The indicator comprises migrants from neighbouring Alpine countries as well as from any other international migration.
Description: Switzerland with its over-average economic growth in recent years (and decades) shows
the highest share of international inhabitants, followed by the economically successful parts of (mostly Northern) Austria. The rate of foreigners on the German side is linked to the presence of the (automotive) industry where migrant workers play traditionally an important role. In Slovenia, the higher percentage in the coastal region is due to the economic orientation of this area (port, logistics and tourism) strongly attracting foreign labour working.
One has to keep in mind that naturalisation conditions differ from one country to another (jus soli in France vs. more restrictive policies in Switzerland and Liechtenstein for instance), which partly influences the number of foreign residents.
5
Economy
5 .1
Economic strength and disparities
Linz Wien Bern Graz Vaduz Verona Milano Zürich Genève Monaco Bolzano München Venezia Grenoble Nürnberg Innsbruck Marseille Ljubljana Stuttgart 100 km
Territorial level: NUTS3 (2013) Source: FAU Alps 2050, 2018 Origin of Data: Eurostat, 2018 EuroGeographics for the cities University of Geneva for administrative boundaries Outer perimeter: EUSALP & ASP Alpine Convention © ESPON, 2018 GDP per capita GDP per capita in PPS (2014) 12.900 - 20.000 > 20.000 - 30.000 > 30.000 - 40.000 > 40.000 - 50.000 > 50.000 - 135.000 Vaduz
Map 18 GDP per capita 2014
Indicator/Methodology: Map 18 shows the Gross Domestic Product (GDP) that describes the
economic strength. The expression in power purchase standards (PPS) considers that the same nominal value of monetary units means different things in ‘rich’ and ‘poor’ regions. Both maps show values for the spatial level of NUTS 3. The values are calculated per inhabitant, not per worker which means enhanced values in small NUTS 3 regions (especially for the German “Kreisfreie Städte”) due to commuting flows.
Description: The values are most positive in urbanised and metropolitan regions. Moreover, we see a
certain North-South divide as regions in Germany, Switzerland and Austria are on a higher GDP per capita level than many regions on the Italian and French side. Slovenia displays the important role of the Ljubljana region and the lag in the development of the Eastern Cohesion region.
Linz Wien Bern Graz Vaduz Verona Milano Zürich Genève Monaco Bolzano München Venezia Grenoble Nürnberg Innsbruck Marseille Ljubljana Stuttgart 100 km
Territorial level: NUTS 3 (2013) Source: FAU, Alps 2050, 2018 Origin of Data: Eurostat, 2018 EuroGeographics for the cities University of Geneva for administrative boundaries Outer perimeter: EUSALP & ASP Alpine Convention © ESPON, 2018 GDP change Vaduz GDP change in % (2008-2014) -14,4 - -7,5 > -7,5 - 0 > 0 - 7,5 > 7,5 - 15 > 15 - 22,5 > 22,5 - 30 > 30 - 93,3 Map 19 GDP change 2008-2014
Indicator/Methodology: Map 19 shows the change of the Gross Domestic Product (GDP) between
the years 2008-14 and, thus, indicates the overall economic performance on regional level.
Description: The overall picture is in some parts similar to the map of the GDP level, which means
that – in the period 2008-14, thus following the start of the economic crisis – economic North-South divide has increased. The already strong regions in Switzerland, Southern Germany and Northern Austria have performed better than most other regions. The same applies on the intraregional scale: The anyway positive position of the Grenoble – Marseille corridor in France, of Southern Tyrol in Italia or of Ljubljana in Slovenia have even increased relative to their neighbouring regions.
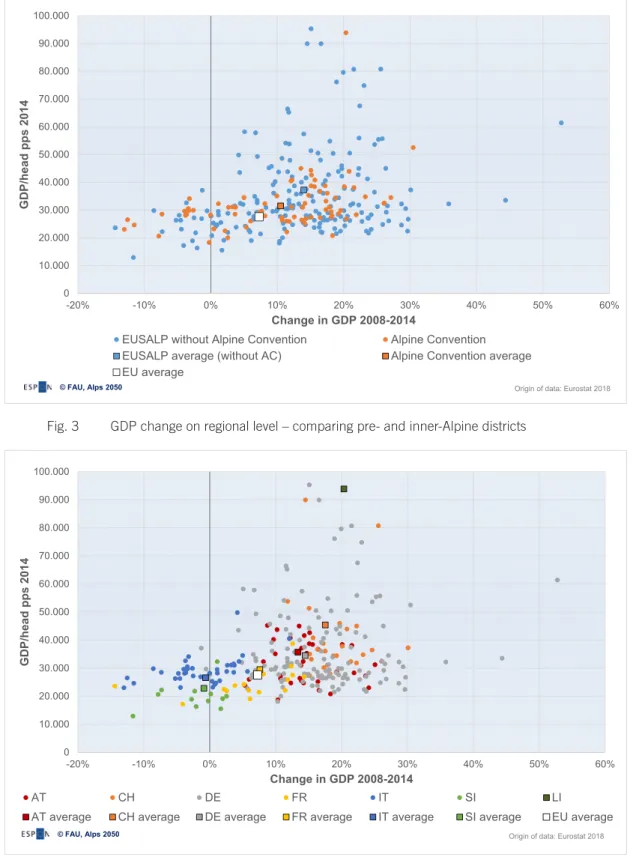
0 10.000 20.000 30.000 40.000 50.000 60.000 70.000 80.000 90.000 100.000 -20% -10% 0% 10% 20% 30% 40% 50% 60% GDP/head pps 2014 Change in GDP 2008-2014
EUSALP without Alpine Convention Alpine Convention EUSALP average (without AC) Alpine Convention average EU average
© FAU, Alps 2050 Origin of data: Eurostat 2018
Fig. 3 GDP change on regional level – comparing pre- and inner-Alpine districts
0 10.000 20.000 30.000 40.000 50.000 60.000 70.000 80.000 90.000 100.000 -20% -10% 0% 10% 20% 30% 40% 50% 60% GDP/head pps 2014 Change in GDP 2008-2014 AT CH DE FR IT SI LI
AT average CH average DE average FR average IT average SI average EU average
© FAU, Alps 2050 Origin of data: Eurostat 2018
Fig. 4 GDP change on regional level – comparing districts of different national affiliation
Indicator/Methodology: The two scatter plots are based on the GDP indicator – on the y-axis the level
of GDP per capita in pps and on the x-graph the change in GDP between 2008 and 2014.
The upper graph (Fig. 3) differentiates those NUTS 3 regions being part of both the Alpine Convention and the EUSALP areas (inner-Alpine) and those who are not part of the Alpine Convention but only of the EUSALP (pre-Alpine). The lower version of the graphic (Fig. 4) shows the performance of
Description: Fig. 3 shows that the EUSALP perimeter comprises many regions with a very strong economic performance, but also some pretty weak performing ones. Simplifying to a certain extent, the graph shows that economic diversity is larger within the EUSALP perimeter than it is within the AC perimeter. The AC regions are performing slightly weaker than the EUSALP ones. This can be explained via the lower presence of urban centres that lead to agglomeration effects. The major part of the cities is located outside of the Alpine Convention. One might interpret this as an argument for the ‘hypsometric postulate’ (inner-Alpine AC regions at “higher” altitudes develop slightly weaker than the ‘lowland’ EUSALP regions), but there are many exceptions. One has to admit that the picture would be different on a finer scale: Even within relatively prosperous (NUTS 3) regions, certain villages and areas can be hit very hard by demographic and structural change (c.f. results of ESPON project PROFECY on Inner Peripheries; Noguera et al. 2017). Both the GDP level and trend are above EU average, and the non-mountainous EUSALP regions are ahead of the Alpine Convention regions.
The picture is much clearer in the lower graphic (Fig. 4): The NUTS 3 regions of each country make up a kind of a ‘cloud’ that can immediately be differentiated from other countries. The high variability within the ‘clouds’ of Switzerland and Germany have to be seen relative to the small size of the NUTS 3 regions in these countries. However, the overall picture is clear: The fragmentation argument – postulating the high importance of national contexts – is very true, at least on the NUTS 3 level. In other words: The belonging to a certain nation-state determines the economic path to a high extent. The question, if a region is situated in the inner-Alpine or pre-Alpine area (i.e. AC or EUSALP), is less decisive.
5 .2
Regional disparities
Tab. 4 Development of regional disparities 2008-14: variation coefficient of GDP per capita (pps) in % (NUTS 3)
2008 2014 Change
EU 28 53,31 56,05 + 5,14%
ALPS2050 33,80 35,52 + 5,09 %
Indicator/Methodology: Tab. 4 presents the values for the coefficient of variation of GDP per capita
in PPS (in %), weighted by the population numbers on NUTS 3 level. A decrease of the coefficient of variation is equivalent to a reduction of disparities and vice versa. It allows to describe disparities of spaces of different sizes, development level and of different points of time (2008-14).
Description: The disparities are much higher on the EU level than within the Alps 2050 space.
This was to be expected as the area is much smaller and the economies involved are performing relatively smart (for more details see Map 18 and Map 19). It is interesting to note that the trend is similar: disparities increased in both spaces over the time 2008-2014 almost with the same changes, slightly different for the Alps 2050 perimeter.
5 .3
Labour and employment
Linz Wien Bern Graz Vaduz Verona Milano Zürich Genève Monaco Bolzano München Venezia Grenoble Nürnberg Innsbruck Marseille Ljubljana Stuttgart 100 kmTerritorial level: NUTS 3 (2013) Source: FAU, Alps 2050, 2018 Origin of Data: Eurostat & National Statistical Offices, 2018 EuroGeographics for the cities University of Geneva for administrative boundaries Outer perimeter: EUSALP & ASP Alpine Convention © ESPON 2018 Employment change Employment change in % (2008-2014) -16,3 - -5,0 > -5,0 - 0,0 > 0,0 - 5,0 > 5,0 - 10,0 > 10,0 - 21,1 Vaduz
Map 20 Employment change 2008-2014
Indicator/Methodology: This indicator shows changes in employment for the period 2008-14 (Map
20). It illustrates to what extent the number of working places of all sectors and branches have developed. Grey colours indicate negative trends, yellow/red colours indicate a positive development.
Description: The spatial pattern shows a pretty clear North-South divide. This picture confirms the
patterns we observe with regard to economic development (GDP trend), demographic development (in particular migratory patterns) and patents. This confirms the interrelatedness of socio-economic development in these dimensions.
Linz Wien Bern Graz Vaduz Verona Milano Zürich Genève Monaco Bolzano München Venezia Grenoble Nürnberg Innsbruck Marseille Ljubljana Stuttgart 100 km
Territorial level: NUTS3 (2013) Source: FAU, Alps 2050, 2018 Origin of Data: Eurostat & National Statistical Offices, 2018 EuroGeographics for the cities University of Geneva for administrative boundaries Outer perimeter: EUSALP & ASP Alpine Convention
© ESPON 2018
Share of labour force in agricultural sector
Labour force in agricultural sector in % (2014)
0,1 - 3,0 > 3,0 - 6,0 > 6,0 - 9,0 > 9,0 - 12,0 > 12,0 - 19,3 Vaduz
Map 21 Share of labour force in agricultural sector 2014
Indicator/Methodology: Map 21 shows the employees in the NACE sector A, comprising agriculture,
forestry, and fishery relative to all employees on the NUTS 3 level (in %). The data is provided by Eurostat and, thus, is harmonised on the European level (with the exception of Switzerland and Liechtenstein). In some countries (in particular in Austria, some concerns also in Slovenia and Italy), the Eurostat data contradicts domestic data due to different definitions (e.g. part-time working) and methodologies. This visualisation shows the share of all persons (employees) and not full-time equivalents which would show far lower values.
Description: The spatial pattern shows values over average for large parts of Slovenia and (Eastern)
Austria. This pattern is not easy to explain: beyond the statistical complexity, the enhanced values for Austria could be explained with a high priority policy for rural and mountainous areas.
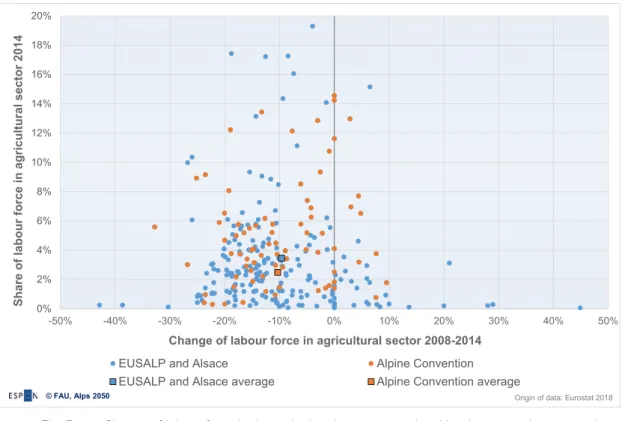
Fig. 5 Change of labour force in the agricultural sector on regional level – comparing pre- and inner-Alpine districts
Fig. 6 Change of labour force in agricultural sector on regional level – comparing districts of different national affiliation
Indicator/Methodology: The scatter plots of Fig. 5 and Fig. 6 visualise the level of agricultural
employment on the y-axis and the change of the labour force in the agricultural sector for 2008-14. Each dot represents one NUTS 3 region; in the upper graph, we differentiate the inner-Alpine regions (“Alpine Convention”) and the pre-Alpine regions (EUSALP and Alsace without Alpine convention
0% 2% 4% 6% 8% 10% 12% 14% 16% 18% 20% -50% -40% -30% -20% -10% 0% 10% 20% 30% 40% 50% Share of labour force in agricultural sector 2014
Change of labour force in agricultural sector 2008-2014 EUSALP and Alsace Alpine Convention EUSALP and Alsace average Alpine Convention average
© FAU, Alps 2050 Origin of data: Eurostat 2018
0% 2% 4% 6% 8% 10% 12% 14% 16% 18% 20% -50% -40% -30% -20% -10% 0% 10% 20% 30% 40% 50% Sh ar e of la bo ur fo rc e in a gr icu ltu ra l s ec to r 2 01 4
Change of labour force in agricultural sector 2008-2014
AT CH DE FR IT SI LI
AT average CH average DE average FR average IT average SI average
areas). In the lower scatter plot we differentiate the national affiliation – each colour represents one country affiliation.
Description: All in all, we see a diverse development spatial pattern. The scatter plot confirms the
impression from the cartographic representation of Map 21 that the differences between inner-Alpine and pre-inner-Alpine areas are not significant, in other words: the average values are very close between the inner and pre-Alpine space. However, the national affiliation does matter – the average values of the national level are clearly different. This shows the relevance of political decision-making (funding programmes, subsidies etc.).
5 .4
Innovation
Linz Wien Bern Graz Vaduz Verona Milano Zürich Genève Monaco Bolzano München Venezia Grenoble Nürnberg Innsbruck Marseille Ljubljana Stuttgart 100 kmTerritorial level: NUTS3 (2013) Source: FAU, Alps 2050, 2018 Origin of Data: Eurostat, 2018 EuroGeographics for the cities University of Geneva for administrative boundaries Outer perimeter: EUSALP & ASP Alpine Convention
© ESPON 2018
Patent applications
no data
Patent applications per mio. inhabitants (2012)
9 - 150 > 150 - 300 > 300 - 450 > 450 - 600 > 600 - 1770 Vaduz
Indicator/Methodology: Map 22 visualises the indicator patent application per million inhabitants at the European Patent Office (EPO). This map shows very different values on the NUTS 3 level. The methodological debate on this indicator is complex: One might criticise the focus on technological innovations and, thus, the underestimation of process innovation, social innovation, management innovation etc. – at the same time, the number of EPO patents correlates strongly with socio-economic development and, thus, is an important hint.
Description: This map shows a pretty sharp North-South contrast within the Alps 2050 perimeter
comprising values below 150 and above 600. There is a certain focus on metropolitan regions, but the national affiliation to Northern Alpine or Southern Alpine countries is important. The Swiss and German economies tend to be over the average of patent applications, and so is Northern Austria and the Grenoble region; large parts of France, Italy and also Slovenia show low levels of patent application.
5 .5
Tourism
Linz Wien Bern Graz Vaduz Verona Milano Zürich Genève Monaco Bolzano München Venezia Grenoble Nürnberg Innsbruck Marseille Ljubljana Stuttgart 100 kmTerritorial level: NUTS3 (2013) Source: Eurac Research & FAU, Alps 2050, 2018 Origin of Data: Eurostat, 2018 EuroGeographics for the cities University of Geneva for administrative boundaries Outer perimeter: EUSALP & ASP Alpine Convention
© ESPON, 2018
Tourism intensity
Overnight stays * 100 per inhabitant (2015)
7 - 250 > 250 - 500 > 500 - 750 > 750 - 1000 > 1000 - 1500 > 1500 - 8379 Vaduz
Map 23 Tourism intensity 2015 – overnight stays per 100 inhabitants
Indicator/Methodology: The indicator tourism intensity is calculated on the NUTS 3 level and is
based on the formula “overnight stays per year x 100 / population 2015” (Map 23). It shows the actual demand (and not only the infrastructure quantity as shown in the next map).
Description: The values are the highest in the central and Eastern parts of the inner-Alpine area.
This is due to the strong presence of the tourism sector and the relatively low population density. As a result, the relative economic importance is the highest in inner-Alpine areas.