Synthesis of Telechelic Poly(p-benzamide)s
Mahshid Alizadeh, Andreas F.M. Kilbinger*
University of Fribourg, Chemistry Department, Chemin du Musée 9, CH-1700, Fribourg, Switzerland E-mail: [email protected]
Table of Contents
NMR Spectra ... 2
TGA/ DSC data ... 10
MALDI-‐ToF mass spectrometric data of polymers ... 12
GPC data of modified polymers ... 16
Table of solubility ... 18
NMR Spectra
Figure S1: 1H NMR spectrum (400 MHz, DMSO-d
6) of 4-((2-ethylhexyl)amino)benzoic acid (1a) at r.t.
Figure S2: 13C NMR spectrum (100 MHz, DMSO-d
Figure S3: 1H NMR spectrum (400 MHz, DMSO-d
6) of 4-((2,4-dimethoxybenzyl)amino)benzoic acid (1b) at r.t.
Figure S4: 13C NMR spectrum (100 MHz, DMSO-d
6) of 4-((2,4-dimethoxybenzyl)amino)benzoic acid (1b) at r.t.
Figure S5: 1H NMR spectrum (400 MHz, DMSO-d
6) of pentafluorophenyl 4-((2,4-dimethoxybenzyl)amino)benzoate (M2)
at r.t.
Figure S6: 13C NMR spectrum (100 MHz, DMSO-d6) of pentafluorophenyl 4-((2,4-dimethoxybenzyl)amino)benzoate (M2)
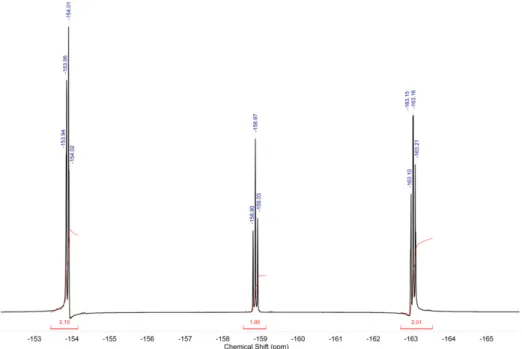
Figure S7: 19F NMR spectrum (376 MHz, DMSO-d 6) of pentafluorophenyl 4-((2,4-dimethoxybenzyl)amino)benzoate (M2) at r.t
Figure S8: 1H NMR spectrum (400 MHz, CDCl 3) of pentafluorophenyl 4-((2-ethylhexyl)amino)benzoate (M1) at r.t.
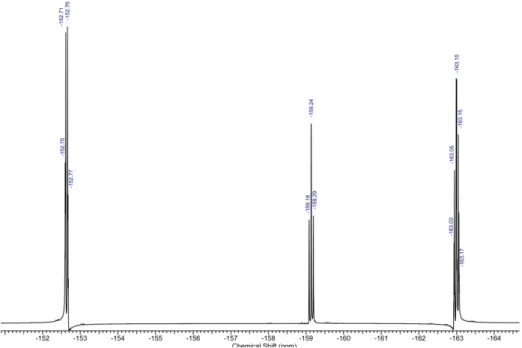
Figure S9: 19F NMR spectrum (376 MHz, CDCl3) of pentafluorophenyl 4-((2-ethylhexyl)amino)benzoate (M1) at r.t.
Figure S10: 1H NMR spectrum (400 MHz, DMSO-d
Figure S11: 13C NMR spectrum (100 MHz, DMSO-d
6) of phenyl 4-((2-ethylhexyl)amino)benzoate (M3) at r.t.
Figure S12: 1H NMR spectrum (400 MHz, DMSO-d
6) of phenyl 4-((2,4-dimethoxybenzyl)amino)benzoate (M4) at r.t.
Figure S13: 13C NMR spectrum (100 MHz, DMSO-d
6) phenyl 4-((2,4-dimethoxybenzyl)amino)benzoate (M4) at r.t.
Figure S14: 1H NMR spectrum (400 MHz, Chloroform-d) of P3 at r.t.
Figure S15: Plot of the molecular weight (black) and molecular weight dispersity (blue) obtained versus the M2/initiator
TGA/ DSC data
TGA/ DSC CurvsFigure S16: Thermogravimetric analysis of P3.
Figure S18: DSC experiment of P3( second heating curve from -50 °C to 250 °C).
MALDI-ToF mass spectrometric data of polymers
Figure S20: MALDI-ToF mass spectrum of the post polymerization modification of polymer P1 with ethanolamine as Ag+
adduct (matrix: DCTB). The inset shows the most intense peak of the distribution isotopically resolved.
Figure S21: MALDI-ToF mass spectrum of polymer P4 as Ag+ adduct (matrix: DCTB). The inset shows the most intense peak of the distribution isotopically resolved.
Figure S22: MALDI-ToF mass spectrum of polymer P5 as Ag+ adduct (matrix: DCTB). The inset shows the most intense peak of the distribution isotopically resolved.
Figure S23: MALDI-ToF mass spectrum of the polymer P6 as Na+ adduct (matrix: DCTB). The inset shows the most intense
Figure S24: MALDI-ToF mass spectrum of the polymer P7 as Ag+ adduct (matrix: DCTB). The inset shows the most
intense peak of the distribution isotopically resolved.
Figure S25: MALDI-ToF mass spectrum of the polymer P8 as Na+ adduct (matrix: DCTB). The inset shows the most intense peak of the distribution isotopically resolved.
Figure S26: MALDI-ToF mass spectrum of the polymer P9 as Ag+ adduct (matrix: DCTB). The inset shows the most intense
GPC data of modified polymers
Figure S27: THF GPC elugram of P5 Figure S28: THF GPC elugram of P6
Figure S29: THF GPC elugram of P7
Figure S30: THF GPC elugram of P8