Laboratory based XAS measurements,
Electron-induced double K-shell
ionization of Sc, Cr and Cu
and
Chemical sensitivity of photoinduced K
h
b
hypersatellite transitions in Cr
compounds
THESIS
presented to the Faculty of Science of the University of Fribourg (Switzerland) in consideration for the award of the academic grade of Doctor rerum naturalium
by
Faisal Zeeshan
from
Pakistan
Thesis No: 2052 Editor: UniFr – UniPrint
Abstract IV
Résumé VI
I. Introduction 1
I.1. X-ray absorption spectroscopy (XAS) . . . 2
I.1.1. Beer-Lambert law . . . 2
I.1.2. X-Ray absorption fine structure (XAFS) spectra . . . 3
I.1.3. XAFS techniques . . . 6
I.1.4. X-ray sources for XAS . . . 8
I.2. Double 1s vacancy states produced by impact with electrons . . . . 16
I.2.1. Production of hollow K-shell atoms . . . 16
I.2.2. Hypersatellite X-ray transitions . . . 20
I.3. Chemical sensitivity of photoinduced Kb hypersatellite transitions in Cr compounds . . . 22
II. Laboratory-based XAS measurements with a von Hamos curved crystal spectrometer 26 II.1. Preamble . . . 27
II.2. Experimental setup and methodology . . . 28
II.2.1. Von Hamos crystal spectrometer . . . 28
II.2.2. XAS setup . . . 32
II.2.3. Optimization of the setup parameters . . . 35
II.3. Measurements . . . 42
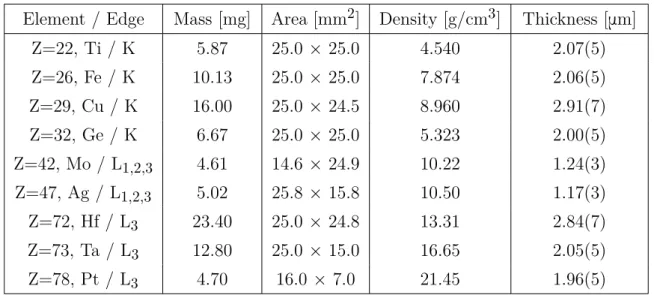
II.3.1. Samples, crystals and X-ray tubes . . . 42
II.3.3. L3-edges of Hf, Ta and Pt . . . 47
II.3.4. L1, L2 and L3-edges of Mo and Ag . . . 48
II.4. Data analysis . . . 51
II.4.1. Energy calibration . . . 51
II.4.2. Instrumental resolution . . . 52
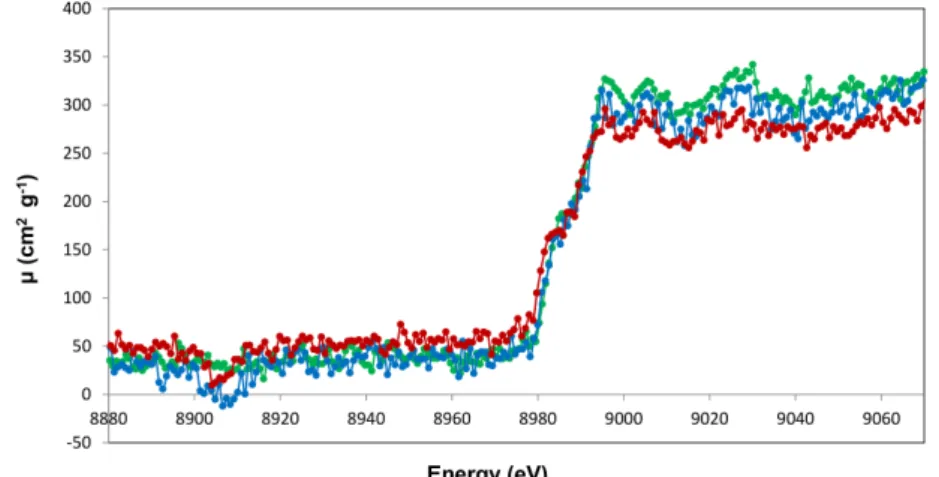
II.4.3. Determination of the edge energies and absorption coefficients 53 II.5. Results and discussion . . . 56
II.5.1. Comparison with synchrotron radiation measurements . . . 56
II.5.2. Edge energies . . . 59
II.5.3. Absorption coefficients . . . 62
II.6. Summary and concluding remarks . . . 65
III. Electron-induced double K-shell ionization of Sc, Cr and Cu 68 III.1. Experimental setup and measurements . . . 69
III.1.1. Experimental setup . . . 69
III.1.2. Attenuation factors . . . 70
III.1.3. Measurements . . . 71
III.2. Data analysis . . . 75
III.2.1. Energy calibration and instrumental broadening . . . 75
III.2.2. Fitting procedure . . . 77
III.2.3. Intensity correction factors . . . 85
III.3. Results and discussion . . . 93
III.3.1. Energies . . . 93
III.3.2. Line widths . . . 98
III.3.3. Ratios of double-to-single K-shell ionization cross sections . 100 III.4. Summary and concluding remarks . . . 107
IV. Chemical sensitivity of photoinduced Khb hypersatellite tran-sitions in Cr compounds 109 IV.1. Experiment . . . 110
IV.1.1. Beam line setup . . . 110
IV.2. Data analysis . . . 113
IV.2.1. Kb diagram spectra . . . 113
IV.2.2. Khb1,3 hypersatellite spectra . . . 119
IV.3. Results and discussion . . . 121
IV.3.1. Kb diagram and VtC transitions . . . 121
IV.3.2. Khb1,3 hypersatellite transitions . . . 131
IV.4. Summary and concluding remarks . . . 139
List of Figures 143 List of Tables 147 References 149 Acknowledgements 158 Curriculum vitae 159 List of publications 162
The present PhD thesis includes three different projects which belong to the do-main of inner-shell atomic physics and high energy resolution X-ray spectroscopy. The first project consists of a series of in-house measurements of the characteristic K and L X-ray absorption spectra (XAS) of several 3d, 4d and 5d transition metals. For this project the target chamber of the von Hamos curved crystal spectrometer of Fribourg was slightly modified to allow the operation of the spectrometer in the so-called direct geometry. As compared to the standard von Hamos setup, in this geometry the target is replaced by the anode of an X-ray tube. The XAS spectra are then measured by inserting the absorber of interest either in front of the spectrometer slit or in front of the CCD detector. In order to optimize the experimental setup, the effect of the sample thickness on the experimental edge energies and the influences of the chosen crystal and X-ray tube voltage on the shapes of the spectra were carefully investigated and compared to XAS measurements performed with synchrotron radiation (SR). Precise K and/or L edge energies could be determined and compared to existing experimental and theoretical values. The magnitudes of the absorption coefficient jumps across the edges could also be determined quantitatively and compared to the values obtained from the code XCOM developed at the National Institute for Standards and Technology (NIST).
In the second project the double K-shell ionization of Sc, Cr and Cu induced by electron impact was investigated. This second project was also carried out in-house with the von Hamos curved crystal spectrometer of Fribourg operated in the direct geometry, using the anodes of Sc, Cr and Cu X-ray tubes as targets. The dou-ble K-shell ionization was studied via high energy resolution measurements of the Ka1,2 diagram and Kah1,2 hypersatellite transitions. The main experimental diffi-culty in this project resided in the determination of the hypersatellite-to-diagram line intensity ratios because the same X-ray tube high voltages had to be used
for the hypersatellite and diagram line measurements to get reliable ratios. The hypersatellite lines being about 104 times less intense than their parent diagram lines, the X-ray tubes should be operated at rather high voltages to get hyper-satellite spectra with a high enough statistics but then the diagram lines could not be measured in a straightforward way, the CCD being completely saturated due to the tremendous intensity of the diagram lines. The difficulty was circumvented by measuring the diagram lines first at low voltages without and with absorbers and then at high voltages with the same absorbers. The energies and natural line widths of the hypersatellites were determined and compared to existing ex-perimental and theoretical values. The ratios PKK of the double-to-single K-shell ionization cross sections were deduced from the measured relative intensities of the hypersatellites. The results were compared to the PKK values obtained by other groups with electrons, photons and via the nuclear electron capture process. The aim of the third project was to investigate the influence of the chemical state on the Khb1,3 hypersatellite spectra of Cr induced by single-photon double K-shell ionization. For 3d transition metals and their compounds the Kb X-ray emission spectra provide useful information on the electronic structure and oxidation state. The solid- and chemical- effects on the Kb1,3diagram and the Kb2,5valence-to-core
(VtC) transitions are well known, and numerous measurements of the Kb X-ray emission spectra of 3d transition metals have been performed using synchrotron radiation, proton, electron and heavy ion excitations. In contrast, the sensitivity of the Khb1,3 hypersatellite transitions to chemical effects has not been explored.
High energy resolution data for photoinduced hypersatellite Khb1,3 transitions
are scarse because of the low double K-shell photoionization cross sections and transition yields. In this third project, the Kb hypersatellite, and also the Kb1,3 diagram and valence-to-core (VtC) spectra of metallic Cr and Cr compounds were measured by applying the high-resolution XES spectroscopy technique using the 7-crystal Johann-type hard X-ray spectrometer at the Stanford Synchrotron Radi-ation Lightsource (SSRL) . The chemical effects on the energies, intensities, shapes, and widths of the Kb X-ray emission lines were investigated for Cr in four nominal oxidation states: Cr (Cr0), Cr2O3 (Cr3+), CrO2 (Cr4+) and K2Cr2O7 (Cr6+). Chemical speciation of chromium is important because this element and its com-pounds are widely used in chemical industry. Further, high resolution XES data of Kb-hypersatellites are also useful for theory because they allow for a stringent comparison with atomic structure calculations.
Cette thèse de doctorat contient trois différents projets qui appartiennent aux domaines de la physique atomique des couches profondes et de la spectroscopie de rayons X en haute résolution.
Le premier projet concerne l’étude des spectres d’absorption (XAS) K et L de quelques éléments de transition 3d, 4d et 5d. Les mesures ont été réalisées à Fri-bourg avec le spectromètre à cristal von Hamos dont la chambre à cible a été modifiée pour permettre l’emploi du spectromètre dans une géométrie différente, dite géométrie directe. Dans cette géométrie, la cible est remplacée par l’anode d’un tube de rayons X et les spectres d’absorption sont mesurés en insérant l’échantillon à analyser soit devant la fente du spectromètre, soit directement devant le détec-teur CCD. Afin d’optimiser l’arrangement expérimental, l’influence de l’épaisseur de l’échantillon sur la position des bords d’absorption ainsi que les effets du choix du cristal et de la haute tension du tube de rayons X sur la forme des spectres ont été soigneusement analysés et comparés à des résultats obtenus au moyen de rayon-nement synchrotronique. Les énergies des bords d’absorption K et/ou L ont été déterminées avec précision et comparées aux valeurs expérimentales et théoriques existant dans la litérature. Les amplitudes des sauts du coefficient d’absorption aux bords ont pu être déterminées quantitativement et comparées aux valeurs cal-culées à l’aide du programme XCOM développé à NIST (National Institute for Standards and Technology).
Le deuxième projet est une étude de l’ionisation double de la couche atomique K produite par collision avec des électrons pour trois éléments de transition 3d. Ce projet a également été réalisé à Fribourg à l’aide du spectromètre von Hamos en géométrie directe en utilisant les anodes de Sc, Cr et Cu de tubes de rayons X comme cibles. Les mesures ont porté principalement sur les raies diagrammes Ka1,2 et hypersatellites Kah1,2. La difficulté expérimentale majeure de ce projet a
raies diagrammes parentes. Pour obtenir des rapports fiables, il a fallu mesurer en effet les raies hypersatellites et diagrammes en utilisant la même tension anodique. Comme les raies hypersatellites sont environ 104 moins intenses que les raies dia-grammes, une valeur relativement élevée a dû être choisie pour cette tension, ce qui a entraîné pour les raies diagrammes des taux de comptage très élevés qui saturaient le détecteur CCD. La difficulté a été résolue en mesurant les raies dia-grammes tout d’abord à basse tension avec et sans absorbeurs, puis à plus haute tension avec les mêmes absorbeurs. Les énergies, largeurs naturelles et intensités relatives des hypersatellites ont été déterminées avec précision et comparées aux valeurs expérimentales et théoriques trouvées dans la litérature. Les rapports PKK des sections efficaces d’ionisation K double et simple ont été ensuite déduites des intensités relatives des hypersatellites et les résultats comparés aux valeurs obte-nues par d’autres groupes au moyen d’électrons, de photons ou d’isotopes produits par capture électronique nucléaire.
L’objectif du troisième projet était d’étudier l’influence de l’état chimique sur les spectres de rayons X hypersatellites Khb1,3 du Cr produits par double photoio-nisation de la couche K. Pour les métaux de transition 3d et leurs composés, les spectres de rayons X Kb fournissent des informations très utiles sur la structure et l’état chimique des échantillons analysés. Les effets chimiques et du corps solide sur les transitions diagrammes Kb1,3 et les transitions valence-coeur (VtC) Kb2,5 sont bien connus et de nombreuses mesures des spectres d’émission Kb ont été réalisées en utlisant du rayonnement synchrotronique, des protons, des électrons et des ions lourds. En revanche, la sensibilité aux effets chimiques des transitions hypersatellites Khb1,3 n’a pas encore été explorée. Les données de haute
réso-lution concernant les raies hypersatellites Khb1,3 sont aussi rares parce que les
sections de double photoionisation de la couche K et les probabilités de transition Kb sont faibles. Dans ce troisième projet, les raies X hypersatellites Khb1,3 ainsi que les raies diagrammes Kb1,3 et les raies valence-coeur Kb1,5 du Cr métallique
et de plusieurs de ses composés ont été mesurées par la technique de la spectro-scopie X d’émission (XES) en haute résolution. Les mesures ont été réalisées à la source de rayonnement synchrotronique SSRL (Stanford Synchrotron Radiation Lightsource) au moyen d’un spectromètre à cristaux multiples de type Johann. L’influence des effets chimiques sur les énergies, intensités, formes et largeurs des raies d’émission Kb et Khb ont été étudiés pour des échantillons de Cr dans quatre états d’oxydation différents : Cr métallique (Cr0), Cr2O3 (Cr3+), CrO2 (Cr4+) et
K2Cr2O7 (Cr6+). La caractérisation chimique du Cr est importante car cet
élé-ment et ses composés sont largeélé-ment utilisés dans l’industrie chimique. De surcroît, des données XES de haute résolution sur l’émission X hypersatellite Kb est aussi utile pour la théorie car elles permettent de vérifier de façon rigoureuse les calculs de structure atomique.
I.1
X-ray absorption spectroscopy (XAS)
X-rays were first discovered by Wilhelm Conrad Röntgen in 1895 [1, 2]. This important discovery which was rewarded with the Nobel Prize in Physics in 1901 opened a new era in the investigation of matter. Due to their short wavelength and high penetration power X-rays represent indeed an unique and powerful tool to study the elemental composition and the properties of matter. Among the numerous analysis methods based on X-rays, X-ray absorption spectroscopy (XAS) has developed continuously through the 20th century [3] and the recent advent of intense, monochromatic, energy tunable and micro-focused synchrotron radiation beams has given a new boost to XAS which has become nowadays a well established routine experimental technique.
I.1.1
Beer-Lambert law
Below 100 keV, the interaction of X-rays with matter is dominated by the photo-electric effect, whose cross section is significantly bigger than the elastic or coherent scattering (called also Rayleigh scattering) and inelastic or incoherent scattering (Compton scattering) cross sections. In the photoelectric effect or photoioniza-tion, the whole energy and momentum of the incoming photon are transferred to a bound atomic electron. The latter called photoelectron is removed from the atom with a certain kinetic energy. If the energy of the incoming photon is smaller than the absolute value of the binding energy of the atomic electron, the latter can be excited into an outer unfilled level (photoexcitation). In both cases the photon disappears, i.e., is absorbed by the target atom. After a very short time, in the order of 10–15 to 10–17 s depending on the atomic number and subshell of the considered element, the ionized or excited atom decays either radiatively with the emission of a characteristic X-ray line (fluorescence) or via a radiationless Auger process. In other words, the energy of the absorbed X-ray is converted into the kinetic energy of the photoelectron and/or the energy of the fluorescence X-rays or Auger electrons as shown in Fig. I.1. According to the Beer-Lambert law, if an incident X-ray beam with an intensity I0 interacts with a sample of thickness h, the intensity I(E) which is transmitted through the sample is given by:
I
I
0
Transmitted X-rays Incident X-rays Photoelectrons Scattered X-rays Fluorescence X-rays Auger electronsh
Figure I.1 – Schematic diagram representing the transmission of a
colli-mated X-ray beam through a sample of thickness h. The indicated directions of the photoelectrons, Auger electrons and scattered and fluorescence X-rays produced in the sample as a result of the absorption of the incoming radia-tion are arbitrary.
where m(E) [cm2/g] represents the total mass absorption coefficient of the sample and r its density [g/cm3]. For a collimated beam geometry as the one represented in Fig. I.1, the elastic scoh and inelastic sincoh scattering cross sections must be included in the total absorption coefficient because the scattered photons are removed from the transmitted beam even if they are not really absorbed by the sample. Thus the total absorption coefficient reads:
m(E) = sphoto(E) +scoh(E) +sincoh(E). (I.2)
I.1.2
X-Ray absorption fine structure (XAFS) spectra
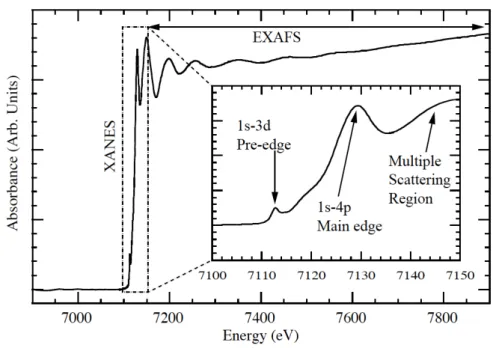
An example of an X-ray absorption fine structure spectrum, namely the one cor-responding to the K-edge of Fe, is depicted in Fig. I.2. In a XAFS spectrum, the total absorption coefficient m, or like here, the absorbance A defined by
A = log10[I0(E)/I(E)] = log10[em(E)·r·h] ∼= 0.434 ·m(E) · r · h (I.3)
is plotted as a function of the incoming radiation energy E.
The observed shape of a XAS spectrum can be explained as follows: as soon as the energy of the incoming X-ray radiation matches the absolute value of the electron binding energy of a given shell or subshell, the photoelectric effect becomes energetically possible, which leads to an abrupt increase of the total absorption
Figure I.2 – Fe K-edge XAFS spectrum showing the XANES and EXAFS
regions (Source: Ref. [4]).
coefficientm. This sudden step-like increase of m is named absorption edge, e.g., K-absorption edge if the photoeffect takes place on a 1s electron, L1-, L2- or L3-edge in
the case of a 2s, 2p1/2or 2p3/2 electron, and so on. Due to the lifetime broadenings of the initial and final states of the excited electron, the edge is characterized by a certain energy width. The width of the absorption edge is still increased by the instrumental resolution of the detector employed for the measurement. Above the edge, the absorption coefficient m or the absorbance diminishes again gradually and exhibits usually some oscillations. Each element across the periodic table is characterized by a set of unique absorption edges which correspond to different binding energies of its electrons. The XAS technique is thus element selective. As mentioned before, if the energy of the incoming photon is smaller than the absolute value of the binding energy of the electron, the latter cannot be removed from the atom but it can be excited into an unfilled outer shell. In other words, the absorption coefficients begins to grow below the ionization threshold. The weak spectral features (pre-edge structures, see inset of Fig. I.2) observed below the main increase of the edge reflect the promotion of a core electron into an unfilled outer level lying below the Fermi level, whereas the edge itself and the peak on the top of it, the so-called ”white line”, as well as the secondary peaks observed close above the edge correspond to the excitation of the core electron into unoccupied bound levels lying above the Fermi level. These structures which extend typically
over an energy range of 50-100 eV are named XANES (X-ray absorption near edge structures) or NEXAFS (Near edge X-ray absorption fine structures). The characteristics of XANES features provide information about the oxidation state and spin state of the probed element.
The energy region of about 500-1000 eV above XANES is called EXAFS (Extended X-ray absorption fine structure). In this region, the energy of the incoming photon is bigger than the absolute value of the electron binding energy of the considered atomic level. As a consequence the photoelectron leaves the atom with a kinetic energy equal to that of the absorbed photon minus the binding energy (absolute value) of the initial core state. The photoelectron escaping the atom may interact with bound electrons of the surrounding non-excited atoms. Considering the wave-like nature of the photoelectron and assuming the surrounding atoms to be point-like scatterers, one can imagine that the backscattered electron wave interferes with the forward-propagating wave. The resulting interference pattern appears in the spectrum as a modulation of the measured absorption coefficient or absorbance, causing thereby the oscillation observed in the EXAFS region. The wavelength of the photoelectron is dependent on the energy and phase of the backscattered wave whose wavelength changes as a function of the energy of the incoming photon. Furthermore, the phase and amplitude of the backscattered wave depend on the type of atom causing the backscattering and on the distance of the backscattering atom from the central atom. It is thus possible to obtain information about the chemical coordination environment of the original absorbing central atom from the analysis of the EXAFS data.
The locations of absorption edges are not unambiguously defined [5] and have been variously associated in the literature with i) the first inflection point of the absorption spectrum, ii) the energy needed to produce a single core vacancy with the photoelectron ”at rest at infinity” and iii) the energy needed to promote a core electron to the lowest unoccupied state. A discussion of these alternatives can be found in [6]. Note that in the alternative ii) the absorption edge energies can be determined by combining the electron binding energies of outer shells which can be measured accurately by means of photoelectron spectroscopy with the energies of emission lines involving transition electrons which originate from the same outer shells.
I.1.3
XAFS techniques
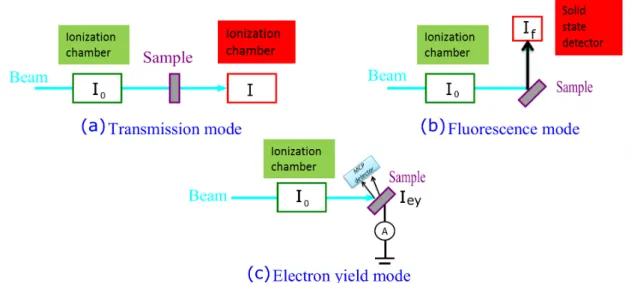
The XAFS spectrum of a sample can be measured by means of the transmission, fluorescence or electron yield method [7,8]. The corresponding experimental setups are shown in Fig. I.3.
In the transmission method [see Fig. I.3 (a)], the incident beam intensity I0 and the transmitted beam intensity I are measured by ion chambers and the absorption coefficient mtot(E) is obtained from the Equation I.1:
m(E) = ln(
I0(E)
I(E))
r · h . (I.4)
For transmission measurements, the sample must be free of pinholes and its thick-ness chosen so that the difference between the incident I0 and transmitted I beam
intensities is large, keeping I, however, at a reasonably high enough value. A too thick absorber leads indeed to a decrease of the overall spectral intensity, attenua-tion of XANES/EXAFS oscillaattenua-tions and to a reducattenua-tion of the white line intensity resulting in an apparent shift of the absorption edge energy with the sample thick-ness [9,10]. As a rule of thumb, it is generally recommended to choose the absorber thickness h so that 2 <m · r · h < 4. To preserve the white line shape and intensity an even smaller sample thickness given by mmax·r · h ≤ 1, where mmax represents
the maximum value of the total absorption coefficient, is suggested in [11].
In the fluorescence mode [see Fig. I.3 (b)], the incident beam intensity I0 is also measured with an ionization chamber but instead of measuring the intensity trans-mitted through the sample, one measures the intensity of the fluorescence X-rays from the sample. The main advantage of the fluorescence method is to permit the study of highly dilute or non-homogeneous samples which are not suitable for absorption measurements performed in the transmission mode. However, as the fluorescence X-rays can be partly absorbed in the sample, the measured intensity should be corrected for the self-absorption in the case of thick or concentrated sam-ples. Although the fluorescence detection is the most common XAFS method in the hard X-ray regime, i.e., for XAS measurements around the K-edges of elements with Z>30, it is relatively difficult to employ in the soft X-ray region because of the tiny value of the fluorescence yield factors of light elements. The fluorescence can be measured with PIN photodiodes or multichannel-plate-detectors (MCP). In this case, the method is named ”total fluorescence yield” (TFY). One major drawback of the total fluorescence yield method is its low signal-to-background
Figure I.3 – Schematic drawings of the experimental setups for XAS
mea-surements performed by means of (a) the transmission method, (b) fluores-cence method and (c) electron yield method. The drawing was reproduced from [14].
ratio. This drawback can be eliminated by using energy-dispersive detectors with a good energy resolution such as Si or Ge semi-conductor detectors. In this case, the method refers to as ”partial fluorescence yield” (PFY). One of the widely used detectors in PFY XAFS measurements is the silicon drift detector (SDD) because it achieves a higher energy resolution and higher count rate as compared to conven-tional semi-conductor detectors and it can be used near room temperature. If the fluorescence yield is integrated over an energy interval centered on the selected flu-orescence line and narrower than the natural linewidth of the latter, the method is referred to as high energy resolution XAS [12, 13]. In high energy resolution XAS, the fluorescence is measured by means of wavelength-dispersive detectors (crystal spectrometers). In the electron yield mode [see Fig. I.3 (c)], the electron emission of the sample is measured instead of the fluorescence emission, the incident beam intensity I0 being still determined using an ionization chamber. As for the
fluo-rescence yield mode, the total electron yield (TEY) mode and the partial electron yield (PEY) mode can be used. In the TEY mode the yield corresponding to all photoelectrons, Auger electrons and secondary electrons is measured. Secondary electrons are electrons emitted as a result of inelastic scattering processes with primary electrons. Due to the large mean free path of low energy electrons in matter, the TEY signal is dominated by electrons with kinetic energies below 10 eV. For TEY XAS in the soft X-ray region, the simplest setup consists to connect
the sample to the ground through an ammeter and to monitor the neutralization current. Alternatively, it is also possible to measure the free electrons emitted by the sample using a micro-channel-plate (MCP) detector. The partial electron yield (PEY) method consists to collect only a fraction of the electrons by using an electron energy analyser [15]. For instance, the kinetic energy of Auger electrons being characteristic for a specific radiationless transition, the Auger electron yield (AEY) can be determined by setting the analyser at this specific transition energy. As recently demonstrated, an alternative method to measure XAS spectra in the fluorescence mode is the high energy resolution off-resonant spectroscopy (HEROS) [16–19]. It is known that XAS spectra can be retrieved using the Kramers-Heisenberg formalism from high energy resolution off-resonant X-ray emission spectra. The HEROS technique combines the irradiation of the sample at a fixed incident beam energy, detuned to below the energy of the absorption edge of in-terest, with the detection of the sample X-ray fluorescence by means of a von Hamos-type crystal spectrometer. The main advantage of HEROS is that XAS spectra can be measured in a scanless mode of operation in very short times, al-lowing thus the investigation of fast chemical reactions [18, 20] or the extension of the XAS method to X-ray free electron laser (XFEL) beams [17]. In addition, HEROS was found to be insensitive to the self-absorption effect [21].
I.1.4
X-ray sources for XAS
XAS techniques have become increasingly important during the last two decades. The main reason for this expansion resides in the development all around the world of new X-ray sources, namely third- generation synchrotron radiation fa-cilities providing monochromatic, energy tunable and micro-focused X-ray beams of very high brilliances. The XAS technique, however, has been also used and is still used with laboratory based X-ray sources such as X-ray tubes for routine measurements that do not need too sophisticated photon beams and have to be performed frequently and within short terms.
X-ray tubes
The most common laboratory based X-ray source is the X-ray tube which works ac-cording to the basic principle discovered by Röntgen to produce X-rays. However, an important improvement over the cold cathode Crookes’ tube used by Röntgen
was made by Coolidge. A Coolidge-type X-ray tube consists of a sealed-off highly evacuated glass envelope containing a filament heated by an electrical current and a metallic anode called sometimes anti-cathode and made usually of Sc (Z=21), Cr (Z=24), Cu (Z=29), Mo (Z=42), Rh (Z=45), Ag (Z=47), W (Z=74) or Au (Z=79). A high voltage power source (30-450 kV) is connected across the filament and the anode to accelerate the electrons. The heating of the filament serves to increase the kinetic energy of the valence-conduction electrons present in the metallic fila-ment until they can escape from the metal via the so-called thermionic emission. The filament is commonly surrounded by a metal cathode, which is kept at the same negative potential as the filament, and serves to focus the emitted electrons to a small area (focal spot) on the anode. For high-power X-ray tubes (electrical power of several kW), this focal spot is typically in the order of several tens of mm2. Anodes of X-ray tubes are cooled down by water circulation (high-power tubes) or air circulation (low-power tubes). For higher powers (20 kW or more) X-ray tubes with a water-cooled rotating anode are employed.
For X-ray applications such as X-ray imaging which need a high resolution, i.e., smaller focal spots, micro-focused X-ray tubes have been recently developed. There are two categories of such X-ray tubes, namely the solid-anode and metal-jet-anode micro-focus X-ray tubes. The solid-anode micro-focus X-ray tubes are similar to Coolidge tubes, but thanks to additional focusing electrodes a very small focal spot can be obtained on the anode, in the range 5-20 mm. However, in order to avoid melting of the anode the power density of the electron beam must be below a maximum value of 0.4-0.8 W/mm depending on the anode material. This means that a solid-anode micro-focus source with a 10mm electron beam focus can operate at a power in the range 4-8 W. In metal-jet-anode micro-focus X-ray tubes the solid metal anode is replaced with a thin jet of liquid metal. The advantage of the metal-jet anode is that the maximum electron beam power density is significantly increased. Values in the range 3-6 W/mm can be reached using different materials such as Ga and Sn for the liquid jet. In this case, with a 10 mm electron beam focus a metal-jet-anode micro-focus X-ray source may operate at 30-60 W.
When a charged particle is accelerated or decelerated, it radiates electromagnetic energy. Each change of the direction or magnitude of the velocity of a charged particle results thus in some loss of its kinetic energy via the emission of photons. This process is known as the Bremsstrahlung (BS) effect. In an X-ray tube, the accelerated electrons strike the anode and are slowed down because they make
collisions with the atoms of the anode material. In each collision, part of the electron momentum is transferred to the atom, the electron slows down and, as a result of this deceleration, a Bremsstrahlung photon is emitted. The energy of the BS photon is hn=K – K0, where K and K0 stand for the kinetic energy of the electron before and after the collision. An electron usually will make many colli-sions, and therefore emit many different photons, before it is brought to rest. As a consequence the wavelength of the photons will range from very large values cor-responding to tiny energy losses up to a minimum wavelengthlmin corresponding to the maximum energy loss (K – K0 = K) if the electron loses all its energy in a single encounter. For this reason, the wavelength distribution of the BS photons is continuous and ranges from lmin to infinity (for K – K0 → 0), with lmin given
by: lmin = h · c hnmax = h · c K = h · c Emax , (I.5)
where Emax = e · U, e stands for the elementary charge and U represents the value
of the high voltage at which the X-ray tube is operated.
The intensity of the BS radiation emitted by a Coolidge X-ray tube as a function of the wavelength can be deduced from the following empirical formula [22]:
I(l) = C · Z · 1 l2 · ( 1 lmin – 1 l) + B · Z2· 1 l2, (I.6)
where Z is the atomic number of the anode element and C and B are constants with C B. The BS intensity as a function of the energy is then given by:
I(E) = C · Z · E
2
h3 · c3 · (Emax– E) + B · Z
2· E2
h2· c2. (I.7)
The efficiency e of the X-ray tube which is defined as the ratio of the emitted BS power to the absorbed electron power can be written approximately as [22]:
e ∼= 1.4 · 10–9[V–1] · Z · U. (I.8) Using Eq. I.8 one sees that for a Au anode X-ray tube operated at 90 kV, the efficiency is only about 1% so that 99% of the electron energy turns into heat energy. This explains why it is important to cool down the anode. From the same equation, on can derive the emitted BS power:
PBS ∼= 1.4 · 10–9[V–1] · Z · i · U2, (I.9)
where i stands for the anode current in the X-ray tube. The emitted BS power is thus proportional to the anode current and to the squared high-voltage of the tube.
Figure I.4 – (a) Measured X-ray spectrum from a Cu anode X-ray tube
operated at 20 kV. One can see the continuous Bremsstrahlung as well as the superimposed characteristic K X-ray emission. As expected the intensity of the Bremsstrahlung tends to zero at 20 keV. The cutoff below 3.5 keV is due to the absorption of low energy X-rays in the Be window of the tube. For the same reason, the characteristic L X-ray emission at about 1 keV is not observed. (b) Detailed view of the photon energy range from 7.5 to 9.5 keV
with the characteristic Cu Ka and Kb emission lines (the Bremsstrahlung
was subtracted beforehand). The two plots were taken from Ref. [23].
If the kinetic energy of the accelerated electrons is bigger than the absolute value of the electron binding energies of the core levels of the anode atoms, the latter can be ionized, which leads to the emission of sharp characteristic X-ray lines. The narrow characteristic X-ray emission is superimposed to the continuous BS emission. The BS and characteristic X-rays are emitted through a thin Be window placed usually on the side of the X-ray tube nose in front of the anode (side window X-ray tubes). Depending on the power of the X-ray tube, the thickness of the Be window ranges from 150 mm to 1 mm. For illustration, the characteristic and BS X-ray emission from a Cu anode side window Coolidge X-ray tube operated at 20 kV is shown in Fig. I.4 (a). A more detailed view of the characteristic Ka and Kb X-ray lines at 8.04 and 8.91 keV, respectively, is shown in Fig. I.4 (b)
Synchrotron radiation sources
The most prominent technical development that allowed XAS to become a rou-tine experimental tool is the third-generation synchrotron radiation (SR) source. The characteristics of such a photon source match indeed perfectly the conditions required by the XAS technique, namely:
• the coverage of a wide photon energy range and the energy tunability of the beam to allow XAFS measurements at the K-, L- and M-edges of elements
across the periodic table;
• the need of monochromatic X-rays with a relative energy resolution of about 10–4 to permit the observation of the XANES and EXAFS fines structures;
• the need of high photon fluxes to get good statistics spectra in short times; • the need of collimated beams to get reliable results in the transmission
method or focused beams to investigate micro-size samples.
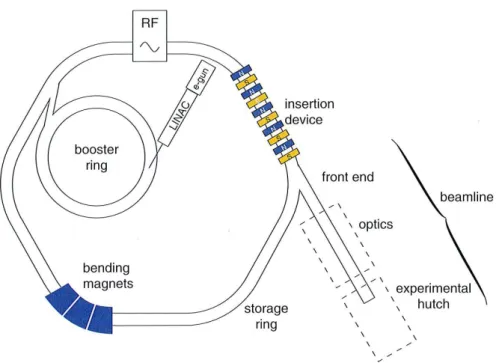
At the present time more than 75 synchrotron radiation facilities located in 23 countries are available for users [24]. The basic design of third-generation syn-chrotron radiation sources is depicted in Fig. I.5. The electrons produced by an electron gun are first accelerated in a linear accelerator (linac) up to an energy of several MeV and then injected into the main accelerator (booster), a synchrotron, where they acquire their final energy of several GeV. The electrons are accelerated by means of radiofrequency (RF) cavities. The latter transform also the contin-uous beam produced by the electron gun in a few cm-long packets or bunches of electrons. The electron bunches after reaching the final energy are injected in the storage ring where they can stay for several hours. Although the vacuum in the storage ring is high (about 10–10 mb), the average electron beam inten-sity is slowly decreasing, due to collisions between the electrons and residual gaz molecules. When the intensity reaches some fraction (e.g., 50%) of the initial in-tensity, the beam is dumped and new bunches are injected from the booster into the storage ring to retrieve the nominal intensity. During this operation, called refill, SR beams are not available for users. At other facilities like the Swiss Light Source (SLS), in Villigen, there is no refill, the electron beam intensity losses be-ing compensated continuously by the injection of new electron bunches which are simply added to those already circulating.
The velocity of the electrons circulating in the storage ring is given by: v = s 1 – 1 g2 · c ∼= (1 – 1 2g2) · c, (I.10)
where c is the speed of light in vacuum and g the Lorentz factor which can be written as: g = K + m · c2 m · c2 ∼ = K m · c2 ∼ = 1957 · K[GeV]. (I.11)
In the above equation, K stands for the kinetic energy of the electrons and m · c2 for the rest mass energy of the latter (511 keV). From the equations I.10 and
Figure I.5 – Schematic drawing of a third-generation synchrotron radiation
facility showing the most important components (reproduced from Ref. [25]).
I.11 one finds that for a beam energy of 6 GeV like at the ESRF the difference 1-b, where b stands for the reduced velocity v/c of the electrons, amounts only to 4 · 10–9. This explains why the electrons circulating in the storage ring are said ultra-relativistic. To bend the trajectory of the electrons towards the center of the storage ring and force them to circulate in a closed orbit inside the latter, dipole bending magnets are used. Dipole magnets inducing some beam divergence, the latter is compensated with quadrupole magnets. The linear parts of the electron trajectory between two consecutive bending magnets are called straight sections. The storage ring can be operated in the multi-bunch mode (several hundreds of bunches simultaneously in the storage ring), few bunch mode (e.g., 16 bunch mode at the ESRF) or even single bunch mode.
The trajectory of the electrons traveling through the magnetic field of a bending magnet is curved due to the Lorentz force. As the electron is a charged particle and the change of its velocity direction corresponds to a centripetal acceleration, the electron deflection is accompanied by the emission of an electromagnetic radiation. The latter named synchrotron radiation (SR) is similar to the Bremsstrahlung of an X-ray tube (both types of radiation are characterized by a continuous wave-length/energy spectrum) but in the BS the radiation is predominantly due to the deceleration of the electrons, i.e., to the diminution of the magnitude of the elec-tron velocity, whereas in the case of SR the photons are emitted as a result of the
Figure I.6 – Schematic diagram of an insertion device showing the
”wiggling” trajectory of the electrons. jh and jv represent the angular
spreads of the radiation in the horizontal and vertical planes (reproduced from Ref. [25]).
change of the electron velocity direction, the magnitude of the velocity remaining, however, nearly the same. Another difference between BS and SR is that the an-gular distribution of the BS radiation is isotropic, whereas for SR, according to relativistic electrodynamics, the photons are emitted in the direction of the elec-tron motion within a narrow cone having an angular aperture equal (in radian) to the inverse of the Lorentz factor g [26]. This means that for 6 GeV electrons the produced SR beam has a divergence as small as 85 mrad. A further difference between BS and SR, maybe the most important one, resides in the magnitude of the so-called brilliance which is 104 to 1010 times higher for SR. The brilliance gives the number of photons emitted per second by a 1 mm2 source within a solid angle of 1 mrad2 and an energy bandwidth of 1%. The source size is given by the cross section of the electron bunches in the center of the magnet. Furthermore, due to the bunch structure of the electrons in the storage ring, SR is emitted as about 70 ps long pulses with a repetition rate varying approximately between 1 MHz (single bunch mode) and 500 MHz (multi-bunch mode).
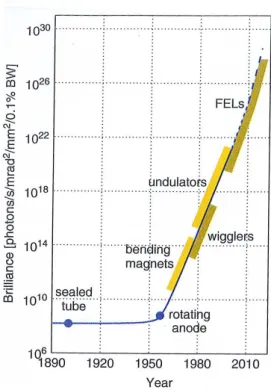
The brilliance of SR radiation sources can be further increased by replacing the bending magnets with wigglers or undulators. Wigglers and undulators are also called insertion devices (ID) because they are inserted in the straight sections of the storage ring. They consist of periodic arrays of magnets designed to produce a series of oscillations of the electrons around their otherwise straight trajectories (see Fig. I.6). The distance between two consecutive magnets determines the so-called ID period. The electrons whose trajectories are ”wiggled” by an insertion
Figure I.7 – Historical graph showing the enormous increase in brilliance
of X-ray sources as a function of their date of availability (reproduced from Ref. [25]).
device emit synchrotron radiation along the axis of the device. In the case of a wiggler, there is no coherence between the radiation emitted by the individual electron ”wiggles” so that the total SR flux is equivalent to that of a single bending magnet multiplied by two times the number of periods of the magnet array. In the case of undulators, the radiation is emitted coherently by each electron ”wiggle” so that the total flux is equivalent to that of a single bending magnet multiplied by the number of periods squared [25]. As the number of periods is always bigger than 2, undulators provide photons beams with significantly higher brilliances than wigglers (see Fig. I.7). To compensate the energy losses of the electron produced by the SR emission, one or several RF cavities are inserted in the storage ring. The beam lines which give access to the users to the radiation produced by the bending magnets or insertion devices are positioned downstream along the axis of the SR emission. Each beam line consists of an optical hutch and an experimental hutch. The optical hutch which is connected to the storage ring via the front end shutter contains the X-ray optics elements needed to prepare the SR beam according to the specific requirements of the users: vertical and horizontal slits to define the size of the beam, mirrors to cut the radiation corresponding to upper
harmonics, crystal or multilayer monochromators to select the energy of interest and focusing elements such as Fresnel lenses or Kirkpatrik mirrors for experiments requiring micro- or nano-size beam spots. The samples, the detector systems and part of the data acquisition electronics are installed in the experimental hutch. In contrast to the optical hutch whose access is usually restricted to the sole beam line staff, the entry to the experimental hutch is authorized for users, provided that the front end shutter is closed. The computers and electronics needed to tune the SR beam (energy, position and size), adjust the position of the sample and acquire the data are located in general in a separate hutch, namely the counting room, from where the users control online the data acquisition.
As mentioned above, the pulse length of SR is in the order of 100 ps. This is too long to investigate processes with characteristic times under a picosecond such as the vibrational motion in molecules or photochemical reactions. The problem has been solved by the development of fourth-generation X-ray sources, namely the so-called X-ray free electron lasers (XFELs) that produce intense, nano-focused and coherent femtosecond X-ray pulses. XFELs have brought a revolution in the field of ultrafast time-resolved X-ray measurements. They also give access for the users to non linear X-ray processes. The first hard X-ray free electron laser source, the Linac Coherent Light Source (LCLS), which was built on the campus of the University of Stanford, is in operation since April 2009 [27]. Presently other XFEL sources are operational in Japan (SACLA/SPring-8 in Harima Science Park City) and in Italy (FERMI/Elettra in Trieste). Other ones such as the SwissFEL facility at PSI and the European XFEL at DESY (Hamburg) will be set into operation in 2017. The typical brilliances of different X-ray sources are presented for comparison in Fig. I.7.
I.2
Double 1s vacancy states produced by impact
with electrons
I.2.1
Production of hollow K-shell atoms
The double K-shell ionization of neutral elements leads to the production of so-called hollow K-shell atoms, i.e., atoms with an empty K-shell while the other outer shells are occupied. The double K-shell ionization can be produced by collisions with energetic heavy ions (HI) (see, e.g., [28]), light charged particles such as a
particles (see, e.g., [29]), protons (see, e.g., [30]) and electrons (see, e.g., [31]) or by impact with photons (see, e.g., [32]). The recent advent of X-ray free electron laser (XFEL) facilities has given a new boost to the domain of hollow atoms. In this case, the extremely short (10–15 s) and very intense X-ray pulses allow to produce double K-shell vacancy states by the absorption of two photons in the same atom [33–37].
In collisions with charged particles, the ionization results from the Coulomb in-teraction between the incoming projectile and the electrons of the target atom. The ionization cross section is proportional to the squared charge of the projec-tile [38–40]. As the charged projecprojec-tile can interact simultaneously with several bound electrons, after the collision the target atom is left in most cases in a mul-tiply ionized state. The radiative decay of such mulmul-tiply ionized atoms gives rise to complex X-ray spectra characterized by reach satellite and hypersatellite struc-tures. For illustration the K X-ray spectrum of a Fe target bombarded by 179 MeV Ne9+ ions is presented in Fig. I.8.
As shown in Fig. I.8, in the case of heavy-ion bombardment the single and double K-shell ionization is accompanied by a strong additional outer-shells ionization. Whereas the L-shell satellites can be separated from their parent diagram and hypersatellite lines, provided, however, that the measurements are performed by means of high energy resolution spectroscopy, the M-shell satellites cannot be re-solved because their energy shifts are smaller than the natural widths of the parent transitions. This results in energy shifts, broadenings and asymmetric shapes of the diagram and hypersatellite lines. As a consequence, if the aim of the measure-ments is to determine accurately the energies, line widths and relative intensities of K hypersatellites, softer collisions involving photons or light charged projectiles like electrons are preferable. In this case the photon-induced or electron-induced dou-ble K-shell ionization cross sections are several orders of magnitude smaller than those corresponding to HI-induced double K-shell ionization. However, for photons the small cross sections can be compensated by the high number of monochromatic photons delivered by synchrotron radiation facilities (about 1012 ph./s). The same holds for electrons for which currents up to about 100 mA (corresponding to about 6·1014 e–/s) can be currently obtained with standard commercial electron guns. It should be noted here that most commercial electron guns cannot be operated above about 20 kV so that only low-Z elements were investigated [31, 42]. An alternative method for studying the double K-shell ionization induced by electron
Figure I.8 – Fe Ka X-ray spectrum induced by 179 MeV Ne9+ ions. The
first two peaks at about 6391 and 6404 eV correspond to the Ka2 and Ka1
diagram lines, while the broader lines at 6432, 6461 and 6490 eV correspond
to the Ka1,2L–1, Ka1,2L–2 and Ka1,2L–3 satellite lines, respectively, i.e., to
the Ka1,2 lines with one, two or three additional spectator vacancies in the
L-shell. The Kha1,2L0,1,2 hypersatellite lines (at about 6661, 6693 and 6725
eV, respectively) which are represented enlarged in the inset, correspond to X-ray transitions whose initial states are characterized by two vacancies in the K-shell and zero, one and two spectator holes in the L-shell. (Taken from Ref. [41]).
impact consists to replace the electron guns by X-ray tubes that can be operated currently up to 60 kV or higher and use the anodes of the latter as sources of radi-ation. This permits to extend K-hypersatellite measurements induced by electron impact to heavier elements [43, 44].
A further important difference between the double K-shell ionization induced by heavy ions and photons or electrons resides in the projectile threshold energy. Due to the large mass difference between heavy ions and electrons, only a tiny part of the HI linear momentum can be indeed transferred to the bound electron so that the HI kinetic energy should be bigger to a large extent than the absolute value of the binding energy of the 1s electrons. For instance, in the above discussed Ne9+ → Fe collision, the projectile threshold energy for a single K-shell ionization of Fe is found to be about 1.5 MeV, which is more than 200 times bigger than the ionization energy of 1s electrons of Fe. In contrast to that, in the case of ionization induced by electron impact, the whole linear momentum of the projectile can be
transferred to the bound electron because the two collisions partners have the same mass so that the projectile threshold energy is equal to the ionization energy. The same holds for photoionization since the dominant process in this case is the photoelectric effect which becomes possible as soon as the energy of the photon becomes equal or bigger than the ionization energy.
As in the photoelectric effect a single photon interacts with a single electron and because the photon disappears after the interaction, the removal of the second electron requires another process. Actually two different mechanisms contribute to the second ionization, namely the shake [45] and the knock-out (KO) [46] processes. In the shake process, the second electron is removed due to the abrupt change of the atomic potential following the ionization of the first electron. The shaken electron can be ejected into the continuum or promoted into an unfilled outer shell. In the first case, the effect is named shake-off (SO), in the second one shake-up (SU). The SO and SU effects are quantum mechanics effects that can be explained by the overlap of the wave functions of the shaken electron in the initial and final states. To preserve the energy conservation law, the energy needed for the shake effect must be provided by the incoming photon. The shake probability can be calculated within the Sudden Approximation (SA) model [47]. Because the change of the atomic potential should be faster than the atomic relaxation time, the photoelectron must leave the target atom very quickly. This means that in a shake process the energy of the incoming photon should be significantly higher than the double ionization threshold energy. The KO mechanism is a two step process in which the first ionized electron hits a second bound electron which is then ejected from the atom. This electron-electron inelastic scattering process is also named Two-Step-One (TS1) process. The TS1 process is the dominant effect at low photon energies, whereas the shake mechanism prevails at high photon energies [32, 48].
The double ionization induced by impact with electrons can be also explained by the SO/SU and TS1 processes. In the case of electrons, however, a further mechanism, the Two-Step-Two (TS2) process, may contribute to the production of double vacancy states. In the TS2 process, the two bound electrons are ionized by the incoming electron via two consecutive inelastic scattering processes. As for photons, the SO/SU, TS1 and TS2 processes are energetically allowed only if the energy needed to ionize the second bound electron is provided by the incoming electron. In other words, the electron-induced double K-shell ionization requires
that the kinetic energy of the incoming electron should be bigger or equal to the threshold energy for the double 1s ionization.
I.2.2
Hypersatellite X-ray transitions
The radiative decay of hollow K-shell atoms leads to the emission of so-called Ka and Kb hypersatellite X-ray lines. Hypersatellite transitions were observed for the first time by Charpak [49] in 1953 but the first theoretical study of the radiative decay of atoms with an empty K-shell is about 30 years older since this pioneering work was already carried out in 1925 by Heisenberg [50].
Transitions decaying doubly ionized atoms are shifted towards higher energies as compared to diagram transitions decaying atoms with a single vacancy. The vacancy which is not filled by the radiative transition is called spectator vacancy because the latter is not directly involved in the transition. The energy shift is due to the diminution of the electron screening originating from the spectator vacancy. This diminution of the electronic screening leads to enhanced binding energies for all atomic levels but the enhancement diminishes with the principal quantum number of the atomic level, which results into a net increase of the transition energy. Moreover, the measurements show that the energy shifts of X-ray lines emitted by doubly-ionized atoms decrease with the principal quantum number of the shell where the spectator vacancy is located. As a consequence, satellites with the spectator vacancy in the L-shell are more shifted than satellites with the spectator hole in the M-shell, which in turn are more shifted than satellites with the spectator hole in the N-shell, and so on. The strongest energy shift is thus observed when the spectator vacancy is located in the same shell as the initial vacancy. In this case the shift is much bigger than the one observed for other satellites and, for this reason, it was proposed by Briand [51] to name hypersatellites these most shifted satellites. The measurements show also that the energy shifts of X-ray satellites increase with the principal quantum number of the shell from which the transition electron originates. This explains why satellites and hypersatellites of Kb X-ray lines (K–1-M–1transitions) are more shifted than those of Ka X-ray lines (K–1-L–1 transitions).
The diagram Ka1,2 and hypersatellite Kha1,2 transitions are represented in Fig. I.9. The transition probabilities per electron of the Ka1 and Ka2 transitions are nearly the same so that, due to the fact that the 2p3/2 subshell contains 4 elec-trons and the 2p1/2 only 2, the I(Ka1)/I(Ka2) intensity ratio is about 2 for all
elements throughout the periodic table. This is no more true for hypersatellite transitions because the Kha1 hypersatellite which corresponds to the 1S0 - 3P1
spin-flip transition (DS=1) is forbidden by the E1 selection rules in the pure LS coupling. The Kha1 transition is, however, allowed in the jj coupling. On the other hand, the Kha2 hypersatellite which corresponds to the1S0 -1P1 transition
(DS=0, i.e., no spin flip) is allowed by the E1 selection rules in both coupling schemes. Thus, for hypersatellites the I(Kha1)/I(Kha2) intensity ratio is nearly
zero for light elements, for which the LS coupling scheme prevails, while tending to the value of 2 for heavy elements which are governed by the jj coupling scheme. In the case of mid heavy elements for which the intermediate coupling scheme ap-plies, the I(Kha1)/I(Kha2) intensity ratio grows progressively between these two
extremes as a function of the atomic number Z. Exactly the same holds for the I(Khb1)/I(Khb3) yield ratio since the Khb1 hypersatellite corresponds again to the
spin-flip transition1S0 -3P1 which is forbidden by the E1 selection rules in the LS coupling scheme and thus not observable for light elements, whereas the transition corresponding to the Khb3 hypersatellite is allowed in both the LS and jj coupling
schemes.
Figure I.9 – Schematic illustration of the (a) Ka1 and Ka2 diagram
Accurate measurements of hypersatellite energies represent a powerful tool to probe the goodness of atomic structure calculations. Energies of hypersatellite transitions are indeed more sensitive than diagram transitions to the Breit inter-action, relativistic effects and quantum electrodynamics (QED) corrections. From the hypersatellite-to-diagram line yield ratios, the double-to-single K-shell ioniza-tion cross secioniza-tion ratios PKK can be derived. In the case of DPI the PKK ratios were investigated carefully [32] because many results from SR-based measurements are available in the literature. For electron-induced double K-shell ionization, how-ever, PKKvalues are scarce and only available for few light elements [31,42,52–54]. Furthermore, as mentioned above, the I(Kha1)/I(Kha2) intensity ratio varies as a function of the atomic number Z from 0 to 2, allowing thus to probe the interme-diacy of the coupling scheme across the periodic table [29, 44]. Finally, the natural line widths of K hypersatellite X-ray lines permit to determine the mean lifetimes of double 1s vacancy states and to compare the latter to theoretical predictions. In the present study, the Ka hypersatellite X-ray spectra of Sc (Z=21), Cr (Z=24) and Cu (Z=29) induced by electron impact were measured by means of high energy resolution spectroscopy. For the lightest element, the extremely weak Kb hyper-satellite could also be measured. As for electrons the maximum ionization cross section is observed at energies that are about 2 times bigger than the ionization threshold, for each element the electron kinetic energy was chosen to be around 2 times bigger than the threshold energy for the double 1s ionization. The energy shifts of the hypersatellites with respect to their parent diagram lines and their natural line widths were determined and compared to existing experimental and theoretical data. The double-to-single-ionization cross section ratios PKK were derived from the measured relative intensities of the hypersatellites and compared to other PKK values found in the literature for electrons and photons.
I.3
Chemical sensitivity of photoinduced K
b
hy-persatellite transitions in Cr compounds
Third-generation synchrotron radiation (SR) facilities have boosted the develop-ment of high-energy resolution X-ray spectroscopic techniques, such as X-ray emis-sion (XES), resonant inelastic X-ray scattering (RIXS), high energy resolution fluorescence detected X-ray absorption (HERFD-XAS), partial fluorescence yield (PFY) XAS and X-ray Raman spectroscopy (XRS). X-ray emission spectroscopy
of inner-core and valence-to-core (VtC) transitions in resonant and non-resonant excitation conditions is a powerful technique to probe the electronic structure and chemical state of matter [55–60]. In the soft X-ray regime XES is a popular tech-nique because of its utech-nique capabilities to investigate transition metal oxides and surface chemistry of adsorbates [61] [62, 63]. Because of the penetrating properties of hard X-rays, hard X-ray emission has more advantages over soft X-ray emis-sion in terms of sample environment (temperature, pressure, gas feed) allowing for in – situ experiments [55, 64]. Over the past years numerous studies have been performed on transition metal complexes, important enzymes, geometrical com-pounds and catalytic systems using high-energy resolution X-ray spectroscopic techniques [57, 60, 64–74].
High-energy resolution and high collection efficiency are prerequisite in order to measure X-ray line energy shifts of few eV or less, as well as to evince small variations in ray line intensities and spectral shapes. Efficient collection of X-rays with high-energy resolution can be achieved by using curved-crystal X-ray spectrometers. For hard X-ray radiation Bragg-type perfect-crystal X-ray optics are commonly used. First Bragg-type curved-crystal spectrometer designs were presented in 1930s by Johann [75], Johansson [76], and von Hamos [77]. In the case of the Johann and Johannson geometry a point-to-point focusing scheme is realized, where both the crystal analyzer and the detector are moved, whereas the von Hamos geometry allows collecting a spectrum over a certain energy bandwidth without moving any parts. Non-dispersive or vertical focusing corresponds to the von Hamos geometry and for the dispersive or horizontal focusing to the Johann or Johansson geometries. The best focusing conditions with bent crystals were first described by DuMond and Kirkpatrick in 1930 [78]. More details on the early developments of curved-crystal spectrometers can be found in DuMond and Chap [79] and Knowles and Chap [80]. The Rowland-circle based Johann and Johannson geometries, as well as the von Hamos geometry are used today to construct curved-crystal X-ray spectrometers. Various hard X-ray spectrometers based on Bragg reflections from single or multiple perfect crystals have been developed [81, 82, 82– 92]. Nowadays, several synchrotron facilities offer hard X-ray beam lines which are equipped with high resolution multi-crystal spectrometers [55, 84, 85, 88, 90, 93–99].
Figure I.10 – Schematic illustration for the (a) Kb1, Kb3, Kb2 and Kb5
transitions and (b) Khb1- and Khb3-hypersatellite transitions.
For 3d transition metals and its compounds the Kb X-ray emission spectra pro-vide information on the electronic structure, oxidation state, ligand type and metal-ligand bond length, and spin state. A schematic of the Kb1, Kb3, Kb2 and Kb5 and the hypersatellite Khb1,3 transitions is represented in Fig. I.10.
The solid- and chemical-effects on the Kb1,3 diagram and the Kb2,5 VtC
tran-sitions are well known, and numerous measurements of the Kb X-ray emission spectra of 3d transition metals have been performed using synchrotron radiation, proton, electron and heavy ion excitations to investigate the energy shifts, inten-sity ratios, relative positions and widths of the elements and their chemical com-pounds [55,57,59,100–110]. In contrast, the sensitivity of the Khb1,3 hypersatellite
transitions to chemical-effects has not been explored. High energy resolution data for photoinduced hypersatellite Khb1,3 transtions are scarse because of the low double K-shell photoionization cross sections [32, 48, 111], and transition yields (e.g., for Cr the intensity ratio of Khb to the strongest diagram transition Ka is only about 5×10⁻⁵). Hitherto, only two high-resolution measurements of the Khb1,3 hypersatellite transitions induced by photon impact have been published,
those of Diamant et al. [112] for elemental Fe and of Huotari et al. [113] for Ti metal.
The objective of this work was thus to investigate the influence of the chemical state on the Khb1,3 hypersatellite spectra of Cr induced by single-photon double K-shell ionization. The Kb-hypersatellite, and also the Kb1,3 diagram and VtC spectra
of metallic Cr and Cr compounds were measured with the 7-crystal Johann-type hard X-ray spectrometer [92] at the Stanford Synchrotron Radiation Lightsource (SSRL) by applying the high-resolution XES spectroscopy technique. The chemical effects on the energies, intensities, shapes, and widths of Kb X-ray emission spectra were investigated for Cr in four nominal oxidation states: Cr (Cr0), Cr2O3 (Cr3+),
CrO2 (Cr4+) and K2Cr2O7(Cr6+). Chemical speciation of chromium is important
as it is widely used in chemical industry and also because its two common oxidation states Cr3+ and Cr6+ appearing in nature are toxic, where Cr6+ ion is about one hundred times more toxic than Cr3+ [96]. The Cr4+ ion has also gained interest since CrO2 was found to be a half-metallic ferromagnet [114, 115] and it has many applications in speed sensors, read sensors for magnetic disc drives, random access memories for computers and new generation of spintronic devices [116–120]. Further, high resolution XES data of Kb-hypersatellites allow for a stringent comparison with atomic structure calculations.
Laboratory-based XAS
measurements with a von
Hamos curved crystal
spectrometer
II.1
Preamble
X-Ray absorption fine structure spectroscopy is widely applied at synchrotron ra-diation sources where the bright, coherent, micro-focused, time-resolved, energy tunable and monochromatic X-ray beams are routinely used to analyze samples from different disciplines such as physics [121–124], chemistry [125, 126], environ-mental sciences [127], geology [128], cultural heritage [129], archeology [130] and biomedicine [131]. For external users, however, the access to such advanced re-search facilities is not so easy. For each experiment a proposal should be indeed submitted and if accepted the allotted beam time is only available several months after the proposal acceptance. In addition, the available beam time is usually lim-ited to several days. It can be also noted that many XAFS applications which do not really require fine focus, high flux and time resolved X-ray beams are neverthe-less performed in most cases at SR facilities because of the lack of any alternative.
However, alternative methods for XAFS measurements that do not need the full performance of SR beam lines do exist. They are provided by laboratory-based setups which offer the advantages of lower costs and better accessibility. Although such setups using conventional X-ray sources have played an important role in the early development of the XAFS technique [132–135], only sporadic in-house XAFS applications have been reported in the literature [136–146] since the ad-vent of third-generation SR sources. More recently a laboratory-based hard X-ray monochromator for high-resolution XES and XANES measurements and a setup for single shot XANES measurements in the laboratory were developed at the Uni-versity of Washington [147] and the UniUni-versity of Berlin [148], respectively. The possibility to use a DuMond curved crystal spectrometer as a monochromator for XAFS measurements around the K-edges of mid heavy elements such as Mo was also demonstrated [149, 150]. In the present work, we discuss an experimental setup based on a von Hamos curved crystal spectrometer and a side-window X-ray tube for laboratory-based XAFS measurements around the K-edges of elements with 11≤ Z ≤ 40, L-edges of elements with 30≤ Z ≤ 82 and M-edges of elements with Z ≥ 60.
II.2
Experimental setup and methodology
The new laboratory-based setup for X-ray absorption spectroscopy measurements is based on the von Hamos curved crystal spectrometer of Fribourg [151] which was developed about 20 years ago for high-resolution XES measurements. The spectrometer can be employed for in-house projects using X-ray tubes or electron guns for the production of the sample fluorescence. Thanks to its compactness, the spectrometer can be also transported and installed at external big facilities for projects requiring synchrotron radiation or heavy-ion beams. As this Bragg-type bent crystal X-ray spectrometer represents the key part of the new XAFS setup, its working principles and main characteristics are briefly outlined in the next subsection.
II.2.1
Von Hamos crystal spectrometer
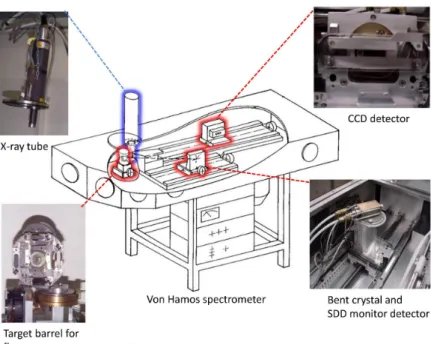
Figure II.1 – Schematic drawing of the von Hamos spectrometer. The main
components are represented in the different insets.
As shown in Fig.II.1, the spectrometer consists of an effective X-ray source defined by a vertical rectangular Ta slit placed in front of the sample, a cylindrically bent crystal and a position sensitive CCD detector. The sample-slit system, crystal and detector are enclosed in a 180 cm long × 62 cm wide × 24.5 cm high stainless steel
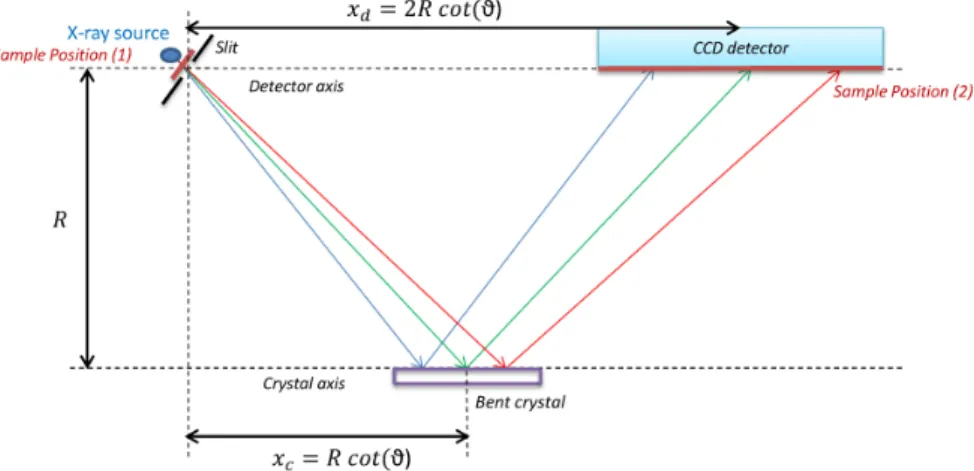
vacuum chamber which can be pumped down to 10–6 mbar by means of a turbo-molecular pump. On the top of the chamber three circular flanges give access to the sample, crystal and detector. Additional flanges are located on the side wall to connect the spectrometer under different angles to the beam line at external facilities. For in-house measurements, the X-ray tube is mounted on the flange located above the target chamber and the electron gun on the first beam port. In the von Hamos geometry [152] the crystal is bent cylindrically around a hor-izontal axis parallel to the direction of dispersion and provides focusing in the vertical direction. The front surface of the detector, the slit center and the axis of curvature of the crystal are all contained in the same vertical plane. The slit-to-crystal and crystal-to-detector distances are equal. For given fixed positions of the crystal and detector, a certain angular range which is determined mainly by the extension of the CCD detector along the dispersion direction is covered by the crystal so that a certain energy range (30-300 eV depending on the Bragg angle and employed crystal) can be measured at once in a scanless mode of operation. To cover a wider energy domain, the crystal and detector are moved along their translation axis, the detector twice as much as the crystal but the position of the slit remains unchanged. The Bragg angles that can be covered with the von Hamos spectrometer of Fribourg vary between 24.4◦ and 61.1◦. With the use of different crystals whose radius of curvature is 25.4 cm, the energy range covered by the spectrometer extends theoretically from 0.6 keV to 16.7 keV but due the low efficiency of the CCD detector at low and high photon energies, the spectrometer is normally used between 1 keV and 15 keV.
The translations of the crystal and detector (see Fig. II.2) are achieved via threaded spindles driven by remote-controlled stepping motors. For each axis, one motor step produces a displacement of 5 mm. For a given photon energy E, the distance xc between the crystal center and the slit, measured along the dispersion
axis, is given by:
xc= R · cot(ϑ), (II.1)
where R stands for the radius of curvature of the crystal and ϑ for the Bragg angle. The latter can be deduced from the Bragg law [153]:
ϑ = Arcsin ( 12.398[keV · Å] · n 2dhk`[Å] · E[keV] ) , (II.2)