DOI 10.1007/s00421-014-2844-7 OrIgInAl ArtIclE
Kidney‑synthesized erythropoietin is the main source for the
hypoxia‑induced increase in plasma erythropoietin in adult
humans
Anne‑Kristine Meinild Lundby · Stefanie Keiser · Christoph Siebenmann · Leonhard Schäffer · Carsten Lundby
received: 17 October 2013 / Accepted: 3 February 2014 / Published online: 15 February 2014 © Springer-Verlag Berlin Heidelberg 2014
collected at altitude, did not differ from values at sea level, but were markedly lower (p < 0.05) than the mean percent migrated isoform (PMI) for the umbilical cord samples.
Conclusion Our studies demonstrate (1) Uc samples express a different glycoform distribution as compared to adult humans and hence illustrates the ability to synthe-sis EPO in non-kidney cells during fetal development (2) as expected hypoxia augments circulating EPO in adults and the predominant source here for remains being kidney derived.
Keywords EPO · renal · Altitude Abbreviations
EPO Erythropoietin glc-nAc N-acetylglucosamine HA High altitude
MAIIA Membrane-assisted isoform immunoassay PMI Percent migrated isoform
Sl Sea level
WgA Wheat germ agglutinin Uc Umbilical cord
Introduction
Erythropoietin (EPO) governs hemoglobin concentration and thus arterial oxygen content by regulating red blood cell and plasma volumes (Jelkmann 1992; lundby et al.
2007; Olsen et al. 2011). the classic view is that hypoxia stimulates the synthesis and release of EPO in renal peri-tubular fibroblasts. Work based on HIF-1 knock-out mice however suggested that astrocytes, which express both EPO and its receptor (Bernaudin et al. 2000), may contribute by as much as 50 % to the hypoxia-induced increase in plasma
Abstract
Purpose Erythropoietin (EPO) is mainly synthesized within renal peritubular fibroblasts, and also other tis-sues such as the liver possess the ability. However, to what extent non-kidney produced EPO contributes to the hypoxia-induced increase in circulating EPO in adult humans remains unclear.
Methods We aimed to quantify this by assessing the dis-tribution of EPO glycoforms which are characterized by posttranslational glycosylation patterns specific to the synthesizing cell. the analysis was performed on samples obtained in seven healthy volunteers before, during and after 1 month of sojourn at 3,454 m altitude.
Results Umbilical cord (Uc) plasma served as control. As expected a peak (p < 0.05) in urine (2.3 ± 0.5-fold) and plasma (3.3 ± 0.5-fold) EPO was observed on day 1 of high-altitude exposure, and thereafter the concentra-tion decreased for the urine sample obtained after 26 days at altitude, but remained elevated (p < 0.05) by 1.5 ± 0.2-fold above the initial sea level value for the plasma sample. the EPO glycoform heterogeneity, in the urine samples
communicated by guido Ferretti.
A.-K. M. lundby · S. Keiser · c. Siebenmann · c. lundby (*) center for Integrative Human Physiology, Institute of Physiology, University of Zürich, Winterthurerstrasse 190, 8057, Zürich, Switzerland
e-mail: [email protected] l. Schäffer
Department of Obstetrics, University Hospital Zürich, Zürich, Switzerland
c. lundby
Food and nutrition and Sport Science, gothenburg University, gothenburg, Sweden
EPO (Weidemann et al. 2009). In divergence hereto we observed no detectable release of EPO from the hypoxic human brain to the blood stream or to cerebral spinal fluid (rasmussen et al. 2012). In contrast to the HIF-1 knock-out study, however, the samples were obtained after 4 and 8 h of hypoxic exposure when the erythropoietic response to hypoxia may not yet have reached its peak, which is usu-ally reached within the first 1–3 days of exposure (robach et al. 2007).
Besides astrocytes (Masuda et al. 1994) EPO may also be synthesized in the liver and based on EPO mrnA analysis it is generally accepted that this is the main site for EPO production during gestation (Dame et al. 1998; Ohls 2002). Adult rodent liver retains its ability to produce EPO in response to hypoxia or HIF activation (Fried 1972; Kapitsinou et al. 2010; Minamishima and Kaelin 2010). Other cells have also been demonstrated to be capable of synthesizing EPO although only in minor quantities (Haase
2010) and accordingly nephrectomized humans demon-strate elevated EPO levels (Mirand et al. 1968). However, to what extent these non-renal EPO production sites con-tribute to the hypoxia-induced increase in plasma EPO in adult humans remains elusive. Since the posttranslational glycosylation patterns of the different EPO glycoforms are specific to their synthesizing cells (lönnberg et al. 2013; Masuda et al. 1994; Wide and Bengtsson 1990), the con-tribution of the various synthesizing cells to the circulating EPO concentration can be determined by analysis hereof. In the present study, we analyzed EPO glycoform compo-sition of healthy humans exposed to altitude for 1 month and thereby evaluated the contribution of EPO originating from non-kidney cells to the hypoxia-dependent increase in circulating EPO. As control we used EPO purified from umbilical cord (Uc) samples since the glycosylation pat-tern observed here most likely differentiates from that seen in adults (Wide and Bengtsson 1990). Based on our previ-ous study conducted in acute hypoxia (rasmussen et al.
2012), we hypothesized that EPO originating from the kidney will remain the main source for circulating EPO in hypoxic adult humans.
Methods
Seven healthy male sea-level dwellers with no exposure to altitudes above 2,000 m for the last 4 weeks (26 ± 4 years; 180 ± 1 cm; 76 ± 6 kg) participated in this study which was approved by the Ethical committee for the Eidgenös-sische technische Hochschule Zürich (EK 2011-n-51) and conducted in accordance with the declaration of Helsinki. Prior to the start of the experiments, informed oral and written consents were obtained. After baseline sampling in Zürich (480 m) all subjects were transported by train to
the Jungfraujoch research Station (3,454 m, Bernese Alps, Switzerland) where they stayed for 4 consecutive weeks. the facilities provide normal living conditions, comfort-able room temperatures and access to food as consumed at sea level.
Urine and venous plasma samples were collected from all subjects at sea level (Sl), and then after 1 (HA1; 17 ± 1 h), 3 (HA3; 65 ± 1 h) and 26 (HA26) days of alti-tude exposure, and again after 7 (Sl + 7) and 14 (Sl + 14) days upon return to sea level. All samples were stored at
−80 °c.
total plasma EPO concentrations were determined by means of a solid-phase sandwich ElISA kit and concentra-tions were determined based on the standard provided with the kit (Human Erythropoietin Quantikine IVD ElISA Kit, Quantikine, r&D Systems, Minneapolis, USA). total urine EPO concentrations were determined by membrane-assisted isoform immunoassay (MAIIA) (EPO Quantifi-cation Urine Kit, MAIIA Diagnostics, Uppsala, Sweden) as specified by the manufacturer. In short, 0.5 ml of each urine sample was desalted and the EPO concentration determined by lateral flow immunoassay (lönnberg et al.
2008): As reference, a dilution series of epoetin β (provided in the kit) ranging from 3 to 1,000 ng l−1 was measured
by the MAIIA method; the obtained standard curve was fit-ted with a four-parameter logistic routine and from this the EPO concentrations in the urine samples were calculated (lönnberg et al. 2012a).
the glycoform heterogeneity of the samples was ana-lyzed by an EPO WgA MAIIA kit (MAIIA Diagnos-tics, Uppsala, Sweden) that previously have been used for detection of recombinant EPO in humans and horses (lönnberg et al. 2012b; lönnberg and lundby 2013; Mørkeberg et al. 2013). In the present study we included umbilical cord (Uc) plasma, which is known to con-tain mainly liver-derived EPO (Dame et al. 1998; Ohls
2002), as positive control for non-renal-derived EPO. For detailed description of the procedure refer to lönnberg et al. (2012a). In brief, EPO from six Uc plasma samples (2 ml) and from the urine samples (20 ml) obtained at Sl, HA1, HA3 and HA26 were purified on single-use anti-EPO columns (anti-EPO Purification Kit, MAIIA Diagnostics, Uppsala, Sweden) according to the directions of use. the average purification efficiency for the urine samples was 65 ± 10 %.
the EPO WgA MAIIA isoform distribution kit is based on affinity chromatography—with immobilized lectins [wheat germ agglutinin (WgA)] interacting with the gly-cosylated EPO forms and N-acetylglucosamine (glc-nAc) used as competing sugar—in combination with lateral flow immunoassay. We established the optimal glc-nAc concentration to be used in the elution buffer low by run-ning pilot experiments at four different low glc-nAc
concentrations (5, 10 15, and 20 mM) and one high glc-nAc concentration (300 mM) on samples containing EPO purified from Uc and urine. Epoetin β provided in the kit was included in all experiments and was used as reference (lönnberg et al. 2012a). For the final determination of EPO glycoform distribution in the samples, 5 and 300 mM of glc-nAc were used in the elution buffers low and high, respectively. All samples were run in duplicates and under standardized conditions (e.g. temperature, humidity, using the same scanner and reagent lot number). the percent migrated isoform (PMI) values were calculated as the per-cent of EPO released by the elution buffer low with respect to the total EPO concentration (obtained by elution buffer high).
Results and discussion
Umbilical cord EPO and circulating EPO (urine and plasma) from healthy subjects gave different PMI values at the lower concentrations of glc-nAc (Fig. 1), verifying the difference in glycosylation patterns (EPO glycoforms) depending on the origin of synthesis.
As expected (Berglund et al. 2002; robach et al.
2007; Siebenmann et al. 2012) a peak (p < 0.05) in urine (2.3 ± 0.5-fold) and plasma (3.3 ± 0.5-fold) EPO was observed on HA1 and although reduced from that point remained elevated at HA26 for plasma by 1.5 ± 0.2-fold. One week after return to sea level also the plasma EPO concentrations had returned to Sl values (Fig. 2).
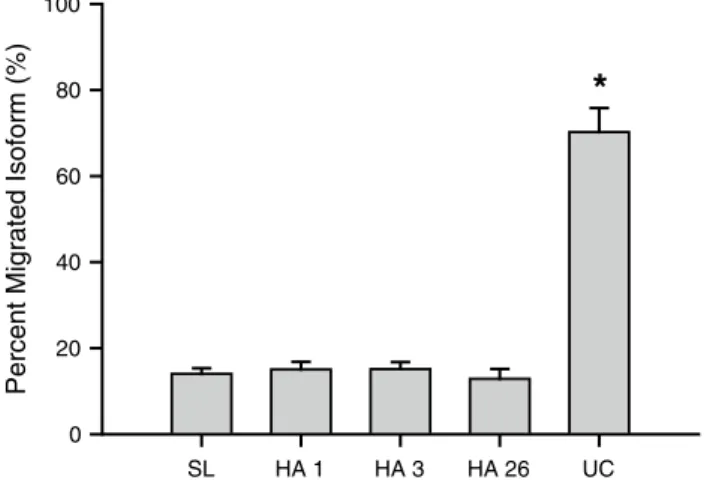
the EPO glycoform heterogeneity, expressed as per-cent migrated isoforms (PMI) (lönnberg et al. 2012a) in the urine samples collected at altitude, did not differ from values at Sl, but were markedly lower (p < 0.05) than the mean PMI for the umbilical cord samples (Fig. 3). Samples containing different EPO glycoforms (e.g. recombinant and endogenous EPO) have PMI values that are intermittent of the “pure glycoforms” (lönnberg et al. 2012a, b, 2008; lönnberg and lundby 2013) and therefore a potential con-tribution of non-renal-derived EPO to the circulating EPO
[Glc-NAc] (mM)
5 10 15 20
Percent Migrated Isoform (%)
0 20 40 60 80 100
Fig. 1 the percent migrated isoform (PMI) values for umbilical cord
EPO (closed circles) and circulating EPO from adults (open circles) when using different glc-nAc concentrations in the elution buffer low. At the low (5 mM) glc-nAc concentration, the difference in PMI between the two EPO glycoforms is greatest and due to differences in glycolation in the two populations of EPO. Values are mean ± SEM, n = 6 for Uc, n = 3 for adults
SL HA 1 HA 3 HA 26 SL+7 SL+14
Plasma EPO (mIU/ml)
0 10 20 30 40 Urine EPO (ng/l) 0 10 20 30 40
*
*
*
*
*
Fig. 2 Plasma (open circles) and urine (filled circles) EPO
concen-trations (mlU ml−1 and ng l−1, respectively) in seven volunteers stud-ied at sea level (Sl) and after 1 (HA1), 3 (HA3) and 26 (HA26) days during exposure to 3,454 m altitude, and again after 7 (Sl + 7) and 14 (Sl + 14) days upon return to sea level. *P < 0.05 as compared to Sl. Values are mean ± SEM
SL HA 1 HA 3 HA 26 UC
Percent Migrated Isoform (%)
0 20 40 60 80 100
*
Fig. 3 EPO glycoform heterogeneity in samples obtained before
and during acclimatization to high altitude. the PMI values are directly related to the glycoform composition of EPO in a given sam-ple. Hence, for the HA samples an increase in PMI value from Sl towards Uc would be a consequence of a sample containing both renal and hepatic EPO. Abbreviations as for Fig. 1. Umbilical cord (Uc) samples are here shown to have marked higher PMI values. *P < 0.05 as compared to the samples obtained in the adult volun-teers. Values are mean ± SEM
should have altered the PMI values when comparing Sl to HA samples. Since this was not the case in the present study, we demonstrate in healthy humans exposed to high-altitude (3,454 m) hypoxia that the predominant source for the rise in plasma EPO is the kidney. Although we did not include a control for cnS-derived EPO in the present study (currently unavailable), it has been shown that brain-derived EPO is less glycosylated than renal-brain-derived EPO (Masuda et al. 1994), and hence an increase in PMI would be expected if more EPO was to be derived from the brain. Our findings are in line with previous studies on dogs, demonstrating that when exposed to 10 % hypoxia, renal venous EPO content was 63 % higher than arterial EPO content (Abbrecht and Malvin 1966). Although this does not exclude a contribution from other cells, the findings suggest a massive contribution of the kidneys to the cir-culating EPO response to hypoxia. When Bernhardt et al. (2010) administrated a prolyl hydroxylase inhibitor, which stabilizes HIF expression, kidney transplant patients dem-onstrated no increase in circulating EPO whereas this was the case in healthy volunteers. thus, also from a biochemi-cal perspective it seems clear that the kidneys are indeed the predominant organs responsible for the synthesis of cir-culating EPO when stimulated by HIF, as expected at high altitude. Our study demonstrates the differences in EPO glycoform distribution in neonatal umbilical cord samples as compared to adults, and thereby extends previous tis-sue mrnA work (Dame et al. 1998; Ohls 2002) suggesting liver cells to be the main site for EPO synthesis during ges-tation. thus, although the human liver in the neonatal state has an important role in the synthesis of EPO and although astrocyte-derived EPO may account for up to 50 % of the erythropoietic response in mice when exposed to hypoxia, this does not seem to be relevant for the circulating EPO levels in healthy adult humans when exposed to continuous hypoxia.
Conflict of interest the authors declare not to have any conflict of
interest with regard to the study.
References
Abbrecht PH, Malvin rl (1966) renal production of erythropoietin in the dog. Am J Physiol 210:237–242
Berglund B, gennser M, Örnhagen H, ÖStberg c, Wide l (2002) Erythropoietin concentrations during 10 days of normobaric hypoxia under controlled environmental circumstances. Acta Physiol Scand 174:225–229
Bernaudin M, Bellail A, Marti HH, Yvon A, Vivien D, Duchatelle I, Mackenzie Et, Petit E (2000) neurons and astrocytes express EPO mrnA: oxygen-sensing mechanisms that involve the redox-state of the brain. glia 30:271–278
Bernhardt WM, Wiesener MS, Scigalla P, chou J, Schmieder rE, günzler V, Eckardt K-U (2010) Inhibition of prolyl hydroxylases
increases erythropoietin production in ESrD. J Am Soc nephrol 21:2151–2156
Dame c, Fahnenstich H, Freitag P, Hofmann D, Abdul-nour t, Bar-tmann P, Fandrey J (1998) Erythropoietin mrnA expression in human fetal and neonatal tissue. Blood 92:3218–3225
Fried W (1972) the liver as a source of extrarenal erythropoietin pro-duction. Blood 40:671–677
Haase VH (2010) Hypoxic regulation of erythropoiesis and iron metabolism. Am J Physiol renal Physiol 299:F1–F13
Jelkmann W (1992) Erythropoietin: structure, control of production, and function. Physiol rev 72:449–489
Kapitsinou PP, liu Q, Unger tl, rha J, Davidoff O, Keith B, Epstein JA, Moores Sl, Erickson-Miller cl, Haase VH (2010) Hepatic HIF-2 regulates erythropoietic responses to hypoxia in renal ane-mia. Blood 116:3039–3048
lönnberg M, lundby c (2013) Detection of EPO injections using a rapid lateral flow isoform test. Anal Bioanal chem. doi:10.1007/ s00216-013-6997-8
lönnberg M, Drevin M, carlsson J (2008) Ultra-sensitive immuno-chromatographic assay for quantitative determination of erythro-poietin. J Immunol Methods 339:236–244
lönnberg M, Andrén M, Birgegård g, Drevin M, garle M, carlsson J (2012a) rapid detection of erythropoiesis-stimulating agents in urine and serum. Anal Biochem 420:101–114
lönnberg M, Bondesson U, cormant F, garcia P, Bonnaire Y, carls-son J, Popot M-A, rollborn n, råsbo K, Bailly-chouriberry l (2012b) Detection of recombinant human EPO administered to horses using MAIIA lateral flow isoform test. Anal Bioanal chem 403:1619–1628
lönnberg M, garle M, lönnberg l, Birgegård g (2013) Patients with anaemia can shift from kidney to liver production of erythro-poietin as shown by glycoform analysis. J Pharm Biomed Anal 81–82:187–192
lundby c, thomsen JJ, Boushel r, Koskolou M, Warberg J, calbet JAl, robach P (2007) Erythropoietin treatment elevates haemo-globin concentration by increasing red cell volume and depress-ing plasma volume. J Physiol 578:309–314
Masuda S, Okano M, Yamagishi K, nagao M, Ueda M, Sasaki r (1994) A novel site of erythropoietin production. Oxygen-dependent production in cultured rat astrocytes. J Biol chem 269:19488–19493
Minamishima YA, Kaelin Wg (2010) reactivation of hepatic EPO synthesis in mice after PHD loss. Science 329:407
Mirand EA, Murphy gP, Steeves rA, Weber HW, rF P (1968) Extra-renal production of erythropoietin in man. Acta Hemaat (Basel) 39:359
Mørkeberg J, Sharpe K, Karstoft K, Ashenden MJ (2013) Detection of microdoses of rhEPO with the MAIIA test. Scand J Med Sci Sports. doi:10.1111/sms.12049
Ohls rK (2002) Erythropoietin and hypoxia inducible factor-1 expression in the mid-trimester human fetus. Acta Paediatr Suppl 91:27–30
Olsen nV, Aachmann-Andersen nJ, Oturai P, Andersen tM, rasmus-sen AB, Hulston c, Holstein-rathlou n-H, robach P, lundby c (2011) recombinant human erythropoietin in humans down-regulates proximal renal tubular reabsorption and causes a fall in glomerular filtration rate. J Physiol 15:1273–1281
rasmussen P, nordsborg n, taudorf S, Sørensen H, Berg rMg, Jacobs rA, Bailey DM, Olsen nV, Secher nH, Møller K, lun-dby c (2012) Brain and skin do not contribute to the systemic rise in erythropoietin during acute hypoxia in humans. FASEB J 26:1831–1834
robach P, cairo g, gelfi c, Bernuzzi F, Pilegaard H, Vigano A, Santambrogio P, cerretelli P, calbet JAl, Moutereau S, lun-dby c (2007) Strong iron demand during hypoxia-induced
erythropoiesis is associated with down-regulation of iron-related proteins and myoglobin in human skeletal muscle. Blood 109:4724–4731
Siebenmann c, robach P, Jacobs rA, rasmussen P, nordsborg n, Diaz V, christ A, Olsen nV, Maggiorini M, lundby c (2012) “live high-train low” using normobaric hypoxia: a double-blinded, placebo-controlled study. J Appl Physiol 112:106–117
Weidemann A, Kerdiles YM, Knaup KX, rafie cA, Boutin At, Stock-mann c, takeda n, Scadeng M, Shih AY, Haase VH, Simon Mc, Kleinfeld D, Johnson rS (2009) the glial cell response is an essential component of hypoxia-induced erythropoiesis in mice. J clin Invest 119:3373–3383
Wide l, Bengtsson c (1990) Molecular charge heterogeneity of human serum erythropoietin. Br J Haematol 76:121–127