HAL Id: hal-00300931
https://hal.archives-ouvertes.fr/hal-00300931
Submitted on 28 Jan 2005HAL is a multi-disciplinary open access
archive for the deposit and dissemination of sci-entific research documents, whether they are pub-lished or not. The documents may come from teaching and research institutions in France or abroad, or from public or private research centers.
L’archive ouverte pluridisciplinaire HAL, est destinée au dépôt et à la diffusion de documents scientifiques de niveau recherche, publiés ou non, émanant des établissements d’enseignement et de recherche français ou étrangers, des laboratoires publics ou privés.
3-D microphysical model studies of Arctic
denitrification: comparison with observations
S. Davies, G. W. Mann, K. S. Carslaw, M. P. Chipperfield, J. A.
Kettleborough, M. L. Santee, H. Oelhaf, G. Wetzel, Y. Sasano, T. Sugita
To cite this version:
S. Davies, G. W. Mann, K. S. Carslaw, M. P. Chipperfield, J. A. Kettleborough, et al.. 3-D microphys-ical model studies of Arctic denitrification: comparison with observations. Atmospheric Chemistry and Physics Discussions, European Geosciences Union, 2005, 5 (1), pp.347-393. �hal-00300931�
ACPD
5, 347–393, 2005 Comparison of modelled and observed Arctic denitrification S. Davies et al. Title Page Abstract Introduction Conclusions References Tables Figures J I J I Back Close Full Screen / EscPrint Version Interactive Discussion
Atmos. Chem. Phys. Discuss., 5, 347–393, 2005 www.atmos-chem-phys.org/acpd/5/347/
SRef-ID: 1680-7375/acpd/2005-5-347 European Geosciences Union
Atmospheric Chemistry and Physics Discussions
3-D microphysical model studies of Arctic
denitrification: comparison with
observations
S. Davies1, G. W. Mann1, K. S. Carslaw1, M. P. Chipperfield1,
J. A. Kettleborough2, M. L. Santee3, H. Oelhaf4, G. Wetzel4, Y. Sasano5, and T. Sugita5
1
Institute for Atmospheric Science, School of Earth and the Environment, University of Leeds, UK
2
Rutherford Appleton Laboratory, Didcot, Oxford, UK
3
Jet Propulsion Laboratory, Pasadena, California, USA
4
Institut f ¨ur Meteorologie und Klimaforschung, Forschungszentrum Karlsruhe, Germany
5
National Institute for Environmental Studies, Ibaraki, Japan
Received: 5 November 2004 – Accepted: 20 December 2004 – Published: 28 January 2005 Correspondence to: S. Davies ([email protected])
ACPD
5, 347–393, 2005 Comparison of modelled and observed Arctic denitrification S. Davies et al. Title Page Abstract Introduction Conclusions References Tables Figures J I J I Back Close Full Screen / EscPrint Version Interactive Discussion
Abstract
Simulations of Arctic denitrification using a 3-D chemistry-microphysics transport model are compared with observations for the winters 1994/1995, 1996/1997 and 1999/2000. The model of Denitrification by Lagrangian Particle Sedimentation (DLAPSE) couples the full chemical scheme of the 3-D chemical transport model,
5
SLIMCAT, with a nitric acid trihydrate (NAT) growth and sedimentation scheme. We use observations from the Microwave Limb Sounder (MLS) and Improved Limb At-mospheric Sounder (ILAS) satellite instruments, the balloon-borne Michelsen Interfer-ometer for Passive Atmospheric Sounding (MIPAS-B), and the in situ NOy instrument on-board the ER-2. As well as directly comparing model results with observations, we
10
also assess the extent to which these observations are able to validate the modelling approach taken. For instance, in 1999/2000 the model captures the temporal develop-ment of denitrification observed by the ER-2 from late January into March. However, in this winter the vortex was already highly denitrified by late January so the obser-vations do not provide a strong constraint on the modelled rate of denitrification. The
15
model also reproduces the MLS observations of denitrification in early February 2000. In 1996/1997 the model captures the timing and magnitude of denitrification as ob-served by ILAS, although the lack of observations north of ∼67◦N make it difficult to constrain the actual timing of onset. The comparison for this winter does not support previous conclusions that denitrification must be caused by an ice-mediated process.
20
In 1994/1995 the model notably underestimates the magnitude of denitrification ob-served during a single balloon flight of the MIPAS-B instrument. Agreement between model and MLS HNO3 at 68 hPa in mid-February 1995 was significantly better. Sen-sitivity tests show that a 1.5 K overall decrease in vortex temperatures or a factor 4 increase in assumed NAT nucleation rates produce the best statistical fit to MLS
ob-25
servations. Both adjustments would be required to bring the model into agreement with the MIPAS-B observations. The agreement between the model and observations suggests that a NAT-only denitrification scheme (without ice), which was discounted by
ACPD
5, 347–393, 2005 Comparison of modelled and observed Arctic denitrification S. Davies et al. Title Page Abstract Introduction Conclusions References Tables Figures J I J I Back Close Full Screen / EscPrint Version Interactive Discussion
previous studies, must now be considered as one mechanism for the observed Arctic denitrification. The timing of onset and the rate of denitrification remain poorly con-strained by the available observations.
1. Introduction
Very large NOy-containing particles at low number concentrations (∼10−4cm−3) and
5
extensive denitrification of the Arctic lower stratosphere were observed during the win-ter of 1999/2000 (Fahey et al.,2001;Northway et al.,2002;Santee et al.,2000). Less severe denitrification of the lower stratosphere has also been observed in previous cold Arctic winters (Arnold et al.,1989;Fahey et al.,1990;Wetzel et al.,1997;Sugita et al., 1998;Dessler et al.,1999;Waibel et al.,1999), although the lack of associated particle
10
observations made it difficult to develop models of the denitrification process. The most thorough comparison of a denitrification model with observations so far (Waibel et al., 1999) was limited to a single balloon flight of the MIPAS-B instrument.
The extensive particle and denitrification observations in winter 1999/2000 have prompted a number of modelling studies aimed at quantifying the particle growth and
15
denitrification processes. It has been shown that the large particles observed in Jan-uary to March 2000 (Fahey et al., 2001; Northway et al., 2002) are unlikely to have been nucleated on synoptic-scale ice (Carslaw et al.,2002), as has been assumed in previous models of denitrification (Waibel et al., 1999; Kondo et al., 2000), although the role of mesoscale ice clouds remains uncertain. The simulations have also shown
20
that NAT particles with concentrations as low as those observed can efficiently denitrify the Arctic lower stratosphere (Drdla et al.,2002;Mann et al.,2002,2003). In previous studies (Carslaw et al.,2002;Mann et al.,2002,2003) we have highlighted the impor-tance of the dynamical state of the vortex for efficient denitrification by sedimentation of very low concentrations of particles. When NAT concentrations are very low, the
parti-25
cles must grow to large sizes in order to denitrify rapidly, so the particle growth process must be captured by a model, a factor that was ignored byWaibel et al.(1999).
ACPD
5, 347–393, 2005 Comparison of modelled and observed Arctic denitrification S. Davies et al. Title Page Abstract Introduction Conclusions References Tables Figures J I J I Back Close Full Screen / EscPrint Version Interactive Discussion
The mechanisms of NAT-particle nucleation in the polar lower stratosphere remain uncertain, and this limits our ability to calculate denitrification in a model. There are three possibilities for NAT nucleation:
1. Tabazadeh(2001) have suggested that homogeneous nucleation of NAT may oc-cur at a rate sufficient to denitrify the Arctic stratosphere based on extrapolation
5
of laboratory data by Salcedo et al. (2001). However, Knopf et al. (2002) have performed new laboratory measurements which indicate that homogeneous nu-cleation of NAT is too slow to form NAT PSCs, even at temperatures several K below TNAT. Knopf et al.(2002) have also shown that the linear extrapolation of laboratory data to stratospheric conditions byTabazadeh(2001) gave physically
10
unrealistic results under some conditions, and was likely to overestimate freezing rates. The general applicability of laboratory-measured homogeneous nucleation rates to the stratosphere has been called into question because of the poten-tial role of surface contaminants (Tabazadeh, 2003). At present, the possibility of homogeneous nucleation of nitric acid hydrates remains an open and poorly
15
quantified issue.
2. A second possibility involves NAT formation in mountain wave temperature per-turbations (Deshler et al.,1994;Meilinger et al.,1995; Tsias et al., 1997). This process is supported by lidar observations which show that solid HNO3 parti-cles can be produced downstream of mountain wave-induced ice clouds (Carslaw
20
et al.,1998;Wirth et al.,1999;Hu et al.,2002;Fueglistaler et al.,2003). Large-scale model simulations have suggested that such a mechanism could produce a large amount of NAT in the Arctic (Carslaw et al., 1999). NAT PSCs down-stream of wave clouds do not efficiently denitrify as the particles are small and have low sedimentation velocities. However, modelling studies byDhaniyala et al.
25
(2002) andFueglistaler et al.(2002) have shown that the dense NAT clouds pro-duced downwind of mountain wave ice PSCs may subsequently act as sources for large NAT particles at low number concentrations throughout cold regions of
ACPD
5, 347–393, 2005 Comparison of modelled and observed Arctic denitrification S. Davies et al. Title Page Abstract Introduction Conclusions References Tables Figures J I J I Back Close Full Screen / EscPrint Version Interactive Discussion
the vortex by gradual sedimentation into the underlying NAT-supersaturated air. Mann et al. (submitted, 2004)1 have explored the vortex-wide influence of such a mechanism and suggest that it may play a significant role in large NAT particle production and denitrification in the Arctic. However, methods of including such processes in large-scale models have not yet been developed. However, several
5
other studies have concluded that a significant proportion of observed PSCs can-not be explained by mesoscale ice-formation but by synoptic scale temperature changes (Spang et al.,2001;Saitoh et al.,2002;Fromm et al.,2003;Pagan et al., 2004).
3. The third possibility involves heterogeneous nucleation of NAT on the surface of
10
a variety of stratospheric constituents other than ice. Potential nuclei include me-teoritic debris and ion clustersYu (2004). Supporting evidence for the efficiency of such a mechanism is indicated by Drdla et al. (2002) where a particle freez-ing mechanism operatfreez-ing above the ice frost point best matched the observed denitrification.
15
None of these mechanisms is sufficiently well constrained by observations and phys-ical models to allow for an accurate winter-long simulation of denitrification. One aim of this study is to test a model of denitrification that assumes a simplified NAT formation mechanism to see whether observations could help to constrain how the denitrification process should be treated in large-scale models. The NAT nucleation scheme we use
20
assumes that NAT particles form at a constant rate in all air below the NAT temperature. This scheme produces NAT particle fields that agree reasonably well with observations in the period January–March 2000 (Carslaw et al., 2002). We show below that this scheme also captures much of the variation in observed denitrification, but where there
1
Mann, G. W., Carslaw, K. S., Chipperfield, M. P., Davies, S., and Eckermann, S.: Large NAT particles and denitrification caused by mountain waves in the Arctic stratosphere, J. Geophys. Res., submitted, 2004.
ACPD
5, 347–393, 2005 Comparison of modelled and observed Arctic denitrification S. Davies et al. Title Page Abstract Introduction Conclusions References Tables Figures J I J I Back Close Full Screen / EscPrint Version Interactive Discussion
are discrepancies between observed and modelled denitrification there are insufficient observations to constrain improvements to the model.
This study is an extension of our previous simulations of the particles (Carslaw et al., 2002) and denitrification (Mann et al., 2002, 2003). In those studies we simulated the particle growth and sedimentation including the feedback of changes in the HNO3
5
field on particle behaviour, but we did not couple the denitrification model to the full chemical evolution of the Arctic winter vortex. In this study, we include that coupling because NOypartitioning is important when comparing with observations of HNO3and NOyspecies.
2. Model description
10
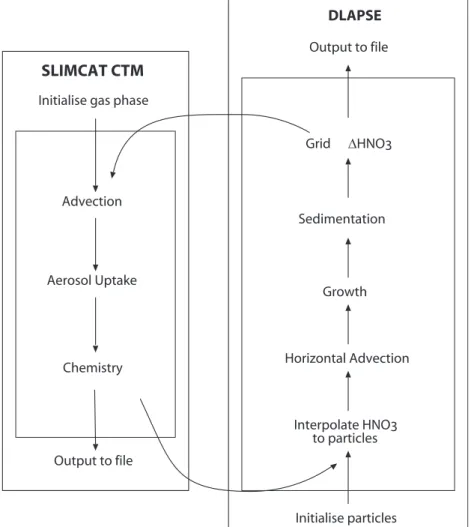
The DLAPSE model used for this study is a Lagrangian microphysical NAT-particle model coupled to a full-chemistry version of the SLIMCAT CTM (Chipperfield,1999). DLAPSE calculates the time-dependent growth, advection and sedimentation of NAT particles and has been described in detail inCarslaw et al.(2002). Changes in gas-phase HNO3 mass due to NAT-particle growth and sedimentation are calculated by
15
DLAPSE and applied to the SLIMCAT Eulerian grid, which is then advected with all the other gas phase species. Both DLAPSE and SLIMCAT are forced using operational analyses from the European Centre for Medium-Range Weather Forecasts (ECMWF). Figure 1 shows a schematic representation of the coupled model.
For this study, the SLIMCAT resolution was 2.8◦ longitude × 2.8◦ latitude × 36
isen-20
tropic levels. In the lower stratosphere, the model isentropic levels were spaced at 10 K potential temperature intervals, corresponding to a vertical resolution of around 400 m. The SLIMCAT stratospheric chemistry scheme contains 41 species and 120 chemical reactions, including heterogeneous reactions, using data fromSander et al. (2000). This model is an improvement on that used inMann et al.(2002) as it includes
ACPD
5, 347–393, 2005 Comparison of modelled and observed Arctic denitrification S. Davies et al. Title Page Abstract Introduction Conclusions References Tables Figures J I J I Back Close Full Screen / EscPrint Version Interactive Discussion
time-dependent partitioning of NOybetween its constituent components:
NOy=N + NO + NO2+ NO3+ 2N2O5+ HNO3+ HNO4+ ClONO2+ BrONO2 (1) Heterogeneous reactions are assumed to occur only on the surface of liquid aerosols, which dominate the particle surface area in these simulations. The surface area of liquid aerosols is determined assuming there are 10 particles cm−3 and HNO3 uptake
5
in thermodynamic equilibrium according toCarslaw et al. (1995). The liquid aerosols are assumed to have a log-normal size distribution with a width (σ)=1.8. Uptake of HNO3 into the liquid aerosol reduces gas-phase HNO3, thereby slowing the rate of NAT particle growth. Sequestration of HNO3in liquid aerosols is assumed to dominate competition for gas phase HNO3and only the residual gas-phase HNO3is available for
10
NAT growth in any one time step.
Initial NOy fields are taken from output from SLIMCAT multi-annual runs and scaled to match available observations in each winter The precise initialisation method was dependent on the data available for each winter. Further details of model initialisation for each winter are given below.
15
In our previous studies we took a pragmatic approach to specifying the NAT nucle-ation rate: NAT was assumed to nucleate at a constant rate wherever T<TNAT. We use the same approach and the same nucleation rate (8.0×10⁻¹⁰cm−3 s−1) in this study. The extent to which the observations provide a constraint on the model nucle-ation scheme is explored in this paper. The volume-averaged nuclenucle-ation rate used in
20
DLAPSE was derived from a comparison of our model and ER-2 NAT-particle obser-vations on 20 January 2000 (Fahey et al., 2001; Northway et al., 2002). Integrated number densities from the forward inlet on the NOy instrument were approximately 10−4cm−3 for particles greater than 5 µm diameter for the period 45 ks–47 ks UT dur-ing this flight (Northway et al., 2002). A series of model runs was carried out with
25
the nucleation rate adjusted each time to produce model particle number densities of ∼10−4cm−3in a sampling volume corresponding to the grid boxes containing the ER-2 flight track (latitude: 69.3◦N to 85.6◦N, longitude: 16.9◦E to 22.5◦E and altitude: 420 K
ACPD
5, 347–393, 2005 Comparison of modelled and observed Arctic denitrification S. Davies et al. Title Page Abstract Introduction Conclusions References Tables Figures J I J I Back Close Full Screen / EscPrint Version Interactive Discussion
to 440 K).
In the following sections, model simulations are compared with observations of den-itrification in three Arctic winters – 1999/2000, 1996/1997 and 1994/1995. All simula-tions were run for a period of 100 days from early winter prior to the onset of tempera-tures below TNAT. In each case, a control run without denitrification was performed to
5
provide a “passive” NOy. All of the winters studied were colder than the climatological average for the Arctic over the period 1965–1998 and had extended periods of tem-peratures below TNAT(Pawson and Naujokat,1999). Although each of the winters was cold, considerable dynamical differences exist between them.
3. Comparison with observations
10
3.1. Winter 1999/2000
The Arctic winter of 1999/2000 was characterised by an exceptionally cold vortex that was for long periods concentric with the area below TNATbetween mid-December 1999 and late-January 2000, producing ideal conditions for denitrification. Our previous sim-ulations without coupled chemistry (Mann et al.,2003) suggested that the vortex-mean
15
denitrification reached a peak >60% by early-February 2000 between 440 and 520 K, and more than 40% denitrified between 550 and 380 K at this time. Model NOy was initialised from a full-chemistry, multi-annual SLIMCAT model run. SLIMCAT NOywas scaled to observations from the in-vortex JPL Mark IV interferometer balloon flight on 3 December 1999 (Toon et al.,1992) in order to constrain model NOy species inside
20
the polar vortex whilst preserving partitioning between constituent species. 3.1.1. Comparison with the airborne in-situ NOy instrument
Figure 2 shows the modelled NOy and denitrification at 465 K on 20 January 2000. Also shown is the flightpath of the ER-2, the first in-vortex flight of the winter. The
ACPD
5, 347–393, 2005 Comparison of modelled and observed Arctic denitrification S. Davies et al. Title Page Abstract Introduction Conclusions References Tables Figures J I J I Back Close Full Screen / EscPrint Version Interactive Discussion
model predicts very low NOy(∼2 ppbv) due to extensive denitrification (up to 10 ppbv) at these altitudes. Modelled denitrification was essentially complete by this time, having occurred most strongly between mid-December and mid-January (Mann et al.,2003).
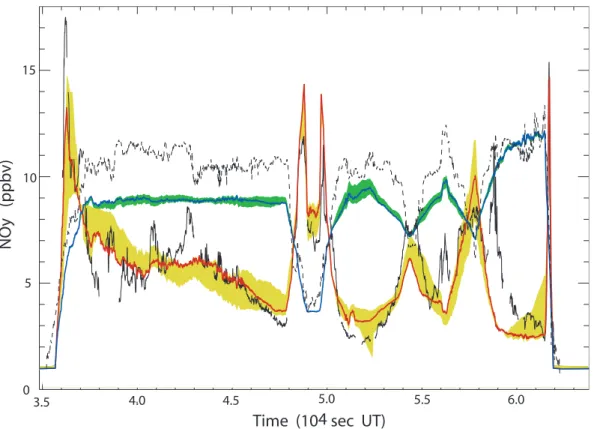
Figure3shows the modelled and observed NOy, model passive NOy and observed NO∗yalong the ER-2 flight track on this day. Observed NO∗yis derived from ARGUS N2O
5
(Jost et al.,1998) using the relationship derived byPopp et al.(2001). It is important to note that the inlet of the NOy instrument on-board the ER-2 allows size-dependent aerodynamic enhancement of aerosol particles up to ∼5 µm diameter. Therefore, in the presence of NOy-containing aerosol, measured NOyis susceptible to enhancement by condensed phases and should be considered an upper limit (Northway et al.,2002).
10
Modelled NOyincludes HNO3condensed in ternary aerosol but does not include NAT-phase HNO3as the particles are generally large and present at low numbers.
There are differences of up to 3 ppbv between observed NO∗y and model passive NOy for the majority of this flight. This discrepancy cannot be attributed to spatial inhomogeneity in the model tracer field as the range of model passive NOy is narrow
15
(as indicated by the shaded region: see figure caption). It is more likely that this offset is due to the inherent limitations of using an initial NOy field from a SLIMCAT multi-annual run, re-scaled to match a single in-vortex balloon flight. Uncertainties in the model transport over a period of ∼2 months must also contribute. Model and observed N2O (not shown) are in good agreement for the outward leg of the flight (between 37–
20
45 ks UT) but the model underestimates observed N2O by ∼20 ppbv (∼15%) at higher altitude during the homeward leg (51–61 ks UT).
The model reproduces the large spikes in observed NOywhich are associated with ascent and descent through thin layers of strongly renitrified air around 15 km. The model also reproduces the very low NOyvalues of around 2 ppbv at 52 ks UT when the
25
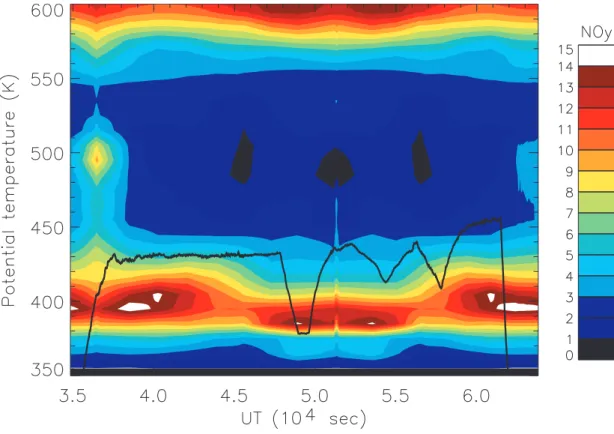
aircraft was at 20 km altitude near the pole. The model does not reproduce several of the smaller-scale features in observed NOy on this flight, as found between 40–45 ks UT and between 55–60 ks UT. Figure4 shows the model NOy profile along the ER-2 flight track on 20 January 2000. Strong modelled denitrification extends from 570 K to
ACPD
5, 347–393, 2005 Comparison of modelled and observed Arctic denitrification S. Davies et al. Title Page Abstract Introduction Conclusions References Tables Figures J I J I Back Close Full Screen / EscPrint Version Interactive Discussion
∼440 K with a narrow renitrified layer immediately below. The model predicts very low NOy(<2 ppbv) in a layer from ∼520–∼450 K, just above the ER-2 on this day.
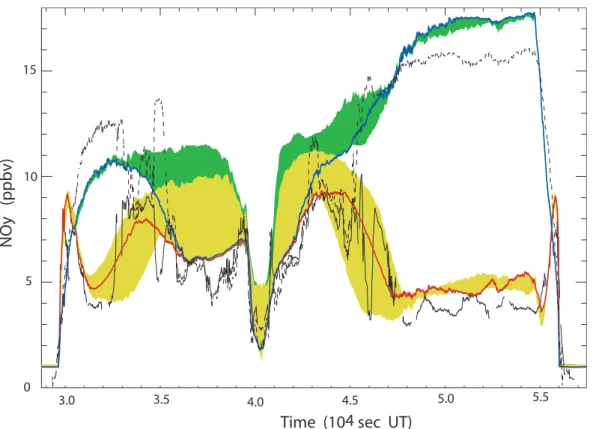
Figure 5 shows the modelled NOy and denitrification at 465 K on 11 March 2000. Vortex temperatures had risen above the NAT temperature by this time, although a large proportion of the vortex remained extensively denitrified. The increase in
appar-5
ent denitrification at this isentropic level in the model (up to 13 ppb) is due to descent of very denitrified air from higher altitudes rather than ongoing denitrification in the model (Fig.4). On this day, the ER-2 sampled both the vortex-core and mid-latitude air. Figure6shows that on March 11, the model passive NOyoverestimates observed NO∗y in the core of the vortex at 460 K (50–55 ks UT) by ∼2 ppbv. At lower altitude,
10
observed NO∗y is underestimated by a similar amount (30–33 ks UT). Close to the vor-tex edge (33–35 ks UT and 42–45 ks UT), both model and observed passive tracers are characterised by increased variability although the model does not fully capture the many small-scale features in observed NO∗y. The model does reproduce the sharp NOygradient at the edge of the vortex and the low NOyin the core of the vortex.
15
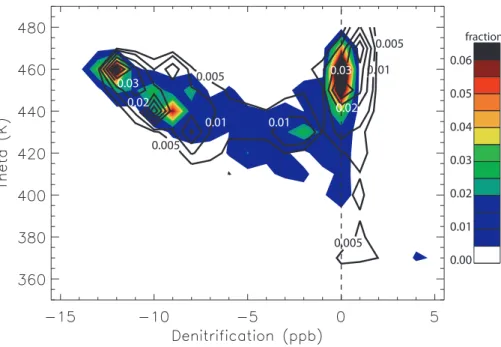
Figure7shows a probability density plot of all ER-2 observations of NOy-NO∗ywhere ambient temperatures were above TNAT for January–March 2000 as contour lines. Modelled NOy-passive NOy was interpolated to the location of the observations and is shown as the filled contours. Data were grouped in 10 K×1 ppbv bins. This approach excludes possible contributions from enhancements in the observed NOydue to
sam-20
pling of small particles. The peak observed denitrification occurs at 460 K (∼12 ppbv) and accounts for ∼90% of available NOy at this altitude. The duration of aircraft en-counters with nitrified airmasses was short, hence the absence of a significant signal of nitrification in Fig.7. The ∼1 ppbv observed nitrification between 460 and 475 K is most likely due to the limitations of the NO∗y relationship in extra-vortex air rather than
25
consistent weak nitrification in observations.
The model overestimates the magnitude of observed denitrification by ∼1 ppbv at 460 K but underestimates the magnitude of denitrification by ∼2 ppbv at 435 K. This difference is of similar magnitude to the uncertainty in modelled passive NOy which
ACPD
5, 347–393, 2005 Comparison of modelled and observed Arctic denitrification S. Davies et al. Title Page Abstract Introduction Conclusions References Tables Figures J I J I Back Close Full Screen / EscPrint Version Interactive Discussion
tends to be higher than observed NO∗y at the highest altitudes, especially in spring (as indicated in Fig.6). At lower altitudes and earlier in the winter, the model passive NOy tends to underestimate observed NO∗y (Fig. 3), indicating that the model may have a larger vertical NOy gradient in the polar vortex than is observed. It is also likely that the fixed NAT nucleation rate in the model is not representative of the real atmosphere
5
throughout the winter. The NAT nucleation rate has been scaled to match NAT con-centrations observed by the ER-2 in January at ∼420–440 K. If NAT nucleation rates were significantly different in December and early January when observations are not available, then discrepancies between model and observed denitrification will occur. Additional contributions to denitrification in the real atmosphere from other processes
10
which are not represented in the model may also contribute to the discrepancy be-tween observed and modelled denitrification. Observations of NAT and denitrification that begin in late January cannot really address this issue.
A simpler thermodynamic equilibrium NAT-based denitrification scheme has previ-ously been used to simulate this winter (Davies et al.,2002). Condensed HNO3was
15
partitioned between a small non-sedimenting particle mode and a large particle mode with a fall velocity corresponding to a particle radius of 6.5 µm. Although this simple scheme was able to capture the magnitude of denitrification in the core of the vortex, it was unable to reproduce the sharp gradients in denitrification observed close to the edge of the vortex. The tendency for thermodynamic equilibrium schemes to ‘smear
20
out’ denitrification has also been demonstrated in an idealised study by Mann et al. (2002). Under conditions where the vortex meteorology is favourable for denitrification over a prolonged period, as in 1999/2000, residual NOymay approach thermodynamic equilibrium values in the core of the vortex. Thus, the observations of widespread and severe denitrification in 1999/2000 alone, do not unambiguously constrain model
25
ACPD
5, 347–393, 2005 Comparison of modelled and observed Arctic denitrification S. Davies et al. Title Page Abstract Introduction Conclusions References Tables Figures J I J I Back Close Full Screen / EscPrint Version Interactive Discussion
3.1.2. Comparison with MLS
The Microwave Limb Sounder (MLS) instrument on-board the Upper Atmosphere Re-search Satellite (UARS) has provided global observations of many key stratospheric species, including O3, HNO3 and ClO since its launch in 1991 (Waters et al.,1999). In recent years, MLS operation has been severely curtailed, although it did make
gas-5
phase HNO3measurements over a restricted region of the Arctic in two periods during 1999/2000 (Santee et al.,2000).
In order to compare the model with the satellite observations, the model fields were interpolated from isentropic levels to the standard pressure coordinates of MLS. The model fields were further modified by the application of the MLS averaging kernel to
10
degrade the model fields to the vertical resolution of the MLS instrument. No horizontal interpolation of the model was performed.
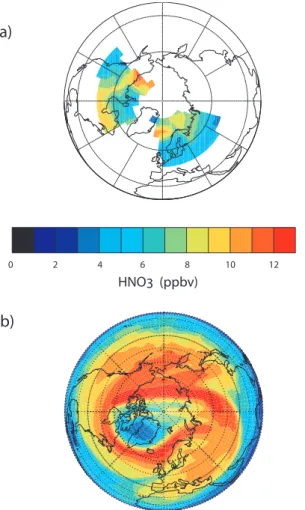
Observations of gas phase HNO3 at 68 hPa on 9–11 February 2000 from Version 5 MLS (Fig.8a) indicate a region with low HNO3(∼4–5 ppbv) in the polar vortex over Greenland and Baffin Island. The satellite observations also indicate a region with high
15
HNO3 mixing ratios (∼11 ppbv) located over the Alaska/Yukon coastline. Figures 8b shows the model HNO3 interpolated to 68 hPa after the application of the MLS av-eraging kernel on 10 February 2000. Degrading the vertical resolution of the model increases the apparent gas-phase HNO3 by 2–4 ppbv in non-denitrified polar vortex air and reduces apparent gas-phase HNO3 by a similar amount in strongly denitrified
20
regions of the vortex. These changes are due to the contribution of higher altitudes in the kernel smoothing.
The degraded model field reproduces the overall magnitude and location of the ob-served high HNO3over the Alaskan coastline and the reduced HNO3over Greenland. Significant model overestimates of MLS observed NOyin mid-latitude air masses over
25
the Baltic Sea and the coast of the western USA are most likely attributable to inaccu-rate initialisation of model HNO3at higher altitudes in the extra-vortex region.
re-ACPD
5, 347–393, 2005 Comparison of modelled and observed Arctic denitrification S. Davies et al. Title Page Abstract Introduction Conclusions References Tables Figures J I J I Back Close Full Screen / EscPrint Version Interactive Discussion
gions is a significant limitation for the initialisation of 3-D chemical models in this winter. These results indicate that although the DLAPSE/SLIMCAT model is able to reproduce the observed NOy, quantitative diagnosis of model denitrification also requires accu-rate initialisation of passive NOyand its subsequent transport. Despite these caveats, the microphysical denitrification scheme results in an improved representation of
deni-5
trification when compared with an equilibrium denitrification model. Unfortunately, den-itrification was essentially complete by the time of the first in-vortex ER-2 flight on 20 January. This restricts the conclusions which may be drawn about the timing and rate of denitrification and hence the validity of the volume-averaged nucleation rate in DLAPSE.
10
3.2. Winter 1996/1997
In winter 1996/1997 the polar vortex was too warm for the formation of PSCs until early January. The general development of denitrification has been described byMann et al. (2003). The period between mid-January and early February was characterised by a shallow and disturbed NAT-supersaturated region above 500 K, with short particle
life-15
times. Consequently, vortex-mean denitrification of only ∼10% is predicted by DLAPSE in the January-early February period. From mid-February onwards the situation was very different, with a deep cold pool of moderately large area aligned concentrically with the vortex flow. Model NAT particles grew to mean radii of ∼6 µm and NAT number con-centrations reached ∼1.5×10⁻⁴cm−3, causing rapid denitrification over a smaller area
20
of the vortex (∼9 million km2compared with >14 million km2in winter 1999/2000). Vor-tex mean denitrification at 450 K in the model reached ∼40% by the end of February 1997, which is considerably lower than the 66% calculated for 1999/2000 (Mann et al., 2003).
ACPD
5, 347–393, 2005 Comparison of modelled and observed Arctic denitrification S. Davies et al. Title Page Abstract Introduction Conclusions References Tables Figures J I J I Back Close Full Screen / EscPrint Version Interactive Discussion
3.2.1. Comparison with ILAS
Model denitrification was compared with Version 5.20 observations from the Improved Limb Atmospheric Sounder (ILAS) on-board the Advanced Earth Observing Satellite (ADEOS) (Sasano et al.,1999). Vertical distributions of measured atmospheric com-ponents (including HNO3, O3, N2O and aerosol extinction) were obtained by constant
5
solar tracking. The mode of operation of the ILAS instrument, in conjunction with a satellite orbit period of approximately 100 min, combine to produce, at most, 14 daily profiles of the atmosphere in a narrow latitude band in both hemispheres. Solar occul-tation instruments such as ILAS may not sample the vortex in a representative manner as the tangent points often lie close to the edge of the vortex, especially during periods
10
of low planetary wave activity. There were no N2O observations from ILAS after 28 February 1997, although modelled denitrification had almost ceased by this date.
Model NOy was initialised from a multi-annual SLIMCAT run and constrained using ILAS HNO3 observations on 4 January 1997. Model HNO3 was interpolated to the location of the ILAS observations and scaled to fit using in-vortex and extra-vortex
15
profiles, assuming a modified potential vorticity MPV465of 32 PVU at the vortex edge. Figure9shows model HNO3and denitrification at 465 K on 21 February 1997. The 32 PVU contours, the region of NAT-supersaturation, and the locations of the ILAS re-trievals are also indicated. On this day, the polar vortex is elongated in a characteristic wave-1 pattern. There are two distinct regions of low model HNO3 corresponding to
20
denitrification within the vortex. There is a large region with HNO3 ∼3 ppbv (∼8 ppbv denitrification) over Greenland, and an elongated region with weaker denitrification (∼4 ppbv) over Arctic Russia.
In order to compare the model with ILAS observations within the polar vortex, the model output for 12:00 UT each day was bilinearly interpolated to the co-ordinates of
25
each satellite profile. The model was not temporally interpolated to the observations. Comparisons of model and ILAS observations have only been made using profiles in which the aerosol extinction is less than the background value plus 3 standard
devia-ACPD
5, 347–393, 2005 Comparison of modelled and observed Arctic denitrification S. Davies et al. Title Page Abstract Introduction Conclusions References Tables Figures J I J I Back Close Full Screen / EscPrint Version Interactive Discussion
tions. This method is in accordance with that ofKondo et al.(2000) to avoid potential interference of PSCs on the retrieved profiles. ILAS N2O was used to derive NO∗y (Sugita et al.,1998) according to:
[NO∗y]=5.71−2.28χ + 11.8χ2−2.14χ3−1.04χ4, (2)
where χ=log10([N2O] (ppbv)) and is valid in the range 20 ppbv≤[N2O]≤220 ppbv.
5
Comparisons of denitrification are limited to the region below 520 K where the NO∗y relation is valid. Profile 10 appears to be located within the region of strong denitri-fication whilst profile 3 is close to a filament of moderately denitrified air. Profile 8 is included in the comparison because it is representative of the non-denitrified regions of the polar vortex.
10
Figure10shows observed and modelled HNO3, observed NO∗y, and model passive NOy for Points 8, 10 and 3 from Fig. 9. Model profiles are shown both at original SLIMCAT resolution, and after the application of the ILAS weighting functions. These observations are typical of the comparisons between DLAPSE and ILAS in this period. There is reasonable agreement between ILAS NO∗y and model passive NOy,
al-15
though there is a low bias of 2 ppbv in model passive NOy below 500 K at Point 10. ILAS and model HNO3 are in excellent agreement for highly denitrified Point 10 and non-denitrifed Point 8. The model overestimates HNO3 by around 3 ppbv for Point 3, which is close to a model denitrification filament. Both model and ILAS HNO3≈NO∗y below 475 K at Point 8, suggesting that the vortex is highly chemically processed with
20
low ClONO2.
The diagnosed denitrification for each of the 3 points is shown in Figs.10d–f. NO∗y -HNO3 is used as a proxy for denitrification from the ILAS data and is compared with model passive NOy-gas-phase HNO3. This approach will overestimate the magnitude of denitrification when a significant fraction of NOy in the sampled airmass is in forms
25
other than HNO3. In this study, the greatest discrepancy between modelled and ob-served denitrification is likely at altitudes above 500 K and close to the vortex edge. The useful vertical range of this comparison is restricted to the region below 530 K.
ACPD
5, 347–393, 2005 Comparison of modelled and observed Arctic denitrification S. Davies et al. Title Page Abstract Introduction Conclusions References Tables Figures J I J I Back Close Full Screen / EscPrint Version Interactive Discussion
The model underestimates the magnitude of the maximum denitrification at Point 10 (∼12 ppbv) by around 2 ppbv using this technique. Observed weak nitrification at 385 K is also captured by the model at this location. In contrast, the model significantly underestimates the observed denitrification at Point 3, although a small spatial shift could account for a significant fraction of the discrepancy due to the complex spatial
5
structure of denitrification in the region of this observation point.
Figure11shows a 5-day timeseries of denitrification from both the ILAS observations and DLAPSE. Modelled denitrification is diagnosed from HNO3-passive NOy, whilst ILAS denitrification is diagnosed as in Fig.10. At altitudes above 470 K, there is a sys-tematic offset between model HNO3 and passive NOy. NOy partitioning accounts for
10
an increasing proportion of this discrepancy with increased altitude. Pre-existing weak denitrification of ∼1–2.5 ppbv also contributes below 550 K which may be attributed to a short-lived model denitrification event in mid-January. Denitrification prior to 13 February is not evident in the ILAS observations although the magnitude of the den-itrification event is similar to the inherent scatter in the diagnosed denden-itrification from
15
ILAS (2–3 ppbv).
The first clear signals of denitrification in the ILAS data occur on 14 February 1997 when high PV vortex air extended southwards and became favourably located relative to the ILAS occultations on this day (∼67◦N). In the model, denitrification had begun a few days earlier but these airmasses were located poleward of ILAS occultations. In
20
addition, enhanced aerosol extinction in sampled airmasses during the denitrification phase is another potential factor which may limit the accurate diagnosis of the timing of denitrification as both are favoured by low temperatures. The magnitude of denitrifi-cation increases rapidly in ILAS although the limitations of the NOy=HNO3assumption make accurate quantification difficult.
25
Throughout the period 14–28 February, when denitrification is evident in the ILAS observations, the model tends to underestimate the magnitude of denitrification (by 1– 2 ppbv). The vertical extent of modelled denitrification is also slightly underestimated. The timing of the observed denitrification is consistent with modelled NAT particle
ACPD
5, 347–393, 2005 Comparison of modelled and observed Arctic denitrification S. Davies et al. Title Page Abstract Introduction Conclusions References Tables Figures J I J I Back Close Full Screen / EscPrint Version Interactive Discussion
growth, although the model produced earlier denitrification in airmasses which were not sampled by ILAS. In contrast, Kondo et al. (2000) have proposed that observa-tions of denitrification diagnosed from ILAS HNO3observations in February 1997 were consistent with particle nucleation at temperatures below Ti cealong isentropic back tra-jectories. Ice particle formation was assumed to occur 1.5 K below Ti ceto account for
5
potential biases in the ECMWF analysed temperatures. Our model simulations show that denitrification in the 1996/1997 winter could equally well be explained by sedi-mentation of low concentrations of NAT. The limited spatial and temporal range of the observations in the critical period of mid-February do not provide a strong constraint on the rate or timing of denitrification in our model.
10
There were MLS observations of the Arctic polar vortex on a few days in late-February, 1997. The regions of low HNO3 in the MLS observations on these days were below TNAT and could be due to temporary uptake into PSCs, denitrification or a combination of both processes. No evidence of suppressed HNO3 was observed by MLS during the following north-looking period in early April, indicating that low HNO3
15
mixing ratios in February were most likely due to temporary uptake into PSCs rather than denitrification (Santee et al.,2000). In contrast, low in-vortex HNO3 in DLAPSE during late-February was due mainly to denitrification (not shown).
Quantification of denitrification from remote observations of gas-phase HNO3 and N2O require assumptions to be made about the partitioning of NOyin the polar
strato-20
sphere. The assumption that HNO3=NOy (or some large fraction of NOy) is approx-imately valid in the polar lower stratosphere in early spring when HNO3 photolysis is slow and the air is often highly processed by polar stratospheric clouds. Observations with a limited latitudinal sampling range may also restrict the degree of certainty with which conclusions may be drawn on the timing of denitrification. The absence of
us-25
able ILAS HNO3 retrievals in regions of enhanced aerosol are a significant limitation to diagnosis of timing and rate of denitrification when PSCs are present. It is unclear whether regions of large NAT particles at concentrations of ∼10−4cm−3would produce sufficient extinction to be detected by ILAS. Within these constraints, the comparisons
ACPD
5, 347–393, 2005 Comparison of modelled and observed Arctic denitrification S. Davies et al. Title Page Abstract Introduction Conclusions References Tables Figures J I J I Back Close Full Screen / EscPrint Version Interactive Discussion
between modelled and observed denitrification demonstrate agreement, both in the spatial extent and timing of denitrification below 500 K when a simple volume-averaged NAT-particle nucleation mechanism is used.
3.3. Winter 1994/1995
The Arctic winter of 1994/1995 was characterised by a smaller cold pool in terms
5
of both area (∼9 million km2) and vertical extent (400–550 K) when compared with 1999/2000 (Mann et al., 2003). In addition, the vortex and cold pool were generally less concentric (more baroclinic) in 1994/1995. There were two short periods during 1994/1995 (13–20 December and 10–15 January) when the relative orientation of the cold pool and vortex were conducive to long particle growth times and significant
den-10
itrification. Observations are available for 11 February 1995 from the Balloon-borne Michelsen Interferometer for Passive Atmospheric Sounding (MIPAS-B) instrument.
Model NOy was initialised using a mid-latitude balloon NOy/N2O correlation (Kondo et al.,1996) from 12 October 1994. Initial model NOyand N2O were interpolated to the latitude, longitude and altitude of the balloon observations and an observed NOy/model
15
N2O derived for this location. This relation was then used to scale all SLIMCAT NOy throughout the northern hemisphere by adjustment of the model HNO3tracer.
3.3.1. Comparison with MIPAS-B
Figure12shows modelled NOyand denitrification at 465 K on 11 February 1995. The modelled vortex is characterised by relatively low NOy (∼9 ppbv) due to widespread
20
moderate denitrification (∼4–5 ppbv) which occurred primarily in the mid-December period (Mann et al., 2003). On this date the location of the balloon launch (Kiruna, Sweden, 68◦N, 22◦E) was deep within the polar vortex.
Figure 13 compares NOy and NO∗y observations with NOy and passive NOy from DLAPSE at 465 K on 11 February 1995. In addition, the model output is shown
in-25
ACPD
5, 347–393, 2005 Comparison of modelled and observed Arctic denitrification S. Davies et al. Title Page Abstract Introduction Conclusions References Tables Figures J I J I Back Close Full Screen / EscPrint Version Interactive Discussion
more accurately reflect the vertical resolution of the MIPAS-B instrument. Passive NOy and observed NO∗y agree reasonably, especially below 23 km when the model output is smoothed. There are considerable discrepancies between modelled and observed NOy, especially above 18 km. This is illustrated in Fig.13b, which compares the MIPAS-B diagnosed denitrification (NO∗y-NOy) with modelled denitrification (passive NOy-NOy).
5
Peak denitrification of ∼9 ppbv occurs at 21 km in the observations. Both the smoothed and non-smoothed model profiles significantly underestimate the magnitude and alti-tude of denitrification. In addition, the magnialti-tude of nitrification (∼3 ppbv at 13 km) is also underestimated.
These results show that DLAPSE significantly underpredicts the observed
denitrifi-10
cation in this winter when the ECMWF 31-level analyses are used. The discrepancy could be caused by too low NAT nucleation rates or too high analysed temperatures. Knudsen(1996) demonstrated that the analysed temperatures at 50 and 30 hPa from the ECMWF were too warm by 1.4 K and 1.9 K, respectively, at temperatures around TNATwhen compared with sondes for this winter, a factor which has major implications
15
for the prediction of denitrification. In order to investigate the sensitivity of denitrifi-cation to reductions in temperature and model nucleation rate, additional model runs were performed. The DLAPSE denitrification model used for this sensitivity study was exactly as described above but, for reasons of computational efficiency, a simplified version of SLIMCAT was used. SLIMCAT was used to passively advect the DLAPSE
20
calculated NOy and passive NOy but without chemistry. Table 1 lists the nucleation rates and temperature perturbations used for these simulations.
Figure 14a compares model and MIPAS-B denitrification from each of the sensitiv-ity runs listed in Table 1. Figure14b is the equivalent plot in which the model output has been smoothed by application of a 3 km running mean. Balloon-borne
temper-25
atures were above 200 K, indicating that the inferred denitrification is unlikely to be enhanced by condensed HNO3. The impact on denitrification of a 4× increase in the volume-average NAT-particle nucleation rate is almost identical to the effect of a global temperature reduction of 1.5 K at this location. However, neither increase alone is su
ffi-ACPD
5, 347–393, 2005 Comparison of modelled and observed Arctic denitrification S. Davies et al. Title Page Abstract Introduction Conclusions References Tables Figures J I J I Back Close Full Screen / EscPrint Version Interactive Discussion
cient to reproduce the observed denitrification. The observations are best reproduced by a combination of both a temperature reduction of 1.5 K and a 4× increase in nu-cleation rate in this study, although a similar response could be achieved by a greater increase in particle nucleation rate. In all cases, model denitrification is displaced ver-tically by ∼2 km below the observed denitrification. This discrepancy may be due to a
5
systematic vertical offset in the analysed temperatures during the winter affecting par-ticle growth and sedimentation, errors in model diabatic descent, or poor initialisation of model NOy.
3.3.2. Comparison with MLS
In order to investigate this anomaly between model and MIPAS-observed
denitrifica-10
tion, comparisons were made with MLS HNO3 observations in February and March 1995. Full MLS scans of the northern hemisphere are available for 8, 14 February and from 21 February onwards, but not for the day of the MIPAS-B flight (11 February). The ECMWF operational analyses indicate that temperatures were above TNAT on 14 February using SLIMCAT passive HNO3and H2O.
15
Figure 15 compares MLS-observed HNO3 with non-denitrified and denitrified DLAPSE model. MLS seems to show relatively high (>10 ppbv) HNO3 in a semi-circular ‘annulus’ over N Canada, Greenland to Scandinavia which is reproduced in the model. MLS clearly shows a region of suppressed HNO3poleward of the annulus, centred on Spitzbergen (∼7 ppbv instead of ∼11–12 ppbv). Analysed temperatures
20
were above TNAT on this day and, even assuming a probable warm bias of 1.5–2 K, up-take of significant HNO3into ternary aerosol over such a wide region seems unlikely. The passive model run (Fig.15a) significantly overestimates HNO3 in the core of the vortex. In contrast, the denitrified run is a better fit to the observations although it still systematically overestimates the observed in-vortex HNO3.
25
Figure16and Table2show that the discrepancy between model and MLS HNO3is greatest for the passive (non-denitrified) run. The discrepancy between MLS HNO3and the passive model is ∼5 ppbv in the core of the vortex. Vortex-wide MLS observations
ACPD
5, 347–393, 2005 Comparison of modelled and observed Arctic denitrification S. Davies et al. Title Page Abstract Introduction Conclusions References Tables Figures J I J I Back Close Full Screen / EscPrint Version Interactive Discussion
of HNO3are also overestimated by the baseline DLAPSE model run at 68 hPa although the discrepancy is relatively small (∼0.5 ppbv). The best fit to observed MLS HNO3is achieved using either a 4× increase in the nucleation rate (model run S1) or a reduction in temperature of 1.5 K (model run S2). The latter is consistent with known discrepan-cies between the ECMWF analyses and sondes in this winter (Knudsen,1996). The
5
model run in best agreement with MIPAS-B (S3), overestimates the magnitude of den-itrification by ∼0.8 ppbv when compared with MLS. However, it is worth noting that in each of the model sensitivity runs (S1–S3), the absence of a full stratospheric chem-istry scheme means that the value indicated for model HNO3 is an upper limit based on the assumption that HNO3=NOy. Comparisons between SLIMCAT/DLAPSE and
10
MLS on the 46 hPa pressure level (not shown) demonstrate similar agreement to that at 68 hPa. The peak in MIPAS-observed denitrification on 11 February 1995 occurs at ∼38 hPa, between the MLS tangent points at 32 and 46 hPa. There is no evidence of significant suppression of vortex HNO3in either MLS or the model at 32 hPa on 14 February.
15
InWaibel et al.(1999), a thermodynamic equilibrium denitrification model was used to quantitatively explain these MIPAS-B observations. Their model calculated denitri-fication using 3-D temperature fields but averaged the HNO3 on each isentropic level after each time step rather than transporting it as we do in our model. The model also neglected chemical reactions. NAT nucleation on ice at Ti ce−1.5 K was found to best
20
reproduce the characteristic shape and magnitude of the observed denitrification using ECMWF analyses. They rejected the possibility of NAT nucleation and sedimentation as the cause of denitrification because their model produced too much denitrification at high altitudes. This result led Waibel et al. (1999) to suggest that NAT nucleation on ice was responsible for denitrification. Our full kinetic simulation of NAT growth in a
25
3-D chemical transport model produces a denitrification profile that is in fair agreement with MIPAS-B observations on February 11 and better agreement with MLS during mid-February. Based on all these comparisons, we believe it is now no longer possible to reject a NAT-only mechanism of denitrification in the 1994/1995 winter.
ACPD
5, 347–393, 2005 Comparison of modelled and observed Arctic denitrification S. Davies et al. Title Page Abstract Introduction Conclusions References Tables Figures J I J I Back Close Full Screen / EscPrint Version Interactive Discussion
The poor agreement between MIPAS-observed and modelled denitrification when we use NAT nucleation rates defined by the January 2000 observations is interesting. The poor agreement may indicate that average NAT nucleation rates were much higher (at least a factor 4) in early winter 1994/1995, even when a correction is made for a possible warm bias of ∼1.5 K in the ECMWF-analysed vortex temperatures through the
5
main denitrification period in December.Sugita et al.(1998) attribute the denitrification observed by MIPAS-B on this date to NAT nucleation in mountain wave ice clouds and subsequent NAT particle growth below TNAT. This effect could contribute to the apparent discrepancy between the model and MIPAS-B denitrification on 11 February.
4. Conclusions
10
In situ and remote observations of denitrification in three recent Arctic winters (1994/1995, 1996/1997 and 1999/2000) have been used to evaluate the performance of DLAPSE/SLIMCAT. This novel model comprises a full-chemistry version of the Eu-lerian SLIMCAT CTM coupled to a semi-Lagrangian NAT-particle growth and sedi-mentation model (DLAPSE). NAT particle nucleation in DLAPSE was constrained by
15
observations of large NAT particle populations from the NOy instrument on 20 Jan-uary 2000. The constant volume-average nucleation rate used in the model was 8.0×10⁻¹⁰cm−3s−1.
In 1999/2000, the evolution of denitrification was observed by the ER-2 between 20 January and 12 March. The coupled model captures the temporal evolution of
deni-20
trification in this period. The vertical distribution of denitrification and nitrification was consistent with ER-2 observations although quantitative diagnosis requires accurate initialisation and transport of the model passive NOytracer.
Comparisons with remote ILAS observations during the Arctic winter of 1996/1997 demonstrate that the model captures both the spatial extent and timing of observed
25
denitrification. The first clear observations of denitrification on 14 February occurred when the vortex core was sufficiently displaced to the lower latitudes sampled by ILAS.
ACPD
5, 347–393, 2005 Comparison of modelled and observed Arctic denitrification S. Davies et al. Title Page Abstract Introduction Conclusions References Tables Figures J I J I Back Close Full Screen / EscPrint Version Interactive Discussion
Model denitrification began in the closed flow region at the core of the vortex around 1 week prior to these first observations of denitrification in airmasses which were not sampled by ILAS. The lack of observations poleward of ∼67◦N from ILAS during the critical initial denitrification phase is a limitation on further constraining NAT particle nucleation mechanisms.
5
The limited number of NOy species observed by ILAS requires assumptions to be made about the partitioning of NOy in the sampled air masses before quantification of the magnitude of observed denitrification is possible. It is likely that the model under-estimates observed denitrification by ∼1–2 ppbv although this discrepancy is of similar magnitude to likely errors in assumptions of the partitioning of NOy in the highly
pro-10
cessed vortex below 500 K.
Significantly greater discrepancies are apparent when comparisons are made be-tween DLAPSE and MIPAS-B observations of denitrification on 11 February 1995. It is likely that a warm bias in the ECMWF analysed temperatures of at least 1.5 K is partly responsible for this discrepancy. Sensitivity studies indicate that a four-fold increase in
15
the nucleation rate together with a reduction in temperature of 1.5 K are necessary to reproduce the observations of denitrification. Additional denitrification from mountain wave ice-induced NAT ‘mother clouds’ would be expected to contribute to denitrification (Fueglistaler et al.,2002;Dhaniyala et al.,2002). It is possible that such mother clouds may be sufficiently numerous to seed large regions of the Arctic vortex with sufficient
20
NAT particles to cause efficient denitrification (Mann et al., submitted, 20041), although it is important not to over-interpret a discrepancy between DLAPSE and a single deni-trification profile. Model comparisons with MLS HNO3on 2 days in mid-February show much better agreement, especially when a temperature reduction of 1.5 K is applied to the model or the nucleation rate is increased by a factor of 4.
25
In summary, the simple constant volume average NAT nucleation scheme in DLAPSE/SLIMCAT is able to reproduce many aspects of observed denitrification from a variety of platforms over three recent winters. However, there appears to be ad-ditional inter-annual variability in the magnitude of denitrification that is not captured
ACPD
5, 347–393, 2005 Comparison of modelled and observed Arctic denitrification S. Davies et al. Title Page Abstract Introduction Conclusions References Tables Figures J I J I Back Close Full Screen / EscPrint Version Interactive Discussion
by the model. The differences between the modelled and observed denitrification in any one winter can be improved by straightforward adjustments to the assumed rate of NAT formation. However, further work should focus on identifying the physical pro-cesses causing NAT formation, leading to appropriate rates that can be included in large-scale models.
5
The absence of frequent, high-resolution NOy and aerosol measurements through-out the Arctic vortex places significant limitations on the initialisation of model NOy fields. High resolution NOy observations would prove invaluable for unambiguously diagnosing the timing and extent of denitrification, which would aid testing NAT nucle-ation mechanisms. New data from the next genernucle-ation of satellites (ENVISAT, SAGEIII
10
and Aura) should provide valuable additional NOyand PSC data to aid this process. Acknowledgements. This work was supported by the European Commission Framework 5 projects EUPLEX and MAPSCORE projects under contracts CT-2002-00084 and EVK2-CT-2000-00072 and by the Framework 6 project SCOUT. S. Davies thanks the UK Natural Environment Research Council for funding his PhD studentship. The author acknowledges the
15
contribution of D. W. Fahey (NOAA), G. C. Toon (NASA JPL) and H.-J. Jost (NASA Ames) in providing the NOy and N2O data used to evaluate the model in 1999/2000.
References
Arnold, F., B ¨urger, V., Gollinger, K., Roncossek, M., Schneider, J., and Spreng, S.: Evidence for stratospheric nitric acid condensation from balloon and rocket measurements, Nature, 342,
20
493–497, 1989. 349
Chipperfield, M. P.: Multiannual simulations with a three-dimensional chemical transport model, J. Geophys. Res., 104, 1781–1805, 1999. 352
Carslaw, K. S., Luo, B. P., and Peter, T.: An analytic expression for the composition of aqueous HNO3-H2SO4stratospheric aerosols including gas-phase removal of HNO3, Geophys. Res.
25
Lett., 22, 1877–1880, 1995. 353
Carslaw, K. S., Peter, Th., and Clegg, S. L.: Modeling the composition of liquid stratospheric aerosols, Rev. Geophys., 35, 125–154, 1997.
ACPD
5, 347–393, 2005 Comparison of modelled and observed Arctic denitrification S. Davies et al. Title Page Abstract Introduction Conclusions References Tables Figures J I J I Back Close Full Screen / EscPrint Version Interactive Discussion
Carslaw, K. S., Wirth, M., Tsias, A., Luo, B. P., D ¨ornbrack, A., Leutbecher, M., Volkert, H., Renger, W., Bacmeister, J. T., and Peter, Th.: Increased stratospheric ozone depletion due to mountain wave induced atmospheric waves, Nature, 391, 675–678 , 1998. 350
Carslaw, K. S., Peter, Th., Backmeister, J. T., and Eckermann, S. D.: Widespread solid particle formation by mountain waves in the Arctic stratosphere, J. Geophys. Res., 104, 1827–1836,
5
1999. 350
Carslaw, K. S., Kettleborough, J., Northway, M. J., Davies, S., Gao, R.-S., Fahey, D. W., Baumgardner, D. G., Chipperfield, M. P., and Kleinb ¨ohl, A.: A vortex-scale simulation of the growth and sedimentation of large nitric acid hydrate particles, J. Geophys. Res., 107, doi:10.1029/2001JD000467, 2002. 349,351,352
10
Davies, S., Chipperfield, M. P., Carslaw, K. S., Sinnhuber, B.-M., Anderson, J. G., Stimpfle, R. M., Wilmouth, D. M., Fahey, D. W., Popp, P. J., Richard, E. C., von der Gathen, P., Jost, H., and Webster, C. R.: Modeling the effect of denitrification on Arctic ozone depletion during winter 1999/2000, J. Geophys. Res., 107, 8322, doi:10.1029/2001JD000445, 2002. 357
Deshler, T. and Oltmans, S. J.: Vertical profiles of volcanic aerosol and polar stratospheric
15
clouds over Kiruna, Sweden, winters 1993 and 1995, J. Atmos. Chem., 30, 11–23, 1998. Deshler, T., Peter, T., M ¨uller, R., and Crutzen, P.: The lifetime of leewave-induced ice particles in
the Arctic stratosphere: 1. Balloonborne observations, Geophys. Res. Lett., 21, 1327–1330, 1994. 350
Dessler, A. E., Wu, J., Santee, M. L., and Schoeberl, M. R.: Satellite observations of temporary
20
and irreversible denitrification, J. Geophys. Res., 104, 13 993–14 002, 1999. 349
Dhaniyala, S., McKinney, K., and Wennberg, P. O.: Lee-wave clouds and denitrification of the polar stratosphere, Geophys. Res. Lett., 29, doi:10.1029/2001GL013900, 2002. 350,369
Drdla, K., Schoeberl, M. R., and Rosenfeld, J.: Microphysical modeling of the 1999/2000 Arctic winter, 1. Polar stratospheric clouds, denitrification and dehydration, J. Geophys. Res., 107,
25
doi:10.1029/2001JD001159, 2002. 349,351
Fahey, D. W., Kelly, K. K., Kawa, S. R., Tuck, A. F., Lowenstein, M., Chan, K. R., and Heidt, L. E.: Observations of denitrification and dehydration in the winter polar stratospheres, Nature, 344, 321–324, 1990. 349
Fahey, D. W., Gao, R. S., Carslaw, K. S., Kettleborough, J., Popp, P. J., Northway, M. J., Holecek,
30
J. C., Ciciora, S. C., McLauchlin, R. J., Thompson, T. L., Winkler, R. H., Baumgardner, D. G., Gandrud, B., Wennberg, P. O., Dhaniyala, S., McKinney, K., Peter, Th., Salawitch, R. J., Bui, T. P., Elkins, J. W., Webster, C. R., Atlas, E. L., Jost, H., Wilson, J. C., Herman, R. L.,
ACPD
5, 347–393, 2005 Comparison of modelled and observed Arctic denitrification S. Davies et al. Title Page Abstract Introduction Conclusions References Tables Figures J I J I Back Close Full Screen / EscPrint Version Interactive Discussion
Kleinb ¨ohl, A., and von Koenig, M.: The detection of large HNO3-containing particle in the winter Arctic stratosphere and their role in denitrification, Science, 291, 1026–1031, 2001.
349,353
Fromm, M., Alfred, J., and Pitts, M.: A unified, long-term, high-latitude stratospheric aerosol and cloud database using SAMII, SAGEII and POAMII/III data: Algorithm description, database
5
definition and climatology, J. Geophys. Res., 108, 4366, doi:10.1029/2002JD002772, 2003.
351
Fueglistaler, S., Luo, B. P., Voigt, C., Carslaw, K. S., and Peter, Th.: NAT-rock formation by mother clouds: a microphysical model study, Atmos. Chem. Phys., 2, 93–98, 2002,
SRef-ID: 1680-7324/acp/2002-2-93. 350,369
10
Fueglistaler, S., Buss, S., Luo, B. P., Wernli, H., Flentje, H., Hostetler, C., Poole, L. R., Carslaw, K. S., and Peter, Th.: Detailed modeling of mountain wave PSCs, Atmos. Chem. Phys., 3, 697–712, 2003,
SRef-ID: 1680-7324/acp/2003-3-697. 350
Hu, R.-M., Carslaw, K. S., Hostetler, C., Poole, L. R., Luo, B., Peter, T., Fueglistaler, S.,
15
McGee, T. J., and Burris, J. F.: Microphysical properties of wave polar stratospheric clouds retrieved from lidar measurements during SOLVE/THESEO 2000, J. Geophys. Res., 107, 8294, doi:10.1029/2001JD001125, 2002. 350
Jost, H., Loewenstein, M., Pfister, L., Margitan, J. J., Chang, A. Y., Salawitch, R. J., and Michelsen, H. A.: Laminae in the tropical middle stratosphere: Origin and age estimation,
20
Geophys. Res. Lett., 25, 4337–4340, 1998. 355
Knopf, D. A., Koop, T., Luo, B. P., Weers, U. G., and Peter, Th.: Homogeneous nucleation of NAD and NAT in liquid stratospheric aerosols: insufficient to explain denitrification, Atmos. Chem. Phys., 2, 207–214, 2002,
SRef-ID: 1680-7324/acp/2002-2-207. 350
25
Knudsen, B. M.: Accuracy of arctic stratospheric temperature analyses and the implications for the prediction of polar stratospheric clouds, Geophys. Res. Lett., 23, 3747–3750, 1996.
365,367
Kondo, Y., Schmidt, U., Sugita, T., Engel, A., Koike, M., Aimedieu, P., Gunson, M. R., and Rodriguez, J.: NOy correlation with N2O and CH4in the midlatitude stratosphere, Geophys.
30
Res. Lett., 23, 2369–2372, 1996. 364
Kondo, Y., Irie, H., Koike, M., and Bodecker, G. E.: Denitrification and nitrification in the Arctic stratosphere during the winter of 1996/97, Geophys. Res. Lett., 27, 337–340, 2000. 349,
ACPD
5, 347–393, 2005 Comparison of modelled and observed Arctic denitrification S. Davies et al. Title Page Abstract Introduction Conclusions References Tables Figures J I J I Back Close Full Screen / EscPrint Version Interactive Discussion 361,363
Mann, G. W., Davies, S., Carslaw, K. S., Chipperfield, M. P., and Kettleborough, J.: Polar vortex concentricity as a controlling factor in Arctic denitrification, J. Geophys. Res., 107, D22, 4663, doi:10.1029/2002JD002102, 2002. 349,352,357
Mann, G. W., Davies, S., Carslaw, K. S., and Chipperfield, M. P.: Factors controlling Arctic
5
denitrification in cold winters of the 1990s, Atmos. Chem. Phys., 3, 403–416, 2003,
SRef-ID: 1680-7324/acp/2003-3-403. 349,352,354,355,359,364
Meilinger, S. K., Koop, T., Luo, B. P., Huthwelker, T., Carslaw, K. S., Kreiger, U., Crutzen, P. J., and Peter, Th.: Size-dependent stratospheric droplet composition in mesoscale temperature fluctuations and their potential role in PSC freezing, Geophys. Res. Lett., 22, 3031–3034,
10
1995. 350
M ¨uller, R. and Peter, Th.: The numerical modelling of the sedimentation of polar stratospheric clouds, Ber. Bunsenges. Phys. Chem., 96, 353–361, 1992.
Northway, M. J., Gao, R. S., Popp, P. J., Holecek, J. C., Fahey, D. W., Carslaw, K. S., Tol-bert, M. A., Lait, L. R., Dhaniyala, S., Flanagan, R. C., Wennberg, P. O., Mahoney, M. J.,
15
Herman, R. L., Toon, G. C., and Bui, T. P.: An analysis of large HNO3-containing particels sampled in the Arctic stratosphere during the winter of 1999/2000, J. Geophys. Res., 108, doi:10.1029/2001JD001079, 2002. 349,353,355
Pagan, K. L., Tabazadeh, A., Drdla, K., Hervig, M. E., Eckermann, S. D., Browell, E. V., Legg, M. J., and Foschi, P. G.: Observational evidence against mountain-wave
genera-20
tion of ice nuclei as a prerequisite for the formation of three solid nitric acid polar strato-spheric clouds observed in the Arctic in early December 1999, J. Geophys. Res., 109, doi:10.1029/2003JD003846, 2004. 351
Pawson, S. and Naujokat, B.: The cold winters of the middle 1990s in the northern lower stratosphere, J. Geophys. Res., 104, 14 209–14 222, 1999. 354
25
Popp, P., Northway, M. J., Holecek, J. C., Gao, R. S., Fahey, D. W., Elkins, J. W., Hurst, D. F., Romashkin, P. A., Toon, G. C., Sen, B., Schauffler, S. M., Salawitch, R. J., Webster, C. R., Herman, R. L., Jost, H., Bui, T. P., Newman, P. A., and Lait, L. R.: Severe and extensive denitrification in the 1999–2000 Arctic winter stratosphere, Geophys. Res. Lett., 28, 2875– 2878, 2001. 355
30
Salcedo, D., Molina, L. T., and Molina, M. J.: Homogeneous freezing of concentrated aqueous nitric acid solutions at polar stratospheric temperatures, J. Phys. Chem. A, 105, 1433–1439, 2001. 350
ACPD
5, 347–393, 2005 Comparison of modelled and observed Arctic denitrification S. Davies et al. Title Page Abstract Introduction Conclusions References Tables Figures J I J I Back Close Full Screen / EscPrint Version Interactive Discussion
Saitoh, N., Hayashida, S., Sasano, Y., and Pan, L. L.: Characteristics of Arctic polar strato-spheric clouds in the winter of 1996/1997 inferred from ILAS measurements, J. Geophys. Res., 107, D24, 8205, doi:10.1029/2001JD000595, 2002. 351
Sander, S. P., Ravishankara, A. R., Friedel, R. R., et al.: Chemical Kinetics and Photochemical Data for Use in Stratospheric Modeling, Evaluation 13, JPL Publ., 00–3, 2000. 352
5
Santee, M. L., Manney, G. L., Livsey, N. J., and Waters, J. W.: UARS Microwave Limb Sounder observations of denitrification ond ozone loss in the 2000 Arctic late winter, Geophys. Res. Lett., 27, 2313–2316, 2000. 349,358,363
Sasano, Y., Suzuki, M., Yokota, T., and Kanawa, H.: Improved Limb Atmospheric Spectrometer (ILAS) for stratospheric ozone layer measurements by solar occultation technique, Geophys.
10
Res. Lett., 26, 197–200, 1999. 360
Spang, R., Riese, M., and Offermann, D.: CRISTA-2 observations of the south polar vortex in winter 1997: A new dataset for polar process studies, Geophys. Res. Lett., 28, 3159–3162, 2001. 351
Sugita, T., Kondo, Y., Nakajima, H., Schmidt, U., Engel, A., Oelhaf, H., Wetzel, G., Koike, M.,
15
and Newman, P. A.: Denitrification observed inside the Arctic vortex in February 1995, J. Geophys. Res., 103, 16 221–16 223, 1998. 349,361,368
Tabazadeh, A.: Role of the stratospheric polar freezing belt in denitrification, Science, 291, 2591–2594, 2001. 350
Tabazadeh, A.: Commentary on “Homogeneous nucleation of NAD and NAT in liquid
strato-20
spheric aerosols: insufficient to explain denitrification” by Knopf et al., Atmos. Chem. Phys., 3, 863–865, 2003,
SRef-ID: 1680-7324/acp/2003-3-863. 350
Tabazadeh, A., Toon, O. B., Gary, B. L., Bacmeister, J. T., and Schoeberl, M. R.: Observational constraints on the formation of type1a polar stratospheric clouds, Geophys. Res. Lett., 23,
25
2109–2112, 1996.
Tabazadeh, A., Djikaev, Y. S., Hammill, P., and Reiss, H.: Laboratory evidence for surface nucleation of solid polar stratospheric clouds, J. Phys. Chem. A, 106, 43, 10 238–10 246, 2002.
Toon, G. C., Farmer, C. B., Schaper, P. W., et al.: Evidence for subsidence in the 1989 Arctic
30
winter stratosphere from airborne infrared composition measurements, J. Geophys. Res., 97, 7963–7970, 1992. 354