Vanhove, richness o Research, Contact: J Fribourg, Copyright No Deriva
Pred
richn
Port
indic
Jan Van
Institute o Abstract: be predic 3,060 Fre year-olds 150 indice be predict texts coul greatest p with fewe with a sing Keywords modelling J., Bonvin, A., L of short French, G 10(3), 499-525 an Vanhove, Un 1700 | Switzerla t: Earli | This arti ative Works 3.0dicting
ness of
uguese
ces
nhove, Aud
of Multilingua We investigated cted on the basnch, German an were rated for t es were derived ted on the basis d be predicted redictive power er predictors bas gle, easily comp s: human rating g
Lambelet, A., & German, and Po . https://doi.org niversity of Fribo and – jan.vanho cle is published Unported licens
percep
f short
e texts
drey Bonvin
lism, Fribourgd how well read is of automatic nd Portuguese te their lexical rich from these text s of these indice was comparab r was attained b sed on a 6-dime puted predictor, gs, lexical dive Berthele, R. (20 ortuguese texts u g/10.17239/jowr ourg, Departmen [email protected]. d under Creative se.
ptions o
French
using t
n, Amelia La
| Switzerland ders’ perception ally computabl exts (between 9 hness by betwee ts. We found tha es and that the a ble to that of lo by opaque mod ensional framew Guiraud’s index ersity, lexical so 19). Predicting p using text-based r-2019.10.03.04 nt of Multilingua Commons Attriof the l
h, Germ
text-ba
ambelet & R
s of the lexical e indices of the and 284 words en 3 and 18 un at the ratings co accuracy with w onger texts. For dels with scores work of lexical rix, fared only slig ophistication, le perceptions of th indices. Journal 4 alism, Rue de Ro bution-Noncom
exical
man, an
sed
Raphael Be
richness of shor e texts’ lexical long) written b instructed raters uld to a substan which the ratings French and Ge of predictors, b chness perceptio ghtly worse. exical richness, he lexical of Writing ome 1,mmercial-nd
rthele
rt texts can properties. by 8- to 10-s, and over ntial degree s of shorter erman, the but models on or even predictiveVANHOVE, BONVIN, LAMBELET, & BERTHELE PREDICTING LEXICAL RICHNESS | 500
1. Introduction
The present study is about how and how well perceptions of written texts can be predicted on the basis of quantifiable characteristics of those texts. Its backdrop is a substantial body of research that has investigated the textual characteristics that affect expert ratings of text quality. In addition to the number of formal errors in the texts and the use of syntactic and cohesive devices, these characteristics include text length, the complexity and sophistication of the words used in the text, and the variety of the words in the text. Of particular relevance to the present study, metrics related to the quantity, range, and variety of the vocabulary used in a text—that is, metrics related to the text’s lexical richness—are important predictors of writing quality as judged by experts (e.g., Crossley & McNamara, 2011; Engber, 1995; Grobe, 1981; Jarvis, 2002; Jarvis, Grant, Bikowski, & Ferris, 2003; Malvern, Richards, Chipere, & Durán, 2004; McNamara, Crossley, & McCarthy, 2010; Nold & Freedman, 1977).1
Yet, as Jarvis (2013a) points out, despite the proliferation of lexical richness metrics in quantitative linguistics, it is not clear how well these do indeed measure aspects of lexical richness. To elaborate, lexical richness metrics are generally evaluated on the basis of how sensitive they are to text length (e.g., McCarthy & Jarvis, 2007, 2013; Treffers-Daller, 2013; Tweedie & Baayen, 1998) and how well they correlate with variables representing other constructs, such as essay quality, language proficiency or other writer and talker characteristics (e.g., Daller, van Hout, & Treffers-Daller, 2003; Treffers-Daller, 2013; Treffers-Daller, Parslow, & Williams, 2016). But what is unclear is how well any given lexical richness metric measures what it is intended to measure: some aspect of lexical richness. As Jarvis (2013a) writes,
“the problem is not that the existing measures fail to predict language proficiency, aphasia, and so forth; the problem is that they lack construct validity because they have not been derived from a well-developed theoretical model of lexical diversity [i.e., what we call lexical richness].” (p. 95)
Jarvis (2013a) suggests that progress can be made by validating lexical richness metrics not in terms of how well they avoid text-length artefacts or how well they are correlated to manifestations of other constructs, but “in accordance with their ability to predict the lexical diversity [i.e., lexical richness] judgments of human raters” (p. 101). That is, he suggests that lexical richness be treated as a perceptual phenomenon, and more specifically, he argues that it is the judgement of untrained human raters that should be the touchstone of lexical richness metrics. In addition, Jarvis (2013a, 2013b, 2017) proposes that the perceptual phenomenon of lexical richness may be captured in a limited number of dimensions, which we outline in the next section.
The present study contributes to the research programme proposed by Jarvis. We collected data on the lexical richness of 3,060 French, German, and Portuguese texts written by third and fourth graders as perceived by untrained native speakers of the
501 | JOURNAL OF WRITING RESEARCH
respective languages. This database supplements a literature on human ratings dominated by English texts written by older students and judged by experts. For each of these texts, we computed a large number of indices that were conceivably related to these lexical richness perceptions. These indices were then used to build statistical models capable of predicting a text’s perceived lexical richness. Our chief goals in doing so were (a) to assess how well perceptions of lexical richness can be predicted using text-based indices and (b) to gauge to what extent Jarvis’ dimensional framework of perceived lexical richness trades off predictive power for theoretical interpretability. Our results suggest, first, that perceptions of lexical richness can to a substantial degree be predicted using text-based indices, even when the raters are not trained, and, second, that the trade-off between predictive power and theoretical interpretability entailed by Jarvis’ dimensional framework is modest.
1.1
A dimensional framework of lexical richness
Jarvis (2013a, 2013b, 2017) suggests that the perceptual phenomenon of lexical richness may be captured in at least six dimensions: volume, variability, evenness, rarity, disparity, and dispersion.2
Volume refers to the texts’ length, which can be expressed as the number of words they contain. Ordinarily, text length is seen as a confounding factor in research on lexical richness as most metrics of word repetition cannot sensibly be compared between texts of different length (e.g., Koizumi, 2012; Malvern et al., 2004). However, Jarvis’ framework is concerned with how readers perceive lexical richness, and so is our study. The inclusion of the volume dimension reflects the possibility that readers may differentially perceive the lexical richness of otherwise comparable texts depending on their length.
Variability is the complement of word repetition. In other studies, this is often referred to as lexical diversity (see Note 1). A wide array of measures represent attempts to quantify variability, the most well-known of which is the type–token ratio (TTR), that is, the ratio of the number of unique words (types) to the number total words (tokens) in the text. Due to their design and the properties of language, most of these measures are, like the TTR, systematically related to text length such that they overlap with the first dimension, volume.
Evenness is intended to capture differences in the extent to which tokens of different types contribute to the text: Is there one type occurring regularly and other types all occurring rarely, or do different types all occur about equally frequently? Jarvis (2013b) uses the standard deviation of the counts of tokens per type as a first operationalisation of evenness.
Rarity concerns the frequency with which the words used in the text occur in the language at large. Previous research has expressed rarity as the proportion of words occurring in the text that do not belong to the n most frequent in the language (e.g., Laufer & Nation, 1995), the words’ mean frequency in an external frequency list (e.g., Kyle & Crossley, 2015), or the words’ mean frequency rank according to an external
VANHOVE, BONVIN, LAMBELET, & BERTHELE PREDICTING LEXICAL RICHNESS | 502
frequency list (e.g., Jarvis, 2013b). In other studies, measures related to word frequency are often referred to as measures of lexical sophistication.
Disparity refers to how similar semantically or formally the words in the text are (Jarvis, 2013a, 2017). Jarvis (2013b) operationalises semantic similarity as the “mean number of words in the text that share the same semantic sense” according to WordNet. We are not aware of similar tools for French, German and Portuguese, so we will leave semantic disparity out of consideration. Jarvis (2013b) does not propose an operationalisation of formal disparity.
Dispersion, finally, pertains to whether tokens of the same type are distributed uniformly throughout the text or are clustered around the same place in the text. Jarvis (2013b) operationalised this as the average distance between different tokens of the same type, averaged over all types in the text, but currently, he computes it as the number of times that types are repeated within the next n (e.g., 20) tokens (personal correspondence, August 2, 2017). The total number of ‘close repeats’ is then divided by the total number of tokens. For this computation, the top-5 most frequent types in the language are not taken into account.
1.2
Accounting for human ratings using lexical indices
How well do these six dimensions account for perceptions of lexical richness? Whereas a handful of studies, which we will discuss shortly, used text-based indices to account for expert ratings of essay quality or of lexical proficiency, only one set of four related studies directly attempted to model non-experts’ perceptions of the texts’ lexical richness. In these studies, which were conducted by Jarvis (2013b, 2017) over the course of five years, different cohorts of 11 to 21 language teachers and linguistics students each rated the lexical richness of the same 50–60 English narrative retells on a 10-point scale. The texts were written by native speakers of English, Finnish, and Swedish, and varied in length between 24 and 578 words. The raters were not trained or given a rubric, but “lexical diversity” (Jarvis uses this term whereas we use “lexical richness”) was defined for them as the variety of words in a text, and they were shown a sample text of average lexical diversity for reference. The results indicated, firstly, that the ratings were consistent across raters, with Cronbach’s α for the three largest studies ranging between 0.90 and 0.96. Secondly, by scrambling the words in the texts, Jarvis (2017) ingeniously demonstrated that perceptions of lexical richness do not seem to be strongly affected by other factors related to writing quality or language proficiency (e.g., syntactic complexity and cohesion). Thirdly, the mean ratings per text could to a substantial degree be accounted for using indices that correspond to dimensions in Jarvis’ framework: Jarvis (2013b) reports that six indices extracted from the texts accounted for about half of the variance in perceptions of lexical richness in the first— and least reliable—of the four studies (R² = 0.48).3
Jarvis’ (2013b) study indicates that human ratings of lexical richness are predictable to some degree, but it could be fruitful to consider other operationalisations of the dimensions he proposed. Furthermore, it is not a priori clear if text-based metrics of
503 | JOURNAL OF WRITING RESEARCH
lexical richness should be linearly related to perceived lexical richness, so it may be worthwhile to experiment with statistical models that do not assume linear relationships between the indices and the perceptions. Finally, it is conceivable that the text-based indices stand in non-additive relationships to lexical richness perceptions (on the possibility of interacting effects in judgements of writing quality, see Jarvis et al., 2003), so it may also be worthwhile to allow for interaction effects in the models.
While Jarvis’ (2013b, 2017) are the only studies that concerned lexical richness ratings by untrained raters, a number of studies sought to establish how well text-based indices predict expert ratings of overall text quality. Here, metrics associated with the variability (Crossley & McNamara, 2011; Engber, 1995; Grobe, 1981; Jarvis, 2002; Kuiken & Vedder, 2014; Malvern et al., 2004; McNamara et al., 2010), rarity (Crossley & McNamara, 2011; Guo, Crossley, & McNamara, 2013; Malvern et al., 2004; McNamara et al., 2010), and volume dimensions (Grobe, 1981; Jarvis et al., 2003; Nold & Freedman, 1977) helped to account for variance in the ratings. Additionally, variability, rarity, and volume metrics can be used as predictors for related constructs such as lexical proficiency and overall language proficiency (e.g., Crossley, Cobb, & McNamara, 2013; Crossley, Salsbury, & McNamara, 2011; Crossley, Salsbury, McNamara, & Jarvis, 2010; Kyle & Crossley, 2015; Laufer & Nation, 1995).
1.3
The present study
In the present study, we aim at furthering our understanding of text-based determinants of perceived lexical richness. That is, we follow Jarvis in treating lexical richness as a perceptual phenomenon: A text’s perceived lexical richness is whatever a panel of uninstructed readers think it is. Our focus is primarily on the text-based indices’ utility in predicting these perceptions.
The texts for which we collected these lexical richness perceptions stem from comparable French, German, and Portuguese corpora. While we will not address the question whether lexical richness perceptions can more accurately be predicted in one language compared to the others, analysing texts in three different languages in parallel offers the advantage that we can gauge to what extent the results (for instance, with respect to how particular text-based indices relate to perceptions of lexical richness or with respect to how strongly Jarvis’ dimensional framework trades off predictive power for theoretical interpretability) are comparable across these three languages and may perhaps generalise to others. The issue of the robustness of the results with respect to the language that the texts were written in is also relevant in view of some more or less arbitrary language-specific decisions that researchers need to take when computing text-based indices. Examples of such decisions are whether to consider German sie ‘she; they’ and Sie ‘you (formal)’ as belonging to one, two or three different lemmata and whether to consider Portuguese fuses between prepositions and determiners (e.g., neste from em + este ‘in this’) as belonging to the preposition lemma (em), the determiner lemma (este), both lemmata (both em and este), or a sui generis lemma (neste).
VANHOVE, BONVIN, LAMBELET, & BERTHELE PREDICTING LEXICAL RICHNESS | 504
An important aim of the present study concerns the trade-off between theoretical insight and predictive power when modelling perceptions of lexical richness. Typically, theoretical models are simplifying abstractions developed to render their subject matter more understandable. Such theoretical insight may come at the price of a loss in predictive power if the theoretical model disregards information that is available or makes simplifying assumptions about the relationship between the predictors and the outcome. Jarvis’ (2013b) approach of conceptually deriving a limited number of dimensions relevant to perceived lexical richness and modelling human judgements using one (linear) predictor per dimension in a multiple regression model offers theoretical clarity. However, it would also be informative to assess how much predictive power is lost by limiting oneself to a few non-interacting, independent predictors in this way. Such insight would help researchers find out how strongly the theoretical model trades off data fit for conceptual understanding and may help them identify areas where the theoretical model can be improved upon (see Yarkoni & Westfall, 2017). To this end, we considered a wide array of predictors and allowed for the possibility that these have non-linear effects on human ratings and interact with one another. While multiple linear regression offers the advantage that its output is fairly interpretable, less transparent models and algorithms capable of identifying non-linear effects and interactions and dealing with a multitude of predictors (so-called black boxes) could yield greater predictive power. For this reason, the present study will explore, firstly, how well black-box algorithms can predict human ratings and, secondly, how much predictive power is lost by adopting more transparent models with fewer predictors selected for their fit with Jarvis’ (2013a) framework.
The final aim of this study concerns the role of text length. Many measures of variability, by their design and due to the properties of languages, are affected by text length. This jeopardises comparisons of texts of different lengths on these measures. To solve these problems, researchers often constrain the text-length range in their sample (e.g., Crossley et al., 2010; Treffers-Daller, 2013; Treffers-Daller et al., 2016). However, comparing texts on such measures is not our goal; using these measures as predictors of perceived lexical richness is. If these perceptions are affected by the texts’ length, then this is important to find out (see also Jarvis, 2013a). Relatedly, indices of variability are sometimes argued not to be valid for shorter texts. Koizumi (2012), for instance, recommends that the MTLD measure introduced by McCarthy and Jarvis (2010) should not be used for texts shorter than 100 tokens. The vast majority of the texts that we analyse, however, are shorter than that—which addresses a desideratum identified by McCarthy and Jarvis (2013) and Meara (2014). It is ultimately an empirical question how useful any text-based indices are for predicting lexical richness perceptions for short texts. Accordingly, the third goal of this study is to assess how strongly the predictability of human lexical richness ratings is compromised for very short texts.
To recapitulate, we ask how well text-based indices can predict uninstructed raters’ perceptions of lexical richness for short French, German, and Portuguese texts if model interpretability is not an issue and how well more theoretically interpretable models
505 | JOURNAL OF WRITING RESEARCH
emulate this predictive power. Moreover, we ask if text-based indices are as useful for predicting the ratings of very short texts as they are for predicting the ratings of somewhat longer texts.
2. Method
We had a total of 3,060 French, German, and Portuguese texts written by 8- to 10-year-old children rated for their lexical richness by between three and 18 untrained native speakers each. From these texts, we extracted over 150 indices of word repetition, frequency etc., which we used to fit various statistical models in order to predict the average rating per text. To offset the danger of getting overly optimistic results inherent to exploratory analyses (‘overfitting’), we cross-validated the models and, additionally, fitted them to independent hold-out sets.
All materials (texts, lemmatisation scripts, index-extraction scripts, Internet platform for collecting the ratings, datasets, and analysis scripts) are available from https://osf.io/vw4pc/. In order to keep this article readable, we only provide a summary of the study’s methods as well as a couple of details that we deem crucial for understanding the results and judging the soundness of our conclusions. However, interested readers can refer to the project’s technical report (Vanhove, 2018) for more details about all steps involved.
2.1
Texts
The texts were collected in a project that aimed to investigate the bilingual development of children with Portuguese as a heritage language (PHL) living in French- and German-speaking Switzerland (see Lambelet, Berthele, Desgrippes, Pestana, & Vanhove, 2017). 482 children wrote short argumentative and narrative texts at three points in time; they were on average 8;8 years old at the first data collection and 10;3 at the third. 114 of them were PHL speakers in French-speaking Switzerland; 119 were PHL speakers in the country’s German-speaking part; the others were other pupils in French-speaking Switzerland (78), in German-speaking Switzerland (80), and in Portugal (91). PHL speakers wrote argumentative and narrative texts4 in both Portuguese and French or German at each point in time, the rest only in their school language. Due to subject unavailability, some data are missing at each data collection.
The texts were corrected morphosyntactically, orthographically, and in terms of their punctuation. For instance, inappropriate or missing suffixes were corrected (e.g., German adjectives in the wrong case or missing French plural -s). Inappropriate lexical choices were not changed. Since we could not expect raters to judge the lexical richness of over 1,000 texts per language, we created twenty sets of 50–52 texts each for each language. Of the 3,760 texts that were written, we presented 3,060 texts to the raters. Texts consisting of fewer than 45 letters were not presented nor were texts without a single finite verb. Other than that, the selection was effected at random. The texts for each language were split up into twenty sets that were maximally similar in
terms of of argum The t French, 3 tokens o fewer. Th Figure 1:
2.2
R
Raters. W asked the The rater Only were inc texts.5 T providing For the n Table 1.D Number Median Percenta Percenta Percenta Percenta VAN the number o mentative vs. na texts retained 33 for German or fewer; for Ghe full text leng
: The number of
Ratings
We recruited em to rate the rs were not pai y raters who co luded in the a he remaining g the same ra number of rater Description of th r of raters age (years) age men age linguists age teachers age students NHOVE, BONVIN, f texts written arrative texts, a for rating wer n, and 39 for P German, 66 to gth distribution
tokens in the te the data are plo
native speake e lexical richn id for their par onsidered them analysis. We o
ratings were ting), and data rs retained and he rater sample. French 146 27 21 10 16 47
LAMBELET, & BER
by children fr and the time a re short: the m Portuguese. 90
okens or fewe ns are shown
exts rated. Since otted along a log
er raters via so ness of the chi
rticipation. mselves native only analysed d checked for a from four ra d further detail RTHELE PREDICTI
rom the differe t which the tex median text le 0% of the Fren er; and for Po in Figure 1.
these distributio garithmic x-axis.
ocial and pro ldren’s texts o e speakers of t data from rate satisficing pat aters were disc
ls, see Table 1 German 322 25 17 8 26 57 NG LEXICAL RICH ent regions, th xts were writte ngth was 37 t ch texts consis ortuguese, 90
ons are positively . fessional netw on an Internet the respective rs who rated a terns (e.g., co carded becaus . Portugu 106 35 30 14 15 23 HNESS | 506 e number en. tokens for sted of 81 tokens or y skewed, works and platform. language at least 48 onsistently se of this. uese
507 | JOUR Procedur question richness numbere fairly goo as we w also stres children been wr backgrou The num all texts rater—an session w included RNAL OF WRITING re. The raters naire. They w (‘richness of ed values of wh od, 9 = very go were interested ssed in the in in primary sch ritten nor tha und living in Sw
Fi
mbers of raters within the set nd only those, which served
in the analyse
G RESEARCH
s accessed an were then aske the vocabular hich were labe ood); see Figur in the raters’ nstructions. Th hool, but they
t some texts witzerland.
igure 2. The Fren
retained varied t assigned to t
with the exce to familiarise es. n Internet pla ed to read th ry used in the elled (1 = very re 2. The instru ’ intuitive perc he raters were y were not told were produc nch version of th d between the them—present ption of two a e them with atform where e 50–52 texts e text’) on a 9 y bad, 3 = fairl uctions did no ception of lex e told that the d at which poi ced by childr
he rating interfac
e text sets, see ted in a new additional texts the task. The
they first fi s and rate the 9-point scale, y bad, 5 = ave t define lexica xical richness. e texts were w nt in time the ren with a P ce. Table 2. The r random order s at the beginn se two texts lled in a eir lexical the odd-erage, 7 = al richness This was written by texts had Portuguese raters saw r for each ning of the were not
VANHOVE, BONVIN, LAMBELET, & BERTHELE PREDICTING LEXICAL RICHNESS | 508
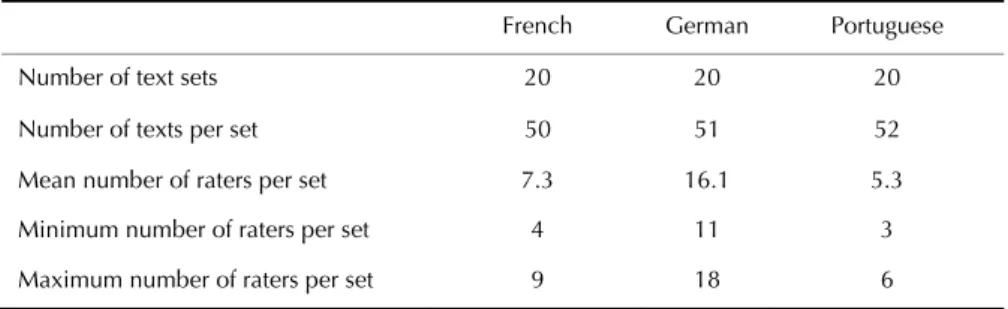
Table 2.Number of texts and raters per set of texts.
French German Portuguese
Number of text sets 20 20 20
Number of texts per set 50 51 52
Mean number of raters per set 7.3 16.1 5.3
Minimum number of raters per set 4 11 3
Maximum number of raters per set 9 18 6
2.3
Text-based indices
In order to compute the text-based indices, the texts were first tagged and lemmatised using the koRpus package (Michalke, 2017) for R (on the advantages of lemmatisation, see Treffers-Daller, 2013). This process involved a number of manual tweaks, which are fully documented in the project’s technical report (Chapter 4). Once tagged and lemmatised, over 150 text-based indices were computed for each text. These are discussed in brief below; for a more detailed discussion, see the technical report (Chapters 5–7). They are organised here according to Jarvis’ (2013a) six dimensions of perceived lexical richness.
Volume. Volume-related indices included the number of tokens, types, unique lemmata, part-of-speech-specific word counts, and the number of sentences.
Variability. The measures of variability computed included ten measures based solely on the number of types and tokens occurring in the texts, namely the type–token ratio (TTR), Guiraud’s (1954) root-TTR, and eight other measures discussed by Tweedie and Baayen (1998). Lemma-based variants of these measures, e.g., Guiraud’s root-TTR computed with respect to lemmata, were also computed. Type–token ratios were also computed split up by part of speech. Additionally, we computed Yule’s (1944) K, three variants of Johnson’s (1944) mean segmental type–token ratio (MSTTR), three variants of the HD-D value (McCarthy & Jarvis, 2007), four variants of Covington and McFall’s (2010) moving-average type–token ratio (MATTR), and four variants of McCarthy and Jarvis’ (2010) measure of textual lexical diversity (MTLD).
Evenness. Following Jarvis (2013b), evenness indices were computed by counting the number of tokens per type/lemma and calculating their standard deviation. Higher values reflect less evenness.
Rarity. Rarity measures were computed by looking up the frequencies of the words occurring in the text in frequency corpora. These measures were computed with respect to both the tokens and the lemmata in the text. The corpora used were Lexique 3 (New, Brysbaert, Veronis, & Pallier, 2007), SUBTLEX-DE (Brysbaert et al., 2011), and SUBTLEX-PT (Soares et al., 2015). We lemmatised SUBTLEX-DE and SUBTLEX-PT in order to compute lemma-based rarity measures; Lexique 3 already contains lemma information.
509 | JOURNAL OF WRITING RESEARCH
Four types of rarity measures were computed: frequency bands (cf. Laufer & Nation, 1995, e.g., Which proportion of the text do the 100 most frequent words in the language account for?), frequency summaries (cf. Kyle & Crossley, 2015, e.g., What is the mean corpus frequency of the words in the text?), frequency rank summaries (cf. Jarvis, 2013b, e.g., What is the mean corpus frequency of the words in the text?), and six variants each of Daller et al.’s (2003) ‘advanced’ type–token and Guiraud indices. The latter are computed like the ordinary TTR and Guiraud indices, but with only the number of ‘advanced’ (i.e., relatively rare) types in the numerator.
Disparity. No index of semantic disparity was computed. Formal disparity was not operationalised by Jarvis (2013b); our first attempt at a formal disparity measure was computed as follows. We computed string-edit distances between each type or unique lemma in the text and every other type or unique lemma in the text and then took the mean of all distances. The string-edit distances were computed using the Levenshtein algorithm, which computes the minimum number of operations (insertions, deletions, substitutions) required to transform one string into another. This operation cost was length-normalised (see the technical report, Chapter 7, for an example). Higher mean Levenshtein distances indicate more formal disparity in the text.
Dispersion. The dispersion index was computed following Jarvis (personal correspondence, August 2, 2017): For the ith word in the text (i ∈ 1, 2, …, n), we looked up how often it occurred in the next k words (i.e., words i+1 through i+k). For all n words except the five most frequent in the language’s frequency list, the number of ‘close repeats’ was summed and then divided by the total number of words. Six such dispersion indices were computed (varying k). Higher values reflect more ‘clustericity’ and hence less dispersion.
Miscellaneous. We computed measures of syntactic complexity (e.g., the number of conjunctions), lexical complexity (the mean number of letters per token), and lexical density (the proportion of tokens belonging to open word classes). A variable indicating whether the text was narrative or argumentative was also included as a predictor since this information was also available to the raters, but information about the children or the time when the text was written was not. Some of these measures (e.g., syntactic complexity) may seem unrelated to lexical richness proper but were included as they might conceivably affect untrained raters’ perceptions.
2.4
Method of analysis
The goal of the analysis is to model the human ratings of the texts’ lexical richness in terms of text-based properties. To this end, we used as the outcome variable the mean human rating per text. The text-based indices listed earlier served as potential predictors. Model fit was evaluated using the root mean square error (RMSE), that is, the square root of the mean squared discrepancy between the model’s predictions ( ) and the actually observed values (yi; i.e., RMSE = ∑ − ). Since most other studies
VANHOVE, BONVIN, LAMBELET, & BERTHELE PREDICTING LEXICAL RICHNESS | 510
Since it is not a priori clear which measures of variability, rarity etc. predict human ratings, this analysis is strongly exploratory. To offset the danger that extensive data exploration would lead to a model that tightly fits the present data but that does a poor job predicting similar but new data, we partitioned the data into a training and a test set, then applied various models and algorithms to the training set, used resampling techniques to adjudicate between different models, and, finally, used the models selected to predict the test set data. The caret package (Kuhn, 2017) for R served as the main computational tool.
Data partitioning. The training set consisted of a random selection of 16 out of 20 text sets per language; the test set consisted of the remaining 4 text sets. Since each text set was rated by a different panel of raters, the data in the test set are neither affected by the texts in the training set nor by the raters who rated the texts in the training set.
To the training set, a host of exploratory and modelling techniques were applied in order to find one or several statistical models with the greatest predictive power. The test set was not looked at until the very end of the analysis, at which point the final predictive models or algorithms constructed and selected on the basis of the training sets were applied to the test set in order to assess their predictive accuracy for different texts judged by different rater panels. At no point were the test data used to construct or re-estimate the models or algorithms. Moreover, the models were not respecified after we learnt about their performance in the test set.
Exploratory and modelling techniques. We applied a series of models and algorithms (‘models’ for short), many of which capable of dealing with a fairly large number of predictors and of capitalising on non-linearities and interaction effects. In addition to multiple linear regression (with and without prior principal component analysis), these were robust regression, ridge regression, elastic net, multivariate adaptive regression splines, partial least squares regression, k-nearest neighbours, regression trees, random forests (both CART and conditional inference-based), support vector machines, stochastic gradient boosting, and Cubist. A technique known as ‘stacking’, in which predictions from multiple models are combined and which may yield further improvements in predictive accuracy (see Breiman, 1996), was also applied; fourteen models per language were stacked. We do not discuss the architecture of these different models but instead refer to Chapters 5 through 8 in Kuhn and Johnson (2013). What is important here is that by applying these different models we were able to gauge how well human ratings of lexical richness could be predicted on the basis of text-based properties if interpretability were not an issue.
Many of these models are known as ‘black boxes’, that is, the precise way in which they relate a set of input values to a predicted outcome can be difficult to understand. Indeed, even for linear regression models, it can be difficult to assess the independent effect of each predictor on the outcome: a model coefficient might tell you how the outcome is expected to change when varying the TTR while keeping the numbers of types and tokens constant, but this is obviously impossible to do. Moreover, models with substantial different architectures often had similar predictive power.
511 | JOURNAL OF WRITING RESEARCH
While this underscores that when it comes to predicting outcomes on the basis of moderately rich predictor data, there are many ways to skin a cat (the ‘Rashomon effect’, see Breiman, 2001), it further compounds their lack of interpretability. Thus, we also fitted more transparent models whose construction was guided by Jarvis’ (2013a) 6-dimensional theoretical framework (a 6-predictor model) to see how well the black boxes’ predictive power could be emulated using only a handful of predictors.
When exploring the training data, we noticed that it may be possible to achieve reasonable predictive accuracy using a simpler model still—simpler both in terms of how the predictor values could be computed and in terms of how easily these predictor values could be translated into a predicted lexical richness perception rating. We therefore also included in the Results section the results of this ‘single-predictor approach’.
For reference, the performance of an intercept-only regression model (without any predictors) is also reported; such a model would predict all test data to be equal to the mean of the training data. (This is the value mentioned in Note 6.)
Cross-validation. When trying out different models on the training data, we used cross-validation to estimate how well the models would work for new data. This was done to ensure that overzealous data exploration and model fine-tuning would not result in a model that fits the training data well but stands little chance of predicting the test data (see Kuhn & Johnson, 2013; Yarkoni & Westfall, 2017). In cross-validation, the training data is split up into a number (k) of folds, and models are fitted on k − 1 folds and then used to predict the outcome in the remaining fold. This process is repeated k times, each time leaving out a different fold, which yields k estimates of the models’ predictive accuracy on unseen data (viz., the root mean square error, RMSE) that can then be averaged. To account for the dependency structure in the data (some mean ratings are based on ratings by the same judges), block cross-validation was used: rather than constructing the folds randomly, each of the sixteen text sets per language in the training data was used 15 times in its entirety for training and once for prediction. This way, the texts in each predicted fold were all rated by different raters from the texts in the other 15 folds. Figure 3 illustrates the principles behind the partitioning of the data and block cross-validation.
Predictor selection and transformation. Unsurprisingly, many predictor variables turned out to be strongly linearly or non-linearly correlated with each other. While collinearity does not dramatically affect the performance of predictive models, (near-) perfect correlations between predictors were resolved by dropping some of the offending predictors. The choice about which variable to drop was made mostly on a conceptual basis. For instance, when type- and lemma-based variables were nearly perfectly correlated, the lemma-based variable was retained. In total, 111 predictors were retained for each language. All of these were fed to the black-box models.
Many of the predictors were severely right-skewed, so that a Yeo–Johnson transformation (a generalisation of the Box–Cox family of transformations that can
Figur ho show wer accomm entire pre training s and scale
3. Resu
3.1
S
A reliabi extent sy we comp coefficie (1979) u coefficie raters on ICC(2,k) VAN re 3. Illustration ow block cross-v wn; in reality, six re rated by a pan odate zeroes edictor set; th set only. The ed using their tults
ystematicity
ility analysis s ystematic. For puted the reli nt (where k is using the psyc nt assumes th
e is actually i coefficients av
NHOVE, BONVIN,
of how the data validation works xteen took place nel of judges. Th
and negative e form of the predictors wer training set sta
and reliabili
suggests that t each rater pa iability of the s the number ch package fo at the raters i nterested in a veraged 0.79;LAMBELET, & BER
a were partitione s. Only two itera e for each mode he panels of judg
values; Yeo & transformation re subsequent andard deviatio
ty
the judgemen nel, that is, fo mean ratings of raters) as or R (Revelle in the study a and wishes to for German, 0 RTHELE PREDICTI ed into a training ations of block c el. Each ‘Set’ refe ges for different
& Johnson, 20 n was determi ly centred at t ons. ts of untraine or each set of s in terms of recommended e, 2017). Unl are but a subs generalise to. 0.90; for Portug
NG LEXICAL RICH
g and a test set a cross-validation a ers to 50-52 text
sets did not ove
00) was appli ned on the ba their training s ed raters are t texts in each the ICC(2,k) d by Shrout a ike Cronbach et of the popu For French, th guese, 0.71. T HNESS | 512 and of are ts that erlap. ied to the asis of the set means to a large language, reliability and Fleiss ’s α, this ulation of he twenty The higher
513 | JOURNAL OF WRITING RESEARCH
reliability for German primarily reflects the fact that the mean ratings were based on more individual ratings. These reliability estimates are clearly lower than Jarvis (2017) reported; we will return to these differences in the Discussion.
The reliability of the outcome variable (mean perceived lexical richness) effectively puts a ceiling on how well a model can be expected to predict new data, so that the models for French and Portuguese can be expected to have poorer predictive power than the one for German. Hence, we do not compare models’ predictive power between languages but only within each language.
3.2
Overall predictive accuracy
Black box approach. Several black-box models had a similar predictive accuracy in cross-validation (see technical report, Chapters 11–13). Model stacking, in which the outcomes predicted by several individual models were used as predictors in a second-level model, tended to yield slightly improved predictions in cross-validation and was consequently used to gauge how well lexical richness ratings can be predicted if model interpretability is of little importance.
Figure 4 shows the predictive accuracy of the black-box approach in cross-validation and in the independent test sets. Relative to the reference model containing no predictors, this approach yields a substantial improvement in predictive accuracy: while the average error (roughly speaking) of the oversimplistic models hovers around 1.2 points on the 9-point scale for French and German and around 1.3–1.5 points for Portuguese, it is reduced by some 0.31–0.36 points for French and some 0.45–0.48 points for German and Portuguese. For the sake of completeness, Figure 4 also shows the coefficients of determination of the black-box approach, but see Note 6 about the use of R² for evaluating model fit.7
Six-dimension approach. While we can predict human ratings with some degree of accuracy by taking a black-box approach, this offers little in the way of theoretical interpretability. We also modelled the human ratings in smaller, more interpretable models in which each of the six dimensions identified by Jarvis (2013a, 2013a) was represented by a single predictor variable. For volume, the number of tokens was chosen as the most straightforward operationalisation. For variability, the MTLD was chosen as it is in principle orthogonal to text length; its TTR threshold was set to 0.83.
Figure 4 differ h pr For rarity though o disparity, The pred distributi predictor modelled 2017) fo VAN
4. The root mean
rent approaches and independe higher R² values redictive model y, the mean Z other predicto , and dispersio dictor variable on, but the ev rs; see Table d in generalis or R. GAMs do NHOVE, BONVIN, n squared errors to predicting av ent test sets. Low indicate a strong relative to the re for the referenc
ipf score of th ors yielded s on, the respect
es were trans venness opera 3 for a summ sed additive m
o not presupp
LAMBELET, & BER
s (RMSE) and the verage lexical ric wer RMSEs indic
ger decrease in eference model ce model as it is he unique lem imilar results tive lemma-ba sformed as ne ationalisation i mary. Their re models (GAM pose that the
RTHELE PREDICTI
e coefficients of chness ratings in ate greater pred the residual sum (see Note 6). No 0 by definition. mata occurrin in cross-vali ased operation eeded to red n particular w lation to the s) using the predictors are NG LEXICAL RICH determination (R n both cross-valid ictive accuracy; m of squares of th o R² was compu ng in the text w dation.8 For alisations wer uce the skew was collinear w mean ratings mgcv package linearly relat HNESS | 514 R²) of the dation he uted was used, evenness, re chosen. w in their with other was then e (Wood, ted to the
515 | JOURNAL OF WRITING RESEARCH
outcome. Instead, they allow these relationships to be modelled nonlinearly, with the degree of nonlinearity being estimated from the data (for an introduction to GAMs, see Clark, 2016). The predictive power of these models was again assessed using block cross-validation.
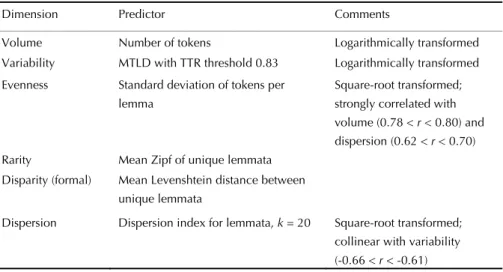
Table 3.Six dimensions of lexical richness and the predictor variables representing them. Four of the six predictors were logarithmically or square-root transformed in order to reduce the positive skew. The choice between these two transformations was made on the basis of the training data only. For more information about these predictors, their intercorrelations and their relationship to the ratings, see the technical report (Vanhove, 2018), Figures 11.21, 12.21 and 13.21.
Dimension Predictor Comments
Volume Number of tokens Logarithmically transformed Variability MTLD with TTR threshold 0.83 Logarithmically transformed Evenness Standard deviation of tokens per
lemma
Square-root transformed; strongly correlated with volume (0.78 < r < 0.80) and dispersion (0.62 < r < 0.70) Rarity Mean Zipf of unique lemmata
Disparity (formal) Mean Levenshtein distance between unique lemmata
Dispersion Dispersion index for lemmata, k = 20 Square-root transformed; collinear with variability (-0.66 < r < -0.61)
Figure 4 shows these models’ predictive usefulness (‘6-dimension approach’). In terms of their RMSE, these models only differ slightly from the black-box models, with the latter at best outperforming them by 0.07 points on the 9-point scale. While some of these differences are significant (see technical report, Chapters 11–14), a difference of 0.07 on a 9-point scale is obviously minute, especially considering that this approach used 105 fewer variables than did the slightly more powerful one.
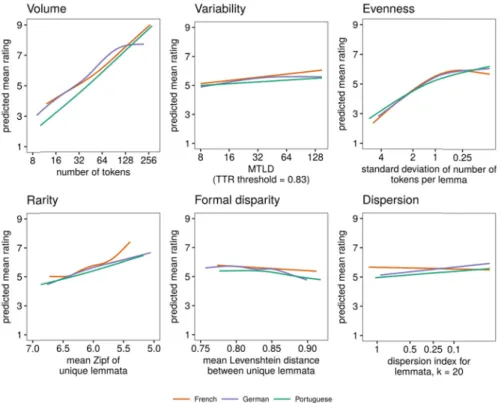
Figure 5 shows the partial effects of the six predictors on the mean rating as estimated using the entire training data set. While there are, of course, some differences between the models for the three languages, the similarities are striking. First, the ’volume’ predictor is the strongest of the six predictors, with longer texts receiving better ratings. Second, the ’variability’ predictor has a consistent effect in the expected direction, but its effect is clearly small. Third, other things equal, texts in which the standard deviation of the number of tokens per lemma are large, i.e., which show a less even spread of tokens over lemmata, are rated as lexically poorer. This is also what Jarvis (2013a) expected, though ideally, this finding should be replicated using a measure of evenness that is less strongly correlated with the other predictors. Fourth, texts with less frequent words are rated as lexically richer in all three languages, which
Figure 5 the tra volume French, G along its their tra again me the ratin exhibitin dispersio runs cou being rat Singl explore predictin model. V Chapter richness VAN 5. Partial effects o
aining sets. The e, variability, etc German, and Por range in the tra ining set mean w
bands fo
eshes with Jar gs much; if a g greater for on does not se unter to Jarvis’ ted as lexically e-predictor ap how much pr ng lexical richn Variable impo 18) identified judgements in NHOVE, BONVIN,
of the six predic x-axes have bee c. The lines in ea rtuguese models ining set. The fiv when plotting. L or the partial effe
(Vanhove, 2018
vis’ expectatio at all, the effe
mal disparity eem to strongl expectations, y poorer in Ge pproach. In the redictive powe ness ratings in ortance measu Guiraud’s ind n the black-bo
LAMBELET, & BER
ctors fitted in gen en arranged such ach panel show s vary when the ve predictors no Language-specifi fects are availab 8; Sections 11.8,
ons. Fifth, form ect runs count
being rated ly affect lexica , with texts in rman and Port e third and las er is lost, rela terms of a sing ures (see Breim dex as the sing ox models (see
RTHELE PREDICTI
neralized additiv h that values to t how the mean predictor in que ot shown in any ic versions of th le in the technic , 12.8 and 13.8) mal disparity d ter to Jarvis’ e as slightly l al richness rat n which lemm tuguese. st modelling a ative to the fir gle, easily com man, 2001; K le most impor technical rep
NG LEXICAL RICH
ve models on the the right indicate ratings predicted estion was allow
given panel wer is figure with co cal report
.
does not seem expectations, w
exically poor tings; if at all ata are more pproach, we w rst two approa mputable and a
uhn & Johnso tant predictor ort, Sections 1 HNESS | 516 e basis of e more d by the wed to vary re fixed at onfidence m to affect with texts rer. Sixth, the effect dispersed wanted to aches, by applicable on, 2013, of lexical 11.7, 12.7
517 | JOURNAL OF WRITING RESEARCH
and 13.7). This predictor is straightforward to compute as √ and so does not require the analyst to interface the texts with an external frequency list, to distinguish the words in the texts by part of speech, etc. Guiraud’s index was not included in the 6-dimension model because of its strong correlation with text length (0.76 < r < 0.85 in the training sets).
As Figure 4 shows (‘Guiraud only’), linear regression models with this single predictor did a respectable job relative to the black-box and 6-dimension models: while the RMSE of the Guiraud-only models was between 0.01 and 0.12 points higher than that of the black-box models, and between −0.01 and 0.06 higher than that of the 6-dimension models, such differences are rather modest considering that the data are on a 9-point scale. In sum, while the more complex models may be preferable for predictive and theoretical reasons, these simple models may be more than serviceable when a rough-and-ready gauge of a text’s perceived lexical richness is desired. Equations (1) to (3) provide the regression equations.9
(1)
predicted mean rating French = 1.44 + 0.81 ×
√(2)
predicted mean rating German = 0.77 + 1.03 ×
√(3)
predicted mean rating Portuguese = 0.11 + 1.04 ×
√3.3
Predictive accuracy and text length
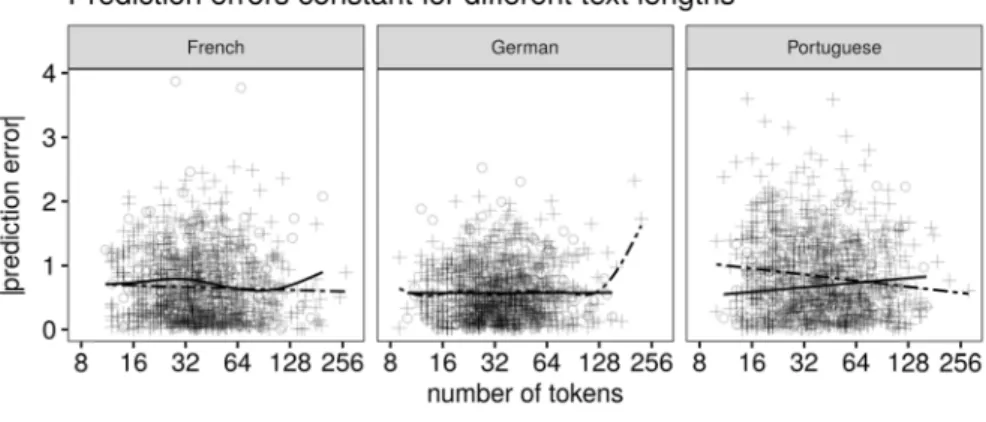
Finally, we assessed whether the usefulness of text-based indices for predicting the ratings is compromised for very short texts. To this end, we plotted the absolute prediction errors, that is, the discrepancies between the actual mean lexical richness ratings and the predicted mean lexical richness ratings, from the black-box approach against the length of the texts; see Figure 6. If predictability were compromised for very short texts, then the average prediction error—highlighted by the scatterplot smoothers—would be consistently larger for short compared to longer texts. Clearly, this is not the case, and we conclude that, within this set of fairly short texts, the predictability of lexical richness ratings is not compromised for the shortest of texts
Figure 6. absolute accordi training s
4. Disc
The over richness (a) that th inter-rate 2017); (b that only by Jarvis, is lost by and (e) t short text4.1
S
The relia random. reliabiliti First, and ICC( ratings. I raters pe VAN . The absolute p e prediction erro ng to text length set, the predictio runcussion
rarching goal of short texts a he lexical rich er reliability, th b) that these ra y little predictiv , 2013a) as op y considering j hat predictabi ts.ystematicity
ability coeffici Nonetheless, ies (α > 0.90) t we had fewe (2,k) values ar n practical ter r text than we NHOVE, BONVIN, rediction error f or is highlighted h. The predictor on errors are bas in which the daof this study as perceived b
ness ratings of hough not to th atings are partl
ve power is lo posed to a ‘kit ust a single, ea lity is not wo
and validity
ients indicate their reliabi that Jarvis (201 r raters per tex re naturally la rms, future stu did, at the cosLAMBELET, & BER
for each text plo by scatterplot s errors are derive ed on out-of-fol atum was not us
was to elucid by untrained ra f untrained rat he extent foun y predictable ost by taking a tchen-sink’ tac asy-to-comput orse for the sho
that the lexic ilities may se 17) reports. We
xt (3-18) than arger the more udies of lexica st of analyzing
RTHELE PREDICTI
otted against the moothers and d ed from the blac
d predictions (i. sed to fit the mo
date the pred aters. To sum u ters exhibited nd in a series o on the basis o theory-driven ck; (d) that only te predictor, v ortest of texts cal richness r eem modest c
e see four reas did Jarvis (20 e individual ra al richness may g fewer texts.
NG LEXICAL RICH
text’s length; the oes not vary con ck-box approach e., on the cross-del). ictability of th up our results, a respectable of related studi of text-based in approach (as y little predicti iz., Guiraud’s within this se
atings are cle compared to
ons for this dif -21), and Cron atings go into y wish to emp HNESS | 518 e average nsistently h. For the -validation he lexical we found degree of ies (Jarvis, ndices; (c) suggested ive power root-TTR; et of fairly early non-the high fference. nbach’s α the mean ploy more
519 | JOURNAL OF WRITING RESEARCH
Second, our reliability estimate (ICC(2,k)) assumes that the raters who rated a given set of texts form but a subset of the raters in whose judgements one is actually interested in (‘treating raters as random’). That is, it estimates how similar the mean ratings assigned by different, equal-sized panels of raters would be. Cronbach’s α, by contrast, assumes that only the present panel of raters is of interest (‘treating raters as fixed’). Since we were interested in how well the present findings generalise to both new texts new raters the assumption underlying the ICC(2,k) seemed better suited to our purpose. For comparison, the mean reliabilities assuming raters as a fixed effect are 0.84, 0.93, and 0.81, for French, German, and Portuguese, respectively.
Third, the instructions we gave to our raters were even less elaborate than Jarvis did to his. Specifically, we asked our raters to rate the vocabulary richness of the texts, but unlike Jarvis, we did not define this, instead preferring to let raters use whichever concept the term evoked for them. Moreover, we did not provide them with a benchmark text representing average lexical richness.
Fourth, Jarvis’ raters were students in his linguistics class, and he was able to incentivise them to rate the texts consistently. In contrast, our rater sample consisted of a more varied mix of raters who logged on to an Internet platform and to whom we did not offer any incentives.
All things considered, our results indicate that Jarvis’ (2017) finding that lexical richness ratings by untrained raters are consistent also applies to shorter texts, thereby confirming Meara’s (2014) intuition that people can make reliable lexical richness judgements on the basis of little material and with little guidance.
That said, our decision not to provide raters with a more elaborate definition of lexical richness than “the richness of the vocabulary used in the text” may conceivably have led at least some of them to judge the quality of the texts in more general terms than specifically their lexical richness. To account for this possibility, future studies may wish to experiment with varying the explicitness of the instructions to the raters or by scrambling the words in the texts such that non-lexical markers of writing quality (e.g., syntactic complexity, structure) cannot affect the raters’ perceptions (cf. Jarvis, 2017).
4.2
Predictability and interpretability
In addition to being systematic, the lexical diversity ratings are predictable: up to a certain degree, it can be forecast how new panels of raters would judge the lexical richness of new texts. This predictability is not compromised for the shortest of texts.
What is more, fairly interpretable models based on Jarvis’ (2013a) theoretical framework which contain only six, non-interacting predictors do not compromise predictability. These models identify ‘volume’ as the most important predictor of lexical richness, which replicates a finding by Jarvis (2013b). ‘Volume’ is followed by ‘evenness’ and ‘rarity’, which both have effects in the direction expected. In contrast to these three predictors, the MTLD measure of ‘variability’, our first attempt at a ‘formal disparity’ measure, and the ‘dispersion’ measure proposed by Jarvis (personal correspondence, August 2, 2017), did not turn out to be important predictors.
VANHOVE, BONVIN, LAMBELET, & BERTHELE PREDICTING LEXICAL RICHNESS | 520
However, some of these measures express the same information to some degree. For instance, short texts tend to have low type–token ratios, which translates into high evenness and high dispersion. The development of operationalisations of these dimensions that are not so inextricably intertwined would facilitate the interpretation of the results of future studies.
A further observation was that simple models containing only a single predictor, Guiraud’s root-TTR, yielded fairly accurate predictions. This index is easy to compute, and the model predictions easy to calculate. For all its predictive prowess, however, the relationship between Guiraud’s root-TTR and the ratings is difficult to interpret as this variable is strongly correlated with log-transformed text length (0.76 < r < 0.85 in the training sets) and fairly strongly with other indices of variability as well (e.g., with the log-transformed MTLD-0.83 measure; 0.38 < r < 0.42). Consequently, Guiraud’s index is best considered an amalgamation of ‘volume’ and ‘variability’ in these texts, making it difficult to determine just how much predictive power it owes to which aspect.
4.3
Improving predictability
While different models could predict lexical richness ratings to a certain degree, the prediction is of course far from perfect. Apart from ensuring that their richness ratings are highly reliable by recruiting twenty or so raters per text, researchers seeking greater predictive accuracy may wish to explore different ways of operationalising the constructs suggested by Jarvis (2013a, 2017). For instance, Jarvis (2017) currently defines ‘specialness’ in terms of how much individual words contribute to a text’s meaning, and it may be worthwhile to try to operationalise this in terms of the words’ predictability given the context. Moreover, while Jarvis (2013b) operationalised ‘disparity’ in semantic terms, we only measured it in formal terms, and this operationalisation is to be understood as a first attempt in want of refinement.
Consequently, we intend this report also as an invitation to other researchers to test the limits of the predictability of lexical richness ratings by extracting different indices from the texts and using them as predictors in predictive models—or indeed by collecting additional ratings. By doubly validating these models (cross-validation and validation on an independent test set), the risk of overfitting typically associated with such data exploration should be largely nullified. We particularly wish to stress this latter point: Research on modelling perceptions of lexical richness/diversity is still in its infancy, and we think it is of the utmost importance that the first studies do not raise unrealistic expectations by reporting impressive-looking findings with little chance of generalising to new texts and new raters.
5. Conclusions
Lexical richness ratings are both systematic and up to a degree predictable, even for short texts. Little predictive accuracy is lost by adopting theoretically rooted predictive models rather than opaque algorithms. We suggested some avenues for further
521 | JOURNAL OF WRITING RESEARCH
improvements to the theoretical and statistical models and stressed the need for validating these models in order to estimate how applicable they are to both different texts and different raters.
Notes
1. Some researchers use the term lexical diversity instead of lexical richness to refer to the quantity, range, and variety of the vocabulary used in a text (e.g., Jarvis, 2013a), whereas others use the term lexical diversity to refer to the variety aspect only and use lexical richness as the superordinate term (e.g., Engber, 1995; Read, 2000). In the rating study discussed in this article, we asked the raters to judge the texts’ lexical richness, so it is this term we use throughout the article.
2. Currently, Jarvis (2017) distinguishes between seven dimensions: volume, abundance, variety, evenness, dispersion, specialness, and disparity. The present study was carried out before this new proposal was published, so we mostly refer to the old one.
3. Jarvis (2017) mentions that more refined indices could account for 89% of the variance in the last—and most reliable—studies, but further details, such as the way in which the indices were computed, how the data were modelled, and how the danger of overfitting was addressed, are not provided.
4. For the argumentative texts, the children wrote a letter to their aunt or godmother in which they needed to convince a family member to go on a holiday to either the seaside or into the mountains (Portuguese) or to go on a holiday by plane or by car (French and German). For the narrative texts, they needed to relate what happened during their last holidays (Portuguese) or on the last school trip (French and German).
5. Several raters quit after having rated only a handful of texts. For a couple of raters who persisted until the end, a handful of ratings were not logged due to technical glitches, hence the selection criterion of 48 out of 50–52 texts.
6. We use the RMSE as it expresses directly how well the model predictions correspond to the observed values. The problem with R² is that there exist different formulae for computing R² (see Kvålseth, 1985). For ordinary regression models, these all yield the same result. However, when the model is used to predict observations that were not used when fitting the model, they do not. One popular method for computing R², namely squaring the correlation between the predicted and observed values, is particularly problematic, since the correlation between the predicted and observed values can be excellent even if the former correspond poorly to the latter (e.g., the values 1, 2, 3 correlate perfectly with the values 2000, 4000, 6000 but correspond poorly to them). The R² values in this article were therefore calculated as the proportional reduction in the residual sum of squares relative to a baseline model without any predictors: = 1 −∑∑ , where is a text’s perceived lexical richness, its predicted perceived lexical richness by the
VANHOVE, BONVIN, LAMBELET, & BERTHELE PREDICTING LEXICAL RICHNESS | 522
predictive model, and its ‘predicted’ perceived lexical richness by a model without any predictors (i.e., an intercept-only model).
7. To respond to a reviewer inquiry, we do not report p-values for four reasons. First, these are not intended for assessing a model’s predictive strength. Second, we do not test null hypotheses in this study. Third, even if we did, many of the models we used do not output p-values. And fourth, even if they did, it would not be clear how we would have to adjust them to take into account the strong exploratory component in our analyses (see Altman & Krzywinski, 2017). Similarly, we do not provide lengthy tables of model coefficients for the black-box models. This is because some of these models (e.g., the tree-based and neighbour-based models) do not have model coefficients as one may know them from regression analyses, whereas the models that do have model coefficients have too many of them to be interpreted. For the generalised additive models we used in the 6-dimension approach further in the main text, we do not report estimated model coefficients because these cannot be meaningfully interpreted either; generalised additive models need to be visualised to be interpreted (cf. Figure 5).
8. The Zipf scale was proposed by van Heuven, Mandera, Keuleers, and Brysbaert (2014) as a frequency scale that captures language users’ perception of the relative frequency of words.
9. The performance of linear models with a type-based Guiraud’s index (which is even easier to compute as it does not require a lemmatisation of the texts) is virtually indistinguishable from those with a lemma-based Guiraud’s index, but the regression equations do differ slightly; see technical report.
Acknowledgements
This study was funded by the Research Centre on Multilingualism (Fribourg). We thank Judith Berger, Katharina Karger, Meik Michalke, Carlos Pestana, Catia da Silva Parente, Fabio Soares, Carina Steiner, and Isabelle Udry for their help at various stages in this project.
References
Altman, N., & Krzywinski, M. (2017). Points of significance: p values and the search for significance. Nature Methods, 14, 3–4. doi:10.1038/nmeth.4120
Breiman, L. (1996). Stacked regressions. Machine Learning, 24, 49–64. doi:10.1007/BF00117832 Breiman, L. (2001). Statistical modeling: The two cultures. Statistical Science, 16(3), 199–231.
doi:10.1214/ss/1009213726
Brysbaert, M., Buchmeier, M., Conrad, M., Jacobs, A. M., Bölte, J., & Böhl, A. (2011). The word frequency effect: A review of recent developments and implications for the choice of frequency estimates in German. Experimental Psychology, 58, 412–424. doi:10.1027/1618-3169/a000123
Clark, M. (2016, June). Generalized additive models. Retrieved from https://m-clark.github.io/docs/ GAM.html
523 | JOURNAL OF WRITING RESEARCH
Covington, M. A., & McFall, J. D. (2010). Cutting the Gordian knot: The moving-average type– token ratio (MATTR). Journal of Quantitative Linguistics, 17(2). doi:10.1080/092961710036 43098
Crossley, S. A., & McNamara, D. S. (2011). Understanding expert ratings of essay quality: Coh-Metrix analyses of first and second language writing. International Journal of Continuing Engineering Education and Life Long Learning, 21(2-3), 170–191. doi:10.1504/ IJCEELL. 2011.040197
Crossley, S. A., Cobb, T., & McNamara, D. S. (2013). Comparing count-based and band-based indices of word frequency: Implications for active vocabulary research and pedagogical applications. System, 41, 965–981. doi:10.1016/j.system.2013.08.002
Crossley, S. A., Salsbury, T., & McNamara, D. S. (2011). Predicting the proficiency level of language learners using lexical indices. Language Testing, 29(2), 243–263. doi:10.1177/ 0265532211419331
Crossley, S. A., Salsbury, T., McNamara, D. S., & Jarvis, S. (2010). Predicting lexical proficiency in language learner texts using computational indices. Language Testing, 28(4), 561–580. doi:10.1177/0265532210378031
Daller, H., van Hout, R., & Treffers-Daller, J. (2003). Lexical richness in the spontaneous speech of bilinguals. Applied Linguistics, 24(2), 197–222. doi:10.1093/applin/24.2.197
Engber, C. A. (1995). The relationship of lexical proficiency to the quality of ESL compositions. Journal of Second Language Writing, 4(2), 139–155. doi:10.1016/1060-3743(95)90004-7 Grobe, C. (1981). Syntactic maturity, mechanics, and vocabulary as predictors of quality ratings.
Research in the Teaching of English, 15(1), 75–85.
Guiraud, P. (1954). Les charactères statistiques du vocabulaire. Essai de méthodologie. Paris: Presses Universitaires de France.
Guo, L., Crossley, S. A., & McNamara, D. S. (2013). Predicting human judgments of essay quality in both integrated and independent second language writing samples: A comparison study. Assessing Writing, 18, 218–238. doi:10.1016/j.asw.2013.05.002
Jarvis, S. (2002). Short texts, best-fitting curves and new measures of lexical diversity. Language Testing, 19(1), 57–84. doi:10.1191/0265532202lt220oa
Jarvis, S. (2013a). Capturing the diversity in lexical diversity. Language Learning, 63(Supplement 1), 87–106. doi:10.1111/j.1467-9922.2012.00739.x
Jarvis, S. (2013b). Defining and measuring lexical diversity. In S. Jarvis & M. Daller (Eds.), Vocabulary knowledge: Human ratings and automated measures (pp. 13–43). Amsterdam: John Benjamins. doi:10.1075/sibil.47
Jarvis, S. (2017). Grounding lexical diversity in human judgments. Language Testing, 34(4), 537– 553. doi:10.1177/0265532217710632
Jarvis, S., Grant, L., Bikowski, D., & Ferris, D. (2003). Exploring multiple profiles of highly rated learner compositions. Journal of Second Language Writing, 12(4), 377–403. doi:10.1016/j.jslw.2003.09.001
Johnson, W. (1944). Studies in language behavior: I. A program of research. Psychological Monographs, 56, 1–15.
Koizumi, R. (2012). Relationships between text length and lexical diversity measures: Can we use short texts of less than 100 tokens? Vocabulary Learning and Instruction, 1(1), 60–69. doi:10.7820/vli.v01.1.koizumi
Kuhn, M. (2017). caret: Classification and regression training. R package, version 6.0-7.6. Retrieved from https://github.com/topepo/caret/
Kuhn, M., & Johnson, K. (2013). Applied predictive modeling. New York: Springer. doi:10.1007/ 978-1-4614-6849-3
Kuiken, F., & Vedder, I. (2014). Rating written performance: What do raters do and why? Language Testing, 31(3), 329–348. doi:10.1177/0265532214526174
Kvålseth, T. O. (1985). Cautionary note about . The American Statistician, 4(1). doi:10.2307/2683704