HAL Id: insu-01256555
https://hal-insu.archives-ouvertes.fr/insu-01256555
Submitted on 9 Mar 2016
HAL is a multi-disciplinary open access
archive for the deposit and dissemination of
sci-entific research documents, whether they are
pub-lished or not. The documents may come from
teaching and research institutions in France or
abroad, or from public or private research centers.
L’archive ouverte pluridisciplinaire HAL, est
destinée au dépôt et à la diffusion de documents
scientifiques de niveau recherche, publiés ou non,
émanant des établissements d’enseignement et de
recherche français ou étrangers, des laboratoires
publics ou privés.
Alps-Mediterranean Euroregion
Jean-François Rysman, Yvon Lemaître, Emmanuel Moreau
To cite this version:
Jean-François Rysman, Yvon Lemaître, Emmanuel Moreau. Spatial and temporal variability of rainfall
in the Alps-Mediterranean Euroregion. Journal of Applied Meteorology and Climatology, American
Meteorological Society, 2016, 55 (3), pp.655-671. �10.1175/JAMC-D-15-0095.1�. �insu-01256555�
Spatial and Temporal Variability of Rainfall in the Alps–Mediterranean Euroregion
JEAN-FRANÇOISRYSMAN ANDYVONLEMAIˆTRE
Université Pierre-et-Marie-Curie University of Paris 06, Paris, Université Versailles St-Quentin, Versailles, and CNRS/INSU, Laboratoire Atmosphères, Milieux, Observations Spatiales, Institut Pierre-Simon Laplace,
Guyancourt, France
EMMANUELMOREAU Novimet, Guyancourt, France
(Manuscript received 31 March 2015, in final form 23 December 2015) ABSTRACT
This study describes the main patterns of rainfall distribution in the Alps–Mediterranean ‘‘Euroregion’’ using a ground radar and characterizes the associated processes using model output. The radar dataset spans 2009–12 with fine spatial (1 km) and temporal (5 min) resolutions. The most significant rain accumulations were observed in 2009 and 2010, and the most intense extreme events occurred in 2010. Conversely, 2012 was a dry year. Model output revealed that the wind shear, the pressure, and the meridional wind at low level were the three main factors explaining the rainfall variability between 2009 and 2012. At the monthly scale, the maximum of rain accumulation was observed in November along the coast. Results also showed that the most intense rain rates were observed during early summer and autumn in the ‘‘Pre-Alps.’’ The monthly variability was characterized by a displacement of extreme rain events from land to sea from late spring to winter. Correlation analyses showed that this displacement was essentially controlled by the convective available potential energy (CAPE). Rainfall showed a diurnal variability from April to August for the land areas of the Alps–Mediterranean Euroregion. The diurnal variability was significant during the spring and summer months, with maximal rain intensity between 1600 and 1800 UTC. The correlation of the rainfall with CAPE showed that this cycle was related to atmospheric instability. A secondary peak in average rain rate was observed during the early morning and was likely triggered by land breezes. The results highlighted that rainfall characteristics are extremely diverse in terms of intensity and distribution in this relatively small region.
1. Introduction
Precipitation is spread unevenly, both spatially and temporally, in the Mediterranean Sea region (Funatsu et al. 2009;Nastos et al. 2013). Its areal distribution is controlled by both small-scale and large-scale processes. At the large scale, the Mediterranean region is affected both by midlatitude cyclones and subtropical highs (Lionello et al. 2006). The midlatitude cyclones favor precipitation during winter, whereas the subtropical high pressure centers (e.g., Azores high) inhibit precip-itation during the summer. Additional large-scale fea-tures such as the North Atlantic Oscillation (NAO) and El Niño–Southern Oscillation (ENSO) impact the
intensity and distribution of the rain (Price et al. 1998;
Mariotti et al. 2002b; Haylock and Goodess 2004;
Karagiannidis et al. 2008;Boccolari and Malmusi 2013). At the regional scale, local forcings such as topography (e.g., the southern part of the Alps) affect the atmo-spheric circulation that impacts the average rainfall distribution (Smith et al. 2003;Walser and Schar 2004;
Panziera and Germann 2010).
During the past few years, heavy-precipitation events have had an impact on the Mediterranean region, result-ing in damagresult-ing floods, notably in Vaison-la-Romaine, France, in September 1992 (Sénési et al. 1996); Izmir, Turkey, in November 1995 (Kömüs¸çü 1998); Algiers, Algeria, in November 2001 (Argence et al. 2008); and Gard, France, in September 2002 (Delrieu et al. 2005;
Ducrocq et al. 2008). These events caused numerous ca-sualties (e.g., 886 caca-sualties for the Algiers event), and the damage cost billions of euros. Consequently, there is a
Corresponding author address: Jean-François Rysman, LATMOS, 11 Boulevard d’Alembert, 78280 Guyancourt, France.
E-mail: rysman@latmos.ipsl.fr DOI: 10.1175/JAMC-D-15-0095.1 Ó 2016 American Meteorological Society
growing interest in understanding and forecasting rain-fall distribution and, in particular, intense events, be-cause they often have devastating consequences on both society and the economy.
This study focuses more specifically on the Alps– Mediterranean ‘‘Euroregion’’ that was recently im-pacted by several devastating floods such as in Dragui-gnan, France (15–16 June 2010; Fresnay 2014); Nice (France)–Genoa (Italy) (1–6 November 2011;Silvestro et al. 2012; Rebora et al. 2013); and Cannes, France (4 October 2015). In more general terms, meteorological weather services reported 110 heavy-rain events in this region during the period of focus of this study from 2009 to 2012 (European Severe Weather Database;Dotzek et al. 2009). Most of these events occurred along the coast and in the Alps during autumn. Twenty-two ca-sualties associated with heavy precipitation were re-ported, and 20 of them were associated with the Draguignan event. The heaviest events occurred during 2010: on 15 June 2010 in Draguignan [220 mm (24 h)21] and Hyères, France [178 mm (12 h)21]; 8 September 2010 in Pegli, Italy [124 mm (2 h)21]; and 4 October 2010 in Pegli [373 mm (24 h)21] and Piampaludo, Italy [291 mm (24 h)21]. All of these examples illustrate the need to better understand and forecast rainfall in this particular region.
The Alps–Mediterranean Euroregion is characterized by two major geographical features: the southern part of the Alps (Maritime Alps) and a small portion of the northwestern Mediterranean Sea. The southern part of the Alps is prone to heavy precipitation because of its proximity to the Mediterranean Sea and its steep to-pography. Moreover, it is characterized by numerous river catchments that respond quickly to heavy rainfall, leading to frequent flash floods. In this region, rain is mainly measured using a rain gauge network that has an average spatial resolution of 5 km3 5 km, but it is highly heterogeneous (isolated valleys are not equipped), is not intercalibrated, and has only an hourly or a daily tem-poral resolution. In addition, the rain gauges collect rain on a surface of a few centimeters square that is not necessarily representative of the volume of water at the surface of a 5 km 3 5 km area. Nevertheless, accurate understanding and forecasting of rain processes over this region require homogeneous measurements of precipitation at finescale. Indeed, using nonhydrostatic numerical models,Walser and Schar (2004)highlighted the very low predictability for some convective rainfall even in catchments as big as 50 000 km2in this region.
Smith et al. (2003)showed that the rainfall field depends on some local-scale characteristics down to 10 km. A fine temporal scale is also needed, since thunderstorms can trigger events with a considerable accumulation of rain
but with a typical life time of 30 min (Orlanski 1975;
Atkinson 1981).
The rain characteristics over the Mediterranean Sea are little known. In this region, the precipitation is mainly estimated using satellite measurements (e.g.,
Mariotti et al. 2002a;Funatsu et al. 2009;Claud et al. 2012;Tapiador et al. 2012;Nastos et al. 2013) and in-strumented buoys (e.g.,Nittis et al. 2007). The former provide a large range of information but with coarse spatial and temporal resolutions, typically 0.58 3 0.58and 6 h. The latter provide in situ rain measurements but with sparse spatial coverage. Yet, it is important to ob-tain accurate and dense rain measurements over this region because precipitation modifies the sea surface temperature, which affects exchanges between the sea and the atmosphere that in turn impact atmospheric processes. It is also worth recalling that the evaporation from the Mediterranean Sea accounts for 40%–60% of the water vapor feeding the heavy convective systems in the southeastern part of France (Duffourg and Ducrocq 2011,2013), indicating its major impact on the climate of the Alps–Mediterranean Euroregion.
In this context, an X-band radar (8–12 GHz) named Hydrix has been in place since 2008 in the central part of the Alps–Mediterranean Euroregion to quantify and understand the hydrological cycle and related processes. This radar offers spatial and temporal resolutions of 1 km2 and 5 min, respectively, and thus provides fine-scale and homogeneous information about the rainfall behavior of this region. Few radar studies of long-term rain observations in mountainous regions are available to date (e.g.,Wüest et al. 2010;Rudolph et al. 2011). This is mainly because of logistical and signal-treatment is-sues. The logistical problems are related to the instal-lation and maintenance of radars in hard-to-access regions. This problem is reduced with X-band radars, which have a small antenna size (1.5 m for Hydrix an-tenna) in comparison with C-band or S-band radars (4–8 and 2–4 GHz, respectively). The signal-treatment issue is mainly related to ground clutter in mountainous re-gions. This difficulty was partially overcome with the development of Doppler and polarimetric capacities, which offer improved detection of ground clutter. The use of the X-band frequency rather than C and S bands also improves the contrast between meteorological tar-gets and ground clutter (Testud et al. 2007). Moreover, in the case of the Hydrix radar, the offset antenna re-duces the level of sidelobes, which also improves radar visibility.
The present work uses this radar to characterize the precipitation that occurs in the Alps–Mediterranean Euroregion. The objective is to describe the main pat-terns of rainfall distribution as well as their associated
processes. Moreover, this study aims to discover whether the variability of these patterns and their associated processes depends on temporal scales and/or on local characteristics. Specifically, this study analyzes the large-scale temporal variability (2009–12) of rainfall as well as its monthly and diurnal variability in several subregions as detailed insection 3. Rainfall accumula-tion and extreme-rainfall events are investigated. Moreover, to understand the rainfall variability and the underlying mechanisms, statistical analyses of correla-tion between rain and meteorological parameters at annual, monthly, and diurnal scales have been con-ducted. Such information is of high relevance to better understanding the processes associated with rainfall in the Mediterranean, leading to improved forecasts. It will also contribute to answering key scientific questions addressed in the international Hydrological Cycle in Mediterranean Experiment (HyMeX) project (Drobinski et al. 2008, 2014) such as the characterization of ex-treme hydrometeorological events in the Mediterranean [Working Group 3 (WG3) scientific question 1 (SQ1)] and the improvement of heavy-rainfall process knowledge and prediction (WG3-SQ2).
The simultaneous finescale analysis of rainfall over several regions with very different characteristics (e.g., mountain or sea) is new. Whereas numerous studies analyze rainfall behavior at a single scale, this study takes advantage of the fine resolution and the long-standing database to highlight properties of rainfall from small to large temporal scales. Moreover, the homoge-neity of the database is ensured by using one single-radar instrument to measure rainfall, as opposed to multiple rainfall collectors. Also, most regional-scale studies identify the processes associated with rainfall by using several case studies, whereas this study aims to identify these processes statistically.
This paper is organized as follows.Section 2presents some technical information about the Hydrix radar and the model output. Insection 3, we present the region studied and the methods.Section 4is dedicated to the results: from the large scale (4-yr variability) to the small temporal scale (diurnal cycle). The discussion and con-clusions are given insection 5.
2. Radar characteristics
The main characteristics of the Hydrix radar are summarized inTable 1. This X-band and polarimetric radar measures reflectivity at five elevations from218 to 48. The ZPHI (named after the reflectivity Z and the differential phase shift FDP) algorithm (Testud et al. 2000) converts radar reflectivity into rainfall intensity. This algorithm corrects the signal from beam attenuation
along each radial and computes the N* parameter of the0 drop size distribution N(d) (seeTestud et al. 2000) to re-trieve the rain rate R using the
R5 a(N*)0 12bZb (1) relationship, where R is the rain rate, and a and b are two constant empirical coefficients. As a result, the ZPHI algorithm takes into account the drop size distribution variability to estimate rainfall rate. The rainfall rate initially estimated in polar coordinates is then projected onto an extended Lambert II Cartesian grid. A hori-zontal interpolation is performed using the Cressman method, with a 1.33-km cutoff length (i.e., the 0.66-km Cressman radius, which has been shown to be optimal for a 1-km2grid) for 1 km3 1 km resolution. Then, the surface rain rate is estimated using a weighted average of the rainfall obtained at multiple altitudes. Weights are a function of the altitude of the measurements; the precipitation type—notably snow, hail, or liquid;1 and the beam masking [see also Le Bouar et al. (2008),
Moreau et al. (2009), and Rysman (2013)]. The bright band is detected in the classification processing chain using both model prediction (as a first guess when available) and polarimetric observations as rhy. When the radar only samples snow, a Z–R relationship is used to convert reflectivity to equivalent liquid precipitation. Evaluations of retrieved rainfall using this radar and the associated ZPHI algorithm were performed using S-band radar observations (Diss et al. 2009) and rain gauge measurements (Moreau et al. 2009;Rysman 2013). They showed that the quality of the rainfall data is generally good, but it is sometimes low in the northern part of the radar domain for distances larger than 100 km
TABLE1. Main characteristics of the Hydrix radar. Here, H and V indicate horizontal and vertical, respectively, and rpm indicates revolutions per minute.
Frequency (GHz) 9.3
Peak power (kW) 35 per channel Antenna (m) 1.5 (offset feed) Antenna gain (dB) $41
Beamwidth (8) 1.5
Sidelobe level (dB) #230 Pulse width (ns) 500–2000 Pulse repetition frequency (Hz) 1000–500 Sensitivity (dBZ) 0 at 70 km
Polarization mode Simultaneous H and V Scan speed (8 s21) 14 (2.3 rpm)
Revisit time (min) 5
1The precipitation type is inferred using a fuzzy-logic classifi-cation that takes advantage of polarization.
from the radar and in the whole of the Po region (except for the coastline). For this reason, in this study we ex-cluded this region and measurements taken farther away than 100 km from the radar.
The rainfall database extends almost continuously from March 2009 until 2012. The spatial resolution is 1 km2, and the temporal resolution is 5 min. The high spatial and temporal resolutions and the range of mea-surements offer worthwhile opportunities to study the rain characteristics in the region (see, e.g.,Rysman et al. 2013;Lema^ıtre et al. 2013).
3. Region studied and methods
The radar is located on the top of a mountain called Mont Vial (1550 m) close to Nice. The area covered by the Hydrix radar range encompasses Provence in France to the Po region in Italy from west to east (seeFig. 1, top panel). The northern domain of the radar encompasses the southern part of the Alps (France’s Ubaye– Orrenaye region), whereas the southern radar domain includes a small part of the northern Mediterranean Sea. The regional topography strongly affects the rainfall distribution and intensity in the Alps–Mediterranean Euroregion, as shown inFrei and Schär (1998). There-fore, the region is divided for the analyses into five dis-tinct subregions on the basis of generalized geophysical properties (Fig. 1, bottom panel). These subregions are a plain (Provence) with a maximal altitude of 500 m; the Maritime Alps (Alps) with a minimal altitude of 1400 m; the ‘‘Pre-Alps’’ with altitudes ranging from 500 to 1400 m, the coast, which includes land and sea to a maximum of 15 km from the coastline; and the Mediterranean Sea.
In this study, we used outputs from the Weather Re-search and Forecasting (WRF) Model (Skamarock et al. 2008) to analyze statistically the factors that affect the precipitation in the Alps–Mediterranean Euroregion. In particular, we used a hindcast simulation that covers the European and Mediterranean region from January 1989 to November 2011. This simulation was achieved within the framework of the Mediterranean domain of the Coordinated Regional Climate Downscaling Experi-ment (MED-CORDEX;Giorgi et al. 2009) and HyMeX (Drobinski et al. 2014;Ducrocq et al. 2014) projects. The spatial resolution was 20 km, and outputs were stored every 3 h. Initial conditions and boundary conditions were obtained using the ERA-Interim reanalysis from the European Centre for Medium-Range Weather Forecasts (Simmons et al. 2007;Dee et al. 2011). In the vertical direction, 28 unevenly spaced levels are used and the atmosphere top is at 50 hPa. Topography data originate from 5-min-resolution U.S. Geological Survey data. Soil type is based on a combination of the 10-min
17-category United Nations Food and Agriculture Or-ganization soil data and the U.S. State Soil Geographic 10-min soil data. The parameterizations used include the WRF single-moment five-class microphysical parame-terization (Hong et al. 2004), the new Kain–Fritsch convective parameterization (Kain 2004), the Dudhia shortwave radiation (Dudhia 1989) and Rapid Radiative Transfer Model longwave radiation (Mlawer et al. 1997), the Yonsei University planetary boundary layer schemeNoh et al. (2003), and the Rapid Update Cycle land surface model (Smirnova et al. 1997,2000). The WRF simulation has been relaxed toward the ERA-Interim large-scale fields with a nudging time of 6 h.
FIG. 1. (top) Hydrix radar maximum range (outer red circle) and accurate rainfall estimation range (inner black circle); the ground elevation (m) is displayed in color. Main cities are indicated in black and regions are indicated in blue. The x axes of the Hovmöller diagrams inFig. 2(below) are along the black dashed line. (bottom) The five subregions studied: Pre-Alps, Provence, coast, Alps, and the Mediterranean Sea.
With this set of parameterizations, water content is ex-changed among water vapor, cloud water, cloud ice, snow, and rain. It allows for mixed-phase processes, supercooled water, and snowmelt in addition to ice sedimentation. CAPE is computed using the thermo-dynamical profiles. Further information about the sim-ulations can be obtained fromStéfanon et al. (2013)and
Berthou et al. (2014).
We correlated rainfall measured by the radar with some relevant parameters of the model to identify the factors that affect the precipitation. Case studies per-formed in neighboring regions (Boudevillain et al. 2009;
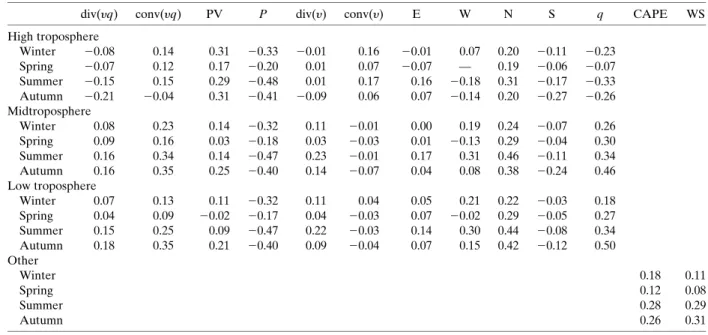
Nuissier et al. 2008;Ricard et al. 2012; Duffourg and Ducrocq 2011) had identified meteorological parame-ters that appeared to be associated with precipitation. These same parameters are the ones considered in this statistical analysis: pressure P, potential vorticity PV, specific humidity q, divergence and convergence of specific humidity flux [div(yq) and conv(yq)], wind di-rection (with north indicated as N, east given as E, south indicated as S, and west denoted by W), wind divergence div(y) and convergence conv(y), convective available potential energy CAPE, and wind shear from 0 to 6 km WS.
To identify nonlinear correlations, we used the Spear-man correlation coefficient. Correlation coefficients higher (lower) than 0.1 (20.1) are statistically significant (permutation test: number of permutations i5 10 000, sample size n5 500, and p value 5 0.01). This statistical analysis provided a huge quantity of significant and complex correlations depending on altitude, location, and season. The full description of these correlations is beyond the scope of this paper [for details seeTable A1 in the
appendix and also Rysman (2013)]. Therefore, in this paper, we focus on significant correlations that might ex-plain the observed interannual, monthly, and diurnal variability of precipitation.
4. Results a. 4-yr variability
The first aspect explored in this paper is the large-temporal-scale variability of the rain intensity and dis-tribution from 2009 to 2012. To this end, we computed Hovmöller diagrams and ensured that their spatial axes were perpendicular to the coastline, that is, in the southeast–northwest direction (seeFig. 1, top panel).
Maximum daily rain accumulations were in general found from October to April, and minima were found during the summer (July–August) with significant in-terannual variability (Fig. 2a). The maxima were mainly located along the coast except for January 2012 when
the maximum of rain accumulation shifted into the Mediterranean Sea region. The maxima occurred during autumn 2010 and in January 2012, with rain accumula-tions higher than 4.5 mm day21. The intensity of the maxima varied strongly from one year to another (e.g., autumn 2009 vs autumn 2010). The summers of 2011 and 2012 were very dry, with nearly no rain in July 2012. The ERA-Interim reanalysis for rainfall in the Alps– Mediterranean showed that 2010 was the third rainiest year in the 1979–2012 period and that the 2009–12 period was slightly (i.e., 9%) rainier than the average of 1979–2012.
A cross correlation for time-lag zero was computed for the atmospheric parameters discussed in the pre-vious section to understand the large-scale variability of rainfall observations. Rainfall and parameters were av-eraged in the radar domain. In the following, we have only presented the results for parameters for which the cross correlations were significant: potential vorticity in the high troposphere PVt, potential vorticity in the midtroposphere PVm, meridional wind in the low tro-posphere vb, specific humidity in the low trotro-posphere qb, high-tropospheric pressure Pt (note that cross cor-relation is quasi independent of altitude for pressure), CAPE, and WS. The results in Fig. 3 should be un-derstood as follows: when a given parameter is signifi-cantly cross correlated with rainfall and rainfall shows either a positive or negative anomaly, it implies that the rainfall anomaly is associated with the parameter.
The meteorological parameters that explained the large-scale pattern of rainfall anomalies were wind shear, high-tropospheric pressure, and meridional wind at low levels. In particular, the positive rainfall anoma-lies of January–March 2010, October–December 2010, March 2011, and November 2011 appeared to be strongly influenced by these three factors. For the November 2011 case, the humidity at low levels also played a role in the positive rainfall anomaly.
It is not surprising that high-tropospheric pressure, wind shear, and meridional wind at low levels play a significant role in rainfall anomalies at the large scale, because these factors are associated with frontal per-turbation. In particular, meridional wind is strong ahead of frontal systems that bring humidity over the Alps– Mediterranean Euroregion. Wind shear is also strong ahead of frontal systems while pressure is low. It is in-teresting to note that, although CAPE is correlated with rainfall during the summer, this parameter does not explain rainfall anomalies for the large temporal scales. The extreme rain events that occurred during the 2009–12 period in the Alps–Mediterranean Euroregion are shown inFig. 2b. The rainfall extremes are defined as the 99.9999th quantile (Q99) of the rain probability dis-tribution function (PDF). To be specific, we computed
the PDF of the 5-min rain rate (;1 3 109rain-rate es-timations per subregion and per month) and extracted the rain-rate value for which 99.9999% of the estimated rain rates were lower. A pronounced seasonal cycle was
observed for the extreme event. The most striking pat-tern was the displacement of the extreme events from land to sea between late spring and winter. The 4-yr variability of extreme events was high: the intensity of
FIG. 3. Normalized (scaled and centered) monthly area-mean radar rainfall anomalies and the cross correlation between monthly rainfall and meteorological parameters (PVt, PVm, vb, qb, Pt, CAPE, and WS, as defined in the text) for time-lag zero as a function of the month. Blue (orange) corresponds to a negative (positive) anomaly for rainfall and a negative (positive) cross correlation for other meteorological parameters.
FIG. 2. Hovmöller diagrams computed along the black dashed line shown inFig. 1(perpendicular to the coast) for (left) daily radar rain accumulation (mm day21) and (right) Q99 of radar rain rate (mm h21). Q99 is defined as the rain rate below which 99.9999% of the estimated rain rates are found. The vertical black line symbolizes the coast.
the late-spring maxima decreased between 2009 (.60 mm h21) and 2011 (;35 mm h21). In 2012 no late-spring maximum was observed. The maximum over the sea during autumn occurred every year but varied in intensity and was higher in 2010 (;50 mm h21) than in other years (;35 mm h21). In general, the position of the maxima was constant year after year, except during spring 2012. Note that the maximum observed in June 2010 was partly related to the Draguignan event. b. Seasonal cycle
Several authors have identified a strong monthly variability of rainfall in the Mediterranean basin (Frei and Schär 1998;Funatsu et al. 2009;Nastos et al. 2013). In this section, we characterize this variability at the regional scale for daily rain accumulation and extreme rain events.
1) DAILY RAIN ACCUMULATION
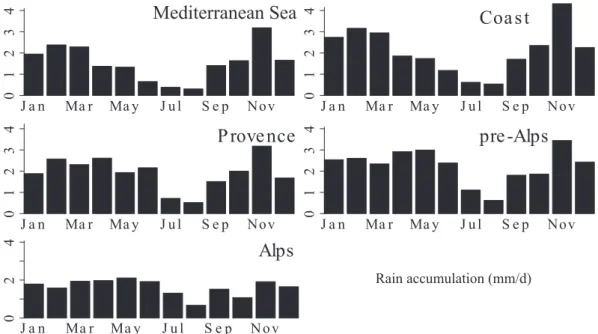
The daily rainfall accumulation per month exhibited very contrasting behavior both spatially and temporally (Fig. 4). Three distinct patterns were thus observed: the first for the sea and the coast, the second for the Pre-Alps and Provence, and the third for the Pre-Alps.
The first pattern was characterized by a maximum rainfall accumulation in November, 4.3 mm day21 for the coast and 3.2 mm day21for the Mediterranean Sea, and a substantial rainfall accumulation from January to March (2–3 mm day21). In detail, the rainfall accumu-lation slowly decreased from winter to summer and reached its minimum in August (,0.3 mm day21for the
Mediterranean Sea and 0.5 mm day21 for the coast). Then the rainfall accumulation increased strongly in September and October (1.8–2.2 mm day21) and reached a maximum in November. Note that rainfall accumulation was nearly 2 times as high in November as in the previous and following months (October and December).
The second pattern was characterized by two quasi-equal maxima of rainfall accumulation in April (Provence)/May (Pre-Alps) and in November (2.6– 3.1 mm day21). In detail, the average rainfall accu-mulation increased slowly from January to April (Provence)/May (Pre-Alps) and then decreased until August (0.5–0.6 mm day21). Then it increased gradually until November.
The third pattern, observed for the Alps region, showed weak monthly variability and low rainfall ac-cumulation (;1.6 mm day21) during the whole year. In detail, the average rainfall accumulation increased slightly from January (1.8 mm day21) to May (2.1 mm day21). During the second part of the year the rainfall accu-mulation oscillated between 0.7 mm day21in August and 1.9 mm day21 in November without any obvious tendency.
Figure 4highlights the small-scale variability of rain-fall accumulation over the region but also the strong regional dependency of rain. For example, in June the rainfall accumulation was lower than 1 mm day21 over the Mediterranean but higher than 2 mm day21 over Provence, located a few kilometers to the north. The results also highlight a rain accumulation that was sig-nificantly higher in November than in the other months.
The reason is first that during autumn there are a lot of atmospheric perturbations that travel across this region, contrary to the summer season when anticyclonic con-ditions are present (Lionello et al. 2006). These atmo-spheric perturbations are thus propitious for heavy rainfall (Funatsu et al. 2008). Moreover, during summer, the Mediterranean Sea warms up and gains a lot of en-ergy that is released during autumn when the tempera-ture of the Mediterranean Sea is higher than the land (Mariotti et al. 2002a;Ducrocq et al. 2014). As a result, rain accumulation is higher in November than in other autumn months, probably because conditions are opti-mal during this month: the Mediterranean Sea is still warm and there are many atmospheric fronts that travel over the region. Our results are consistent in terms of location and rain amount with those obtained from rain gauge measurements reported byFrei and Schär (1998).
2) EXTREME RAIN EVENTS
Regarding the extreme rain events (Fig. 5), three distinct types of behavior were also observed. First, the coast and the Mediterranean Sea showed a moderate seasonal cycle: the extreme rain rate was nearly constant between December and August, ranging from 19 to 23 mm h21. From September to November the rain rate was much more significant (35–40 mm h21).
For the Pre-Alps and Provence the highest rain rates were observed in June (38 mm h21for the Pre-Alps and 39 mm h21for Provence). Conversely, the rain rate was low between December and March (16–25 mm h21). It increased from April (28–29 mm h21) to June and then
decreased slightly from July to November (35–36 mm h21). The pattern for the Alps region was similar to the pre-vious pattern except that the peak in June was less sig-nificant (29 mm h21) and the rain rate decreased strongly from June to December (only 11 mm h21).
Note that the distribution of extreme events differs fromFig. 4, meaning that the extreme events are not the only contributors to rain accumulation. This is particu-larly true in November when rain accumulation is very high (especially for the coast) while the rain rate associ-ated with heavy-precipitation events is moderate. It means that during this period some long-lasting events with moderate rain rates occurred. These types of events can also be associated with considerable flooding since they feed the rivers continuously for long periods (see, e.g., the recent events in the Gard region during autumn 2014).
As already highlighted inFig. 2b, these results show that the rain maxima tend to move from land to sea during the year: during spring and the beginning of summer, the most extreme precipitation was observed inland (Provence, Pre-Alps, and Alps), whereas during the autumn months the most extreme precipitation was mainly located over the coast and the sea. It is not sur-prising to find the most extreme events in the Pre-Alps region since this region is characterized by steep to-pography and is close to the sea. These two factors are known to be favorable for the development of intense convective cells and substantial rain rates in the western Mediterranean region (Ducrocq et al. 2014).
As for the 4-yr variability, numerous correlation an-alyses were performed to identify the parameters (and
underlying processes) that drive the monthly pattern of rainfall in the Alps–Mediterranean Euroregion. Among the various parameters considered (not shown), CAPE appeared to explain most of the rain displacement.
Figure 6 shows that the correlation between rain-fall (from radar measurements interpolated on the WRF 20-km grid) and CAPE during spring was fair (0.2–0.5) over land and weak or zero over sea. During the summer, the correlation was moderate (0.2–0.3) over alpine regions and was zero everywhere else. During the autumn and winter seasons, the correlation was strong over the sea (0.2–0.4) and weak over land except over Provence where correlation was strong (0.4) during autumn.
This correlation pattern explains the displacement of rainfall maxima from land to sea between spring and autumn. During autumn and winter, CAPE is low or zero over land while being significant over the sea. CAPE provides energy to convective motions that trigger rainy events over the sea. During the spring and summer, the situation is more complex, since CAPE is substantial over both land and sea (not shown) but the correlation is high only over land. This behavior is probably related to the absence of regional-scale lifting mechanisms needed to release CAPE over the sea. In-deed, during summer, anticyclonic conditions dominate in the Mediterranean region (Lionello et al. 2006),
restricting vertical motions. Therefore, no large-scale processes lift air masses to the level of free convection, preventing convective motions over the sea. Over land, alternative lifting processes are available such as oro-graphic and thermal lifting.
The land–sea displacement was noticed in the past, at a more global scale, byFrei and Schär (1998)and by
Funatsu et al. (2009)and has occurred in the whole of the northern part of the Mediterranean region [see Fig. 2 inNastos et al. (2013)]. Yet, this is the first time, to our knowledge, that it has been shown to be tightly related to convective precipitation.
c. Diurnal variability
The objective of this last section is to characterize the diurnal cycle of precipitation and to identify associated processes. The diurnal cycle is the strongest over land during spring, with a maximum in the average rain rate in the afternoon (Fig. 7). In addition, a secondary peak is observed in the early morning in the coastal and Medi-terranean regions in August, September, and Novem-ber. In greater detail, in January and February the diurnal signal was weak or absent for all regions. During this period, rainfall was maximal for the coast and the Mediterranean Sea (;0.15 mm h21). In March a slight peak in the afternoon was observed for the coast,
FIG. 6. Spearman correlation between 3-h rainfall from radar measurements interpolated on the WRF 20-km grid and CAPE per season. Red or blue indicates a positive or negative cor-relation, respectively.
Provence, and the Pre-Alps. This peak was much more significant in April, especially in the Pre-Alps and Pro-vence regions (peak of 0.32 mm h21 at 1600 UTC). In May and June a diurnal signal was observed in all land
regions and was maximal in the Pre-Alps (;0.30 mm h21; 1500 UTC). From July, the diurnal signal became weaker (e.g., afternoon peak of 0.16 mm h21 in the Alps and 0.13 mm h21 in the Pre-Alps). In August, the diurnal
signal was very weak and the average rain rate was the lowest of the year (,0.13 mm h21everywhere). In Sep-tember and October there was no clear diurnal signal, except for the Pre-Alps and coast regions, and the av-erage rain rate was 0.09 mm h21 (September) and 0.12 mm h21(October). In November the average rain rate was the highest of the year (up to 0.23 mm h21for the coast). A slight increase in rain rate could be seen during the afternoon for Provence, the coast, and the Mediterranean Sea. In December the overall rain rate was low and a slight diurnal signal existed for the coast, the Pre-Alps, and the Mediterranean Sea.
Using spatial correlation analysis, we identified the two main parameters from those previously indicated
that are associated with the diurnal cycle: CAPE and wind shear (Fig. 8). Correlation is displayed for spring for CAPE and for summer for wind shear, because the associated diurnal signal was maximal during these seasons. For CAPE, the correlation was significant (higher than 0.2) from 0900 to 2100 UTC, with a maxi-mum correlation between 1200 and 1500 UTC (up to 0.8). Spatially, the maxima of correlation were observed over land and in particular over the Pre-Alps. From 0000 to 0600 UTC a very slight correlation existed without a clear spatial pattern. Thus, CAPE explained the after-noon peak in the diurnal cycle of land regions.
For wind shear (Fig. 8, bottom panel), the correlation was significant from 0000 to 0600 UTC (approximately
FIG. 8. Correlation between 3-h rainfall from the radar measurements interpolated on the WRF 20-km grid and (top) CAPE during spring and (bottom) wind shear during summer. Positive (negative) correlations are in red (blue).
0.2). The maximum correlation was observed for the coastal region up to 30 km inland while no correlation was observed over the sea. Thus, the wind shear might explain the secondary peak observed in the early morning in coastal and Mediterranean regions in Au-gust, September, and November inFig. 7. Similar peaks in the early morning have already been noticed for various regions in the world: in California (Landin and Bosart 1989), in Japan (Oki and Musiake 1994), and in Scotland (Svensson and Jakob 2002). Some of the pre-viously mentioned authors argued that this behavior might be related to both the cooling of air over land during the night and a land-breeze convergence along the coast. The correlation analysis (Fig. 8) tends to support this explanation as the land breeze triggers air circulation from land to sea close to the ground and from sea to land in the mid- to high troposphere (i.e., a ver-tical wind shear).
Overall, the observed diurnal cycle and the correla-tion analyses highlight two main mechanisms that drive the precipitation during the year. During spring and
summer, the average rainfall rate shows a strong peak in the afternoon but is low during the night and early morning, and precipitation is driven by CAPE (Fig. 8, top panel). Therefore, during these seasons, rainfall appears to be mainly driven by short and convective rainfall. Conversely, during autumn and winter, the rainfall is spread throughout the day without a strong maximum, and no local correlation was highlighted. Therefore, the rainfall appears to be mainly driven by large-scale frontal perturbations that trigger weak and long-lasting stratiform precipitation.
Looking in more detail at the regional behavior of diurnal cycles, inFig. 7we also see that, in April, the diurnal signal is strong in the Pre-Alps and Provence regions but weak in the Alps. Moreover, from May to July, the diurnal signal in Provence becomes gradually weaker while the diurnal signal in the Alps gains in strength. This behavior could be partially related to the low-level stability of these regions. This stability can be highlighted using the potential vorticity (Fig. 9). A negative (positive) potential vorticity at ground level
FIG. 9. Median of potential vorticity (PVU; 1 PVU5 1026K m2kg21s21) at 1000 hPa for April, May, and June. Blue (red) shows a negative (positive) potential vorticity, i.e., an unstable (a stable) lower atmosphere.
highlights an unstable (stable) atmosphere. Thus, in April, the potential vorticity at ground level is negative over Provence and the Pre-Alps but is positive over the Alps. Later, in May and June, the potential vorticity over the Alps becomes progressively negative. There-fore, convective activity is more likely earlier in the season for regions with low altitudes (Provence) and is more likely later in the season for regions with high al-titudes (the Alps). The decrease of the diurnal signal in Provence from spring to summer could be related to anticyclonic conditions found during the summer months (Lionello et al. 2006). These conditions tend to inhibit convection and could explain why the diurnal signal is weaker during this season in Provence. Other land re-gions present higher diurnal signals during this season, probably because they have a steeper orography, which is more favorable to convective activity since it provides the necessary lifting to release the convective instability.
The diurnal cycle highlighted here can be compared with results ofMandapaka et al. (2012)(Switzerland) andGladich et al. (2011)(Italy). The region studied by
Mandapaka et al. (2012)corresponds to the central Alps and can be mainly compared with the Alps region of our study. Similar to our results,Mandapaka et al. (2012)
revealed a significant peak in rain accumulation of ap-proximately 0.2 mm h21during the summer from 1000 to 0000 UTC. During other seasons, the diurnal cycle is flat and the average value is;0.05 mm h21, again similar to our results. They also showed that the diurnal cycle in the central Alps is mainly related to the local orographic forcing.Gladich et al. (2011)studied a region in south-eastern Italy that is very similar to the Alps–Mediterranean Euroregion. They highlighted an increase in rainfall accu-mulation from 0900 UTC to 0000 UTC in annual average in this region (peak value of 0.25 mm h21) that is similar to our results. In addition, they highlighted two distinct peaks during the day (1300 and 2100 UTC) that we did not observe.
5. Discussion and conclusions
This study analyzed the variability of rainfall distri-bution and intensity in the Alps–Mediterranean Euro-region using a 4-yr rainfall time series. Rainfall was measured by an X-band polarimetric and Doppler radar named Hydrix that is located close to the city of Nice in France. This radar provides a unique dataset with fine spatial (1 km) and temporal (5 min) resolutions and en-compasses five subregions with very different geo-physical characteristics: Provence, the Maritime Alps, the Pre-Alps, the coast, and the Mediterranean Sea.
Rainfall variability was described from large (4-yr variability) to small (diurnal variability) temporal scales.
Maxima of rain daily accumulation were observed dur-ing autumn 2010 and in January 2012 along the coast and over the sea. The most intense extreme events were observed during summer 2009 in the northern part of the study region (i.e., the Alps). The interannual variability was moderate for daily rain accumulation and high for extreme-rain events. Correlation analyses showed that rainfall positive anomalies during the 4-yr period were triggered by favorable conditions of wind shear, pres-sure, and meridional wind.
The monthly variability of rainfall was highly de-pendent on regional characteristics. In particular, three different behaviors were identified: the first for the sea and the coast, the second for the Pre-Alps and Provence, and the third for the Alps. The highest rain accu-mulation was observed for the coast in November (4.3 mm day21), and the lowest rain accumulation was observed for the Mediterranean Sea in August (,0.3 mm day21). The most intense extreme events were observed in June in the Pre-Alps and Provence regions. This analysis highlights a displacement of extreme-rainfall events from land to sea during the year, and correlation analyses show that this displacement is associated with the convective activity that moves from land during spring and summer to the sea during autumn [see, e.g., autumn 2012 inRysman et al. (2016)].
The diurnal cycle is significant from April to August in land regions. In particular, the highest rain accumula-tions occur between 1000 and 2000 UTC and are related to convective processes, as shown by the high correla-tion between rainfall and CAPE. A secondary peak in the diurnal cycle is also detected in the early morning for regions close to the sea during autumn and winter. This is probably the signature of a land-breeze convergence along the coast.
Overall, this analysis provides an overview of rainfall characteristics in a complex region from fine to large temporal scales. One of the main findings is that rainfall variability is surprisingly high in this relatively small region. This variability is highly dependent on surface conditions (e.g., see the different behavior between the coast and Provence or the Pre-Alps) as well as the tem-poral scales considered. Representing this high variability in models is challenging, and resolution on the scale of a kilometer appears to be a minimum in this region.
While several case studies have identified the main parameters associated with the rainfall in neighboring regions, this study identified statistically the parameters that explain most of this rainfall variability from large to small scales. First, results show that the parameters governing rainfall variability depend on the scale con-sidered. At the climatological scale, rainfall appears to be mainly driven by parameters that are the signatures
of frontal systems (north wind; low pressure). At the meteorological scale, CAPE and wind shear appear to be key parameters statistically. This is not surprising because theoretical studies have shown that both pa-rameters are known to strongly influence convective systems (Rotunno and Klemp 1982;Rotunno et al. 1988;
Weisman and Rotunno 2000). Because these parameters are highly dependent on finescale conditions, however, their accurate representation is difficult. This is probably why numerical weather models have not been as good as extrapolation forecasts in predicting precipitation pterns up to 3–4 h, although the former represent the at-mospheric physics better (Lin et al. 2005;Vasic´ et al. 2007;Panziera et al. 2011).
This study identifies several parameters associated with rainfall, but there is a need for a better under-standing of the reason for such a close relationship be-tween rainfall and these parameters, that is, to identify the mechanisms leading to rainfall. It is also important to understand the behavior of these parameters better— for example, what governs the displacement of CAPE during the year and why the atmosphere is unstable in Provence from April and later in the Alps.
The results of this study can be used to evaluate the representation of the observed variability by regional models. In particular, similar statistics, such as the analysis of rainfall at several scales and the study of each component of rainfall (accumulation, extreme, etc.), could be con-ducted using rainfall simulated by the WRF Model or other models in the same region. Also, this radar system will continue to provide rainfall measurements that will allow us to study climatic tendencies in the Alps–Mediterranean
Euroregion. In particular, within the framework of cli-mate change, it is extremely important to be able to detect an aridification of the region and/or an increase in the occurrence and frequency of extreme rainfall (Ban et al. 2015) so as to adapt our society’s habits.
Acknowledgments. We acknowledge Georges Scialom and Céline Bellard for their perspicacious comments and for the careful proofreading of this paper. We also acknowledge Sophie Bastin and Marc Stéfanon for providing us with simulation outputs and diagnostics and Chantal Claud for her support that allowed us to achieve this work. The authors thank the three anonymous reviewers whose valuable feedback improved the paper. This study was sponsored by the École Doctorale 129— Sciences de l’environnement, the Direction Générale de l’Armement (PRECIP-CLOUD project), and by the ANR-REMEMBER. This work is a contribution to the HyMeX program through INSU/MISTRALS support and the Med-CORDEX program, with access granted to the HPC re-sources of IDRIS (under Allocation i2011010227). The NCAR Command Language (version 6.2.1;Brown et al. 2012) was used for CAPE computation, and R software (http://www.R-project.org/) was used for other analyses.
APPENDIX
Details of the Rainfall Correlations
Table A1provides a summary of the correlation co-efficients between rainfall and meteorological parame-ters as a function of altitude and season in the study area.
TABLEA1. Correlation coefficients between rainfall and meteorological parameters as a function of altitude and season. div(yq) conv(yq) PV P div(y) conv(y) E W N S q CAPE WS High troposphere Winter 20.08 0.14 0.31 20.33 20.01 0.16 20.01 0.07 0.20 20.11 20.23 Spring 20.07 0.12 0.17 20.20 0.01 0.07 20.07 — 0.19 20.06 20.07 Summer 20.15 0.15 0.29 20.48 0.01 0.17 0.16 20.18 0.31 20.17 20.33 Autumn 20.21 20.04 0.31 20.41 20.09 0.06 0.07 20.14 0.20 20.27 20.26 Midtroposphere Winter 0.08 0.23 0.14 20.32 0.11 20.01 0.00 0.19 0.24 20.07 0.26 Spring 0.09 0.16 0.03 20.18 0.03 20.03 0.01 20.13 0.29 20.04 0.30 Summer 0.16 0.34 0.14 20.47 0.23 20.01 0.17 0.31 0.46 20.11 0.34 Autumn 0.16 0.35 0.25 20.40 0.14 20.07 0.04 0.08 0.38 20.24 0.46 Low troposphere Winter 0.07 0.13 0.11 20.32 0.11 0.04 0.05 0.21 0.22 20.03 0.18 Spring 0.04 0.09 20.02 20.17 0.04 20.03 0.07 20.02 0.29 20.05 0.27 Summer 0.15 0.25 0.09 20.47 0.22 20.03 0.14 0.30 0.44 20.08 0.34 Autumn 0.18 0.35 0.21 20.40 0.09 20.04 0.07 0.15 0.42 20.12 0.50 Other Winter 0.18 0.11 Spring 0.12 0.08 Summer 0.28 0.29 Autumn 0.26 0.31
REFERENCES
Argence, S., D. Lambert, E. Richard, J.-P. Chaboureau, and N. Söhne, 2008: Impact of initial condition uncertainties on the pre-dictability of heavy rainfall in the Mediterranean: A case study. Quart. J. Roy. Meteor. Soc., 134, 1775–1788, doi:10.1002/qj.314. Atkinson, B., 1981: Meso-Scale Atmospheric Circulations.
Aca-demic Press, 495 pp.
Ban, N., J. Schmidli, and C. Schär, 2015: Heavy precipitation in a changing climate: Does short-term summer precipitation in-crease faster? Geophys. Res. Lett., 42, 1165–1172, doi:10.1002/ 2014GL062588.
Berthou, S., S. Mailler, P. Drobinski, T. Arsouze, S. Bastin, K. Béranger, and C. Lebeaupin-Brossier, 2014: Prior history of mistral and tramontane winds modulates heavy precipitation events in southern France. Tellus, 66A, 24064, doi:10.3402/ tellusa.v66.24064.
Boccolari, M., and S. Malmusi, 2013: Changes in temperature and precipitation extremes observed in Modena, Italy. Atmos. Res., 122, 16–31, doi:10.1016/j.atmosres.2012.10.022. Boudevillain, B., and Coauthors, 2009: Projet CYPRIM, partie I:
Cy-clogenses et précipitations intenses en région méditerranéenne: Origines et caractéristiques (CYPRIM project, part I: Cyclogenesis and intense precipitation in the Mediterranean region: Origins and characteristics). Meteorologie, 66, 18–28, doi:10.4267/2042/28828.
Brown, D., R. Brownrigg, M. Haley, and W. Huang, 2012: The NCAR Command Language (NCL) (version 6.0.0). UCAR/ NCAR Computational and Information Systems Laboratory, doi:10.5065/D6WD3XH5.
Claud, C., B. Alhammoud, B. M. Funatsu, C. Lebeaupin Brossier, J.-P. Chaboureau, K. Béranger, and P. Drobinski, 2012: A high resolution climatology of precipitation and deep convection over the Mediterranean region from operational satellite mi-crowave data: Development and application to the evaluation of model uncertainties. Nat. Hazards Earth Syst. Sci., 12, 785– 798, doi:10.5194/nhess-12-785-2012.
Dee, D. P., and Coauthors, 2011: The ERA-Interim reanalysis: Configuration and performance of the data assimilation system. Quart. J. Roy. Meteor. Soc., 137, 553–597, doi:10.1002/qj.828. Delrieu, G., and Coauthors, 2005: The catastrophic flash-flood
event of 8–9 September 2002 in the Gard region, France: A first case study for the Cévennes Vivarais Mediterranean Hydrometeorological Observatory. J. Hydrometeor., 6, 34, doi:10.1175/JHM-400.1.
Diss, S., J. Testud, J. Lavabre, P. Ribstein, E. Moreau, and J. Parent du Chatelet, 2009: Ability of a dual polarized X-band radar to estimate rainfall. Adv. Water Resour., 32, 975–985, doi:10.1016/ j.advwatres.2009.01.004.
Dotzek, N., P. Groenemeijer, B. Feuerstein, and A. M. Holzer, 2009: Overview of ESSL’s severe convective storms research using the European Severe Weather Database ESWD. Atmos. Res., 93, 575–586, doi:10.1016/j.atmosres.2008.10.020. Drobinski, P., and Coauthors, 2008: HyMeX—Towards a major
field experiment in 2010–2020: White book. Météo-France– Centre National de Recherches Météorologiques Tech. Rep., 124 pp. [Available online at http://www.hymex.org/public/ documents/WB_1.3.2.pdf.]
——, and Coauthors, 2014: HyMeX: A 10-year multidisciplinary program on the Mediterranean water cycle. Bull. Amer. Me-teor. Soc., 95, 1063–1082, doi:10.1175/BAMS-D-12-00242.1. Ducrocq, V., O. Nuissier, D. Ricard, C. Lebeaupin, and T. Thouvenin,
2008: A numerical study of three catastrophic precipitating
events over southern France. II: Mesoscale triggering and stationarity factors. Quart. J. Roy. Meteor. Soc., 134, 131–145, doi:10.1002/qj.199.
——, and Coauthors, 2014: HyMeX-SOP1: The field campaign dedicated to heavy precipitation and flash flooding in the northwestern Mediterranean. Bull. Amer. Meteor. Soc., 95, 1083–1100, doi:10.1175/BAMS-D-12-00244.1.
Dudhia, J., 1989: Numerical study of convection observed during the Winter Monsoon Experiment using a mesoscale two-dimensional model. J. Atmos. Sci., 46, 3077–3107, doi:10.1175/ 1520-0469(1989)046,3077:NSOCOD.2.0.CO;2.
Duffourg, F., and V. Ducrocq, 2011: Origin of the moisture feeding the heavy precipitating systems over southeastern France. Nat. Hazards Earth Syst. Sci., 11, 1163–1178, doi:10.5194/ nhess-11-1163-2011.
——, and ——, 2013: Assessment of the water supply to Mediter-ranean heavy precipitation: A method based on finely designed water budgets. Atmos. Sci. Lett., 14, 133–138, doi:10.1002/asl2.429. Frei, C., and C. Schär, 1998: A precipitation climatology of the Alps from high-resolution rain-gauge observations. Int. J. Climatol., 18, 873–900, doi:10.1002/(SICI)1097-0088(19980630)18:8,873:: AID-JOC255.3.0.CO;2-9.
Fresnay, S., 2014: Prévisibilité des épisodes météorologiques à fort impact: Sensibilité aux anomalies d’altitude (Predictability of high-impact weather events: Sensitivity to altitude anomalies). Ph.D. thesis, Université Paul Sabatier-Toulouse III, 200 pp. [Available online athttps://tel.archives-ouvertes.fr/tel-00986467/ file/these_fresnay.pdf.]
Funatsu, B. M., C. Claud, and J.-P. Chaboureau, 2008: A 6-year AMSU-based climatology of upper-level troughs and associ-ated precipitation distribution in the Mediterranean region. J. Geophys. Res., 113, D15120, doi:10.1029/2008JD009918. ——, ——, and ——, 2009: Comparison between the large-scale
environments of moderate and intense precipitating systems in the Mediterranean region. Mon. Wea. Rev., 137, 3933–3959, doi:10.1175/2009MWR2922.1.
Giorgi, F., C. Jones, G. R. Asrar, 2009: Addressing climate in-formation needs at the regional level: The CORDEX frame-work. WMO Bull., 58, 175–183. [Available online athttp:// www.wmo.int/pages/publications/bulletinarchive/archive/58_3_en/ documents/58_3_giorgi_en.pdf.]
Gladich, I., I. Gallai, D. B. Giaiotti, and F. Stel, 2011: On the di-urnal cycle of deep moist convection in the southern side of the Alps analysed through cloud-to-ground lightning activity. Atmos. Res., 100, 371–376, doi:10.1016/j.atmosres.2010.08.026. Haylock, M. R., and C. M. Goodess, 2004: Interannual variability of European extreme winter rainfall and links with mean large-scale circulation. Int. J. Climatol., 24, 759–776, doi:10.1002/ joc.1033.
Hong, S.-Y., J. Dudhia, and S.-H. Chen, 2004: A revised approach to ice microphysical processes for the bulk parameterization of clouds and precipitation. Mon. Wea. Rev., 132, 103–120, doi:10.1175/1520-0493(2004)132,0103:ARATIM.2.0.CO;2. Kain, J. S., 2004: The Kain–Fritsch convective parameterization:
An update. J. Appl. Meteor., 43, 170–181, doi:10.1175/ 1520-0450(2004)043,0170:TKCPAU.2.0.CO;2.
Karagiannidis, A. F., A. A. Bloutsos, P. Maheras, and C. Sachsamanoglou, 2008: Some statistical characteristics of precipitation in Europe. Theor. Appl. Climatol., 91, 193–204, doi:10.1007/s00704-007-0303-7.
Kömüs¸çü, A. M., 1998: Analysis of meteorological and terrain features leading to the Izmir flash flood, 3–4 November 1995. Nat. Hazards, 18, 1–25, doi:10.1023/A:1008078920113.
Landin, M. G., and L. F. Bosart, 1989: The diurnal variation of pre-cipitation in California and Nevada. Mon. Wea. Rev., 117, 1801– 1816, doi:10.1175/1520-0493(1989)117,1801:TDVOPI.2.0.CO;2. Le Bouar, E., E. Moreau, and J. Testud, 2008: The rain accumu-lation product from the X-band polarimetric radar Hydrix. Int. Symp. on Weather Radar and Hydrology, Grenoble/Autrans, France, LTHE–OHMCV.
Lema^ıtre, Y., J.-F. Rysman, S. Verrier, and E. Moreau, 2013: Le radar en bande X: Un outil au service de l’étude des événements precipitants (X-band radar: A tool for studying precipitation events). Meteorologie, 83, 50–58. [Available online athttp://documents.irevues.inist.fr/handle/2042/52054.] Lin, C., S. Vasic´, A. Kilambi, B. Turner, and I. Zawadzki, 2005: Precipitation forecast skill of numerical weather prediction models and radar nowcasts. Geophys. Res. Lett., 32, L14801, doi:10.1029/2005GL023451.
Lionello, P., P. Malanotte-Rizzoli, and R. Boscolo, 2006: Medi-terranean Climate Variability. Developments in Earth and Environmental Sciences, Vol. 4, Elsevier, 438 pp.
Mandapaka, P. V., U. Germann, and L. Panziera, 2012: Diurnal cycle of precipitation over complex Alpine orography: Infer-ences from high-resolution radar observations. Quart. J. Roy. Meteor. Soc., 139, 1025–1046, doi:10.1002/qj.2013.
Mariotti, A., M. Vittoria Struglia, N. Zeng, and K.-M. Lau, 2002a: The hydrological cycle in the Mediterranean region and im-plications for the water budget of the Mediterranean Sea. J. Climate, 15, 1674–1690, doi:10.1175/1520-0442(2002)015,1674: THCITM.2.0.CO;2.
——, N. Zeng, and K.-M. Lau, 2002b: Euro-Mediterranean rainfall and ENSO—A seasonally varying relationship. Geophys. Res. Lett., 29, 1621, doi:10.1029/2001GL014248.
Mlawer, E. J., S. J. Taubman, P. D. Brown, M. J. Iacono, and S. A. Clough, 1997: Radiative transfer for inhomogeneous atmo-spheres: RRTM, a validated correlated-k model for the longwave. J. Geophys. Res., 102, 16 663–16 682, doi:10.1029/ 97JD00237.
Moreau, E., J. Testud, and E. Le Bouar, 2009: Rainfall spatial variability observed by X-band weather radar and its impli-cation for the accuracy of rainfall estimates. Adv. Water Re-sour., 32, 1011–1019, doi:10.1016/j.advwatres.2008.11.007. Nastos, P., J. Kapsomenakis, and K. Douvis, 2013: Analysis of
precipitation extremes based on satellite and high-resolution gridded data set over Mediterranean basin. Atmos. Res., 131, 46–59, doi:10.1016/j.atmosres.2013.04.009.
Nittis, K., C. Tziavos, R. Bozzano, V. Cardin, Y. Thanos, G. Petihakis, M. E. Schiano, and F. Zanon, 2007: The M3A multi-sensor buoy network of the Mediterranean Sea. Ocean Sci., 3, 229–243, doi:10.5194/os-3-229-2007.
Noh, Y., W. Cheon, S. Hong, and S. Raasch, 2003: Improvement of the k-profile model for the planetary boundary layer based on large eddy simulation data. Bound.-Layer Meteor., 107, 401– 427, doi:10.1023/A:1022146015946.
Nuissier, O., V. Ducrocq, D. Ricard, C. Lebeaupin, and S. Anquetin, 2008: A numerical study of three catastrophic precipitating events over southern France. I: Numerical framework and synoptic ingredients. Quart. J. Roy. Meteor. Soc., 134, 111–130, doi:10.1002/qj.200.
Oki, T., and K. Musiake, 1994: Seasonal change of the diurnal cycle of precipitation over Japan and Malaysia. J. Appl. Meteor., 33, 1445–1463, doi:10.1175/1520-0450(1994)033,1445: SCOTDC.2.0.CO;2.
Orlanski, I., 1975: A rational subdivision of scales for atmospheric processes. Bull. Amer. Meteor. Soc., 56, 527–530.
Panziera, L., and U. Germann, 2010: The relation between airflow and orographic precipitation on the southern side of the Alps as revealed by weather radar. Quart. J. Roy. Meteor. Soc., 136, 222–238, doi:10.1002/qj.544.
——, ——, M. Gabella, and P. V. Mandapaka, 2011: NORA— Nowcasting of Orographic Rainfall by means of Analogues. Quart. J. Roy. Meteor. Soc., 137, 2106–2123, doi:10.1002/qj.878. Price, C., L. Stone, A. Huppert, B. Rajagopalan, and P. Alpert,
1998: A possible link between El Niño and precipitation in Israel. Geophys. Res. Lett., 25, 3963–3966, doi:10.1029/1998GL900098. Rebora, N., and Coauthors, 2013: Extreme rainfall in the
Mediter-ranean: What can we learn from observations? J. Hydrometeor., 14, 906–922, doi:10.1175/JHM-D-12-083.1.
Ricard, D., V. Ducrocq, and L. Auger, 2012: A climatology of the mesoscale environment associated with heavily precipitating events over a northwestern Mediterranean area. J. Appl. Meteor. Climatol., 51, 468–488, doi:10.1175/JAMC-D-11-017.1. Rotunno, R., and J. B. Klemp, 1982: The influence of the
shear-induced pressure gradient on thunderstorm motion. Mon. Wea. Rev., 110, 136, doi:10.1175/1520-0493(1982)110,0136: TIOTSI.2.0.CO;2.
——, ——, and M. L. Weisman, 1988: A theory for strong, long-lived squall lines. J. Atmos. Sci., 45, 463–485, doi:10.1175/ 1520-0469(1988)045,0463:ATFSLL.2.0.CO;2.
Rudolph, J. V., K. Friedrich, and U. Germann, 2011: Relationship between radar-estimated precipitation and synoptic weather patterns in the European Alps. J. Appl. Meteor. Climatol., 50, 944–957, doi:10.1175/2010JAMC2570.1.
Rysman, J.-F., 2013: Caractérisation multi-échelles de la pluie et des processus associés dans l’Eurorégion AlpesMéditerranée -De l’observation radarà la prévision (Multiscale charac-terization of precipitation and associated processes in the Alps–Mediterranean Euroregion—From radar observation to forecast). Ph.D. thesis, Université Pierre et Marie Curie, 258 pp. [Available online athttps://hal.archives-ouvertes. fr/tel-01119716.]
——, S. Verrier, Y. Lema^ıtre, and E. Moreau, 2013: Space–time variability of the rainfall over the western Mediterranean re-gion: A statistical analysis. J. Geophys. Res. Atmos., 118, 8448– 8459, doi:10.1002/jgrd.50656.
——, C. Claud, J.-P. Chaboureau, J. Delanoë, and B. M. Funatsu, 2016: Severe convection in the Mediterranean from micro-wave observations and a convection-permitting model. Quart. J. Roy. Meteor. Soc., doi:10.1002/qj.2611, in press.
Sénési, S., P. Bougeault, J.-L. Chèze, P. Cosentino, and R.-M. Thepenier, 1996: The Vaison-La-Romaine flash flood: Mesoscale analysis and predictability issues. Wea. Forecasting, 11, 417–442, doi:10.1175/1520-0434(1996)011,0417:TVLRFF.2.0.CO;2. Silvestro, F., S. Gabellani, F. Giannoni, A. Parodi, N. Rebora,
R. Rudari, and F. Siccardi, 2012: A hydrological analysis of the 4 November 2011 event in Genoa. Nat. Hazards Earth Syst. Sci., 12, 2743–2752, doi:10.5194/nhess-12-2743-2012. Simmons, A., S. Uppala, D. Dee, and S. Kobayashi, 2007:
ERA-Interim: New ECMWF reanalysis products from 1989 on-wards. ECMWF Newsletter, No. 110, ECMWF, Reading, United Kingdom, 25–35.
Skamarock, W., J. Klemp, J. Dudhia, D. Gill, and D. Barker, 2008: A description of the Advanced Research WRF version 3. NCAR Tech. Rep. NCAR/TN-4751STR, 113 pp. [Available online athttp://www2.mmm.ucar.edu/wrf/users/docs/arw_v3.pdf.] Smirnova, T. G., J. M. Brown, and S. G. Benjamin, 1997: Perfor-mance of different soil model configurations in simulating ground surface temperature and surface fluxes. Mon. Wea.
Rev., 125, 1870–1884, doi:10.1175/1520-0493(1997)125,1870: PODSMC.2.0.CO;2.
——, ——, ——, and D. Kim, 2000: Parameterization of cold-season processes in the MAPS land-surface scheme. J. Geophys. Res., 105, 4077–4086, doi:10.1029/1999JD901047.
Smith, R. B., Q. Jiang, M. G. Fearon, P. Tabary, M. Dorninger, J. D. Doyle, and R. Benoit, 2003: Orographic precipitation and air mass transformation: An Alpine example. Quart. J. Roy. Meteor. Soc., 129, 433–454, doi:10.1256/qj.01.212.
Stéfanon, M., P. Drobinski, F. D. Andrea, C. Lebeaupin-Brossier, and S. Bastin, 2013: Soil moisture–temperature feedbacks at meso-scale during summer heat waves over western Europe. Climate Dyn., 42, 1309–1324, doi:10.1007/s00382-013-1794-9. Svensson, C., and D. Jakob, 2002: Diurnal and seasonal
charac-teristics of precipitation at an upland site in Scotland. Int. J. Climatol., 22, 587–598, doi:10.1002/joc.674.
Tapiador, F. J., and Coauthors, 2012: Global precipitation measure-ment: Methods, datasets and applications. Atmos. Res., 104–105, 70–97, doi:10.1016/j.atmosres.2011.10.021.
Testud, J., E. Le Bouar, E. Obligis, and M. Ali-Mehenni, 2000: The rain profiling algorithm applied to polarimetric weather radar. J. Atmos. Oceanic Technol., 17, 332–356, doi:10.1175/ 1520-0426(2000)017,0332:TRPAAT.2.0.CO;2.
——, J. Lavabre, S. Diss, P. Tabary, and G. Scialom, 2007: Hydrix radar in FRAMEA—Evaluation of an X band polarimetric radar using a quasi-co located S band radar and a raingauge network. Proc. Int. Symp. on X Band Weather Radar Network, Tsukuba, Japan, National Research Institute for Earth Science and Disaster Prevention. [Available online at http://www. novimet.com/download/Testud%20et%20al_Japan_2007.pdf.] Vasic´, S., C. A. Lin, I. Zawadzki, O. Bousquet, and D. Chaumont,
2007: Evaluation of precipitation from numerical weather prediction models and satellites using values retrieved from radars. Mon. Wea. Rev., 135, 3750–3766, doi:10.1175/ 2007MWR1955.1.
Walser, A., and C. Schar, 2004: Convection-resolving precipitation forecasting and its predictability in Alpine river catchments. J. Hydrol., 288, 57–73, doi:10.1016/j.jhydrol.2003.11.035. Weisman, M. L., and R. Rotunno, 2000: The use of vertical wind
shear versus helicity in interpreting supercell dynamics. J. Atmos. Sci., 57, 1452–1472, doi:10.1175/1520-0469(2000)057,1452: TUOVWS.2.0.CO;2.
Wüest, M., C. Frei, A. Altenhoff, M. Hagen, M. Litschi, and C. Schär, 2010: A gridded hourly precipitation dataset for Switzerland using rain-gauge analysis and radar-based disaggregation. Int. J. Climatol., 30, 1764–1775, doi:10.1002/joc.2025.