XXII. COMMUNICATIONS BIOPHYSICS
Academic and Research Staff L. D. Braida S. K. Burns H. S. Colburnt L. S. Frishkopf J. L. Goldstein-t J. J. Guinan, Jr. t R. G. Mark,*"-C. M. Oman W. T. Peake-t W. M. Siebert T. F. Weiss,-f-t O. Bayer, Jr. E. Berliner L. Bonn R. Bourk H. Conrad M. Cronin H. Domnitz E. Gorelick Hasan L. Hicks Prof. T. R. Willemain Dr. J. S. Barlowtt Dr. H. Duifhuis*::* N. I. Durlach Dr. R. D. Hall Dr. A. J. M. Houtsma Dr. N. Y. S.
Kiang-Dr. L. U. E. K6hlloffellft
Dr. E. C. Moxont Dr. M. J. Mulroyt Graduate Students P. Hochfeld D. H. Johnson M. S. Keshner M. C. Libermanttj Lynette L. Linden R. P. Lippmann N. D. Megill S. L. Moshier J. A. Myers D. W. Altmannt D. J. Callahan A. H. CristT F. N. Cunningham B. Gaiman P. W. Herman, Jr. W. F. Kelley Elizabeth M. Marr-J. M. Onorato, Jr.f L. H. Seifel J. B. Walters, Jr. V. Nedzelnitsky S. R. Purks W. M. Rabinowitz C. A. Scudder N. T. Shepard P. L. Smith R. M. Stern, Jr. D. L. Sulman V. Tom L. TungRESEARCH OBJECTIVES AND SUMMARY OF RESEARCH
The principal scientific research objective of the Communications Biophysics Group is to obtain a better understanding of sensorineural processes. Our approach combines both electrophysiological and behavioral experimental techniques with machine data
This work is supported by the National Institutes of Health (Grant 5 PO1 GM14940-06, 2 TOl GM01555-06 and 1 ROl NS10737-01), the National Aeronautics and Space Administration (Grant NGL 22-009-304), the Joint Services Electronics Programs (U.S. Army, U.S. Navy, U.S. Air Force) under Contract DAAB07-71-C-0300, B-D Elec-trodyne Division, Becton Dickinson and Company (Grant), and Boston City Hospital
Purchase Order 1176-21-335.
TAlso at the Eaton-Peabody Laboratory, Massachusetts Eye and Ear Infirmary, Cambridge, Massachusetts.
O1n leave - Department of Biophysics, University College, London.
Also Instructor in Medicine, Harvard Medical School, Boston, Massachusetts. tAlso Instructor in Preventive and Social Medicine, Harvard Medical School, Boston, Massachusetts.
ItResearch Affiliate in Communication Sciences from the Neurophysiological Labo-ratory of the Neurology Service of the Massachusetts General Hospital, Boston, Massa-chusetts.
Visiting Scientist from Institute for Perception Research, Eindhoven, The Netherlands.
tttVisiting Scientist from University of Stuttgart, Germany.
1"Department of Physiology, Harvard University, Cambridge, Massachusetts. Prof. Prof. Prof. Prof. Prof. Prof. Prof. Prof. Prof. Prof. Prof.
(XXII. COMMUNICATIONS BIOPHYSICS)
processing and analytical methods of communication theory. In addition to our scientific objectives we are interested in applications of our research results, methods, and new technological developments to clinical medicine.
Members of our group have ties with several hospitals and with the Harvard Medical School. In particular, we have a close working relationship, including sharing of facil-ities and joint staff appointments, with the Eaton-Peabody Laboratory of Auditory Phys-iology, which is operated jointly by the Massachusetts Eye and Ear Infirmary, Boston, Massachusetts, and M. I. T. Another joint Harvard-M. I. T. endeavor is the Bioengi-neering Laboratory at the Thorndike Memorial Laboratory of Boston City Hospital.
Our research program can be divided into five major areas: Auditory Physiology, Auditory Psychophysics, Neuroelectric Correlates of Behavior, Transduction and Encoding in Lateral-Line Organs, and Biomedical Engineering. The programs for each
will be discussed individually.
A. Auditory Physiology
Our principal objective is to obtain an understanding of the processing of acoustic signals in the auditory system. Our approach is to quantify responses at various stages of the system and to develop models that relate the response variables to the under-lying mechanisms. Experimental work has been carried out mainly on cats, although
we have used a species of lizard for investigating problems of transduction in the inner ear.
1. Middle Ear
During the past year we began some measurements of motion of the middle ear in the lizard. We plan to complete these so as to be able to specify the input to the inner
ear of this species (Gerrhonotus multicarinatus).
We are also beginning a detailed study of the middle ear of the cat with the aim of obtaining experimental measurements that will allow formulation of a quantitative model in which each element will be identified with well-defined anatomical entities.
2. Inner Ear
A series of measurements of sound pressure in scala tympani and scala vestibuli of the basal turn of the cat cochlea has been carried out and a doctoral thesis based on these results is expected to be completed this year. Some experiments on cochlear microphonic potential at the round window of the cat were carried out to clarify the dif-ferences obtained with different electrode positions.I Work on transduction mechanisms has been concentrated on efforts to record intracellularly from the receptor organ of the lizard and to mark the cells from which recordings were taken. This work will be reported at the Spring Meeting of the Acoustical Society of America.
3. Auditory Nerve
Work on spontaneous activity in the vestibular branch of the VIIIth nerve in cats has been completed and published.2
The difficulties involved in applying our knowledge of the peripheral auditory system to the development of devices for direct electric stimulation of the auditory nerve have been investigated.3 A paper reporting measurements of auditory-nerve fiber responses to electric stimulation is in preparation. Work continues on a book that will present experimental results of auditory-nerve fiber responses in a unified conceptual framework.
(XXII. COMMUNICATIONS BIOPHYSICS)
4. Brainstem Nuclei
Experimental work on the cochlear nucleus continues, as well as preparation of manu-scripts of completed experimental work. Two papers which report results from single-unit recording in the superior olivary complex have been accepted for publication.4, Approaches to combined anatomical and physiological study of signal processing in these nuclei have been presented. 6' 7
N. Y. S. Kiang, J. J. Guinan, Jr., W. T. Peake, T. F. Weiss
References
1. T. F. Weiss and W. T. Peake, "Cochlear Potential Response at the Round-Window Membrane of the Cat -A Reply to the Comment of G. R. Price," J. Acoust. Soc. Am. (in press).
2. B. T. Walsh, J. B. Miller, R. P. Gacek, and N. Y. S. Kiang, "Spontaneous Activ-ity in the Eighth Cranial Nerve of the Cat," Intern. J. Neurosci. 3, 221-236 (1972).
3. N. Y. S. Kiang and E. C. Moxon, "Physiological Considerations in Artificial Stimu-lation of the Inner Ear," Ann. Otol. Rhinol. Laryngol. 81, 714-730 (1972).
4. J. J. Guinan, Jr., S. S. Guinan, and B. E. Norris, "Single Auditory Units in the Superior Olivary Complex. I. Responses to Sounds and Classification Based on Physiological Properties," Intern. J. Neurosci. (in press).
5. J. J. Guinan, Jr., B. E. Norris, and S. S. Guinan, "Single Auditory Units in the Superior Olivary Complex. II. Locations of Unit Categories and Tonotopic Organi-zation" (Intern. J. Neurosci. , in press).
6. N. Y. S. Kiang, D. K. Morest, D. A. Godfrey, J. J. Guinan, Jr., and E. C. Kane, "Stimulus Coding at Caudal Levels of the Cat's Auditory Nervous System. I. Response Characteristics of Single Units," Symposium on Basic Mechanisms in Hearing, Royal Academy of Sciences, Stockholm, Sweden, October 30-November 1, 1972.
7. D. K. Morest, N. Y. S. Kiang, E. C. Kane, J. J. Guinan, Jr., and ID. A. Godfrey, "Stimulus Coding at Caudal Levels of the Cat's Auditory Nervous System. II. Pat-terns of Synaptic Organization," Symposium on Basic Mechanisms in Hearing, Royal Academy of Sciences, Stockholm, Sweden, October 30-November 1, 1972.
B. Auditory Psychophysics
Research has been conducted in the areas of intensity perception, pitch perception, binaural hearing and localization, combination tones, middle-ear sound transmission, and the intelligibility of transformed speech.
The work on intensity perception has focused on resolution and bias in identification and roving-level discrimination, and has produced an improved model for context coding, -4 as well as refined data-processing techniques and extensive new data. In pitch perception, significant progress has been made in the development of a compre-hensive theory of the central processing of musical pitch, and in the experimental deter-mination of confusions made by subjects in identifying notes heard with two-tone sounds5 (see Section XXII-C). Research on binaural hearing and localization has been oriented toward improved stimulus control for studies in which earphones are
(XXII. COMMUNICATIONS BIOPHYSICS)
6-11
employed, and the preparation of previous results for publication. We are also initiating new projects on localization. In the area of combination tones,12 we have developed a theory of neural phase locking to combination tones derived from simple transducers. In the area of middle-ear transmission, the effects of the aural reflex and of static drum pressure are being explored in humans by means of both acoustic impedance measurements and combination-tone phenomena. Research connected with the intelligibility of transformed speech is focusing on the perception of "chirps" and on
formant-lowering pitch-invariant transformations of speech.
During the coming year, we intend to continue research on all of these topics. J. E. Berliner, L. D. Braida, D. J. Callahan, H. S. Colburn, R. H. Domnitz,
H. Duifhuis, N. I. Durlach, J. L. Goldstein, B. L. Hicks, A. J. M. Houtsma, W. F. Kelley, R. P. Lippmann, S. L. Moshier, W. M. Rabinowitz, N. T. Shepard, W. M. Siebert
References
1. N. I. Durlach and L. D. Braida, "Intensity Perception. I. Preliminary Theory of Intensity Resolution," J. Acoust. Soc. Am. 46, 372-383 (1969).
2. L. D. Braida and N. I. Durlach, "Intensity Perception. II. Resolution on One-Interval Paradigms," J. Acoust. Soc. Am. 51, 483-502 (1972).
3. C. T. Pynn, L. D. Braida, and N. I. Durlach, "Intensity Perception. III. Reso-lution in Small-Range Identification," J. Acoust. Soc. Am. 51, 559-566 (1972). 4. J. E. Berliner and N. I. Durlach, "Intensity Perception. IV. Resolution in Roving
Level Discrimination" (to be published in J. Acoust. Soc. Am.).
5. A. J. M. Houtsma and J. L. Goldstein, "The Central Origin of the Pitch of Complex Tones: Evidence from Musical Interval Recognition," J. Acoust. Soc. Am. 51, 520-529 (1972).
6. H. S. Colburn, "Theory of Binaural Interaction Based on Auditory-Nerve Data. I. General Strategy and Preliminary Results on Interaural Discrimination" (sub-mitted to J. Acoust. Soc. Am.).
7. H. S. Colburn, "Theory of Binaural Interaction Based on Auditory-Nerve Data. II. Outline of Model and Application to Binaural Detection with Identical Noise Masker" (paper in preparation).
8. H. S. Colburn, "Theory of Binaural Interaction Based on Auditory-Nerve Data. III. Binaural Detection in Noise" (paper in preparation).
9. R. D. Domnitz, "The Interaural Time JND as a Simultaneous Function of Inter-aural Amplitude" (submitted to J. Acoust. Soc. Am.).
10. N. I. Durlach and H. S. Colburn, "Overview of Binaural Phenomena," in E. C. Carterette and M. P. Friedman (Eds.), The Handbook of Perception, Vol. 4 (to be published by Academic Press, Inc.).
11. H. S. Colburn and N. I. Durlach, "Models of Binaural Interaction," in E. C. Carterette and M. P. Friedman (Eds.), The Handbook of Perception, Vol. 4
(to be published by Academic Press, Inc.).
12. J. L. Goldstein, "Aural Combination Tones," in R. Plomp and G. F. Smoorenburg (Eds.), Frequency Analysis and Periodicity Detection in Hearing (A. W. Sijthoff,
Leiden, The Netherlands, 1970).
13. J. L. Goldstein, "Aural Combination Tones," Quarterly Progress Report No. 100, Research Laboratory of Electronics, M. I. T., January 15, 1971, pp. 203-204.
(XXII. COMMUNICATIONS BIOPHYSICS)
C. Neuroelectric Correlates of Behavior
In this research we continue to focus on eyelid reflexes in the albino rat.1,2 Prog-ress in delineating the neural circuitry of these reflexes has been made during the past year through electrophysiological studies of trigeminal, reticular, oculomotor and
abducens nuclei. These studies continue. We investigated operant conditioning of eye -lid responses in humans in order to gain insight into a problem encountered with the rat. We shall return to conditioning experiments with rats, with an improved method for measuring eyelid position. We shall add to our investigations of the corneal reflex the study of a second eyelid reflex, and begin the development of a preparation in which the conditioning of both reflexes can be studied at the neuronal level.
R. D. Hall
References
1. R. D. Hall and D. M. Boccard, "Two Somatic Eyelid Reflexes in the Albino Rat," a paper presented at the Forty-third Annual Meeting of the Eastern Psychological Association, Boston, April 27-29, 1972.
2. R. D. Hall, "Some Properties of Conditioned and Unconditioned Eyelid Reflexes in the Albino Rat" (submitted to J. Comp. Physiol. Psych.).
D. Transduction and Encoding in Lateral-Line Organs
1. Neural Responses to Direct Mechanical Stimulation
A technique has been developed for directly stimulating individual freestanding cupulae in the lateral-line organs of Necturus by means of a small wire hook. Afferent and efferent nerve responses have been recorded from organs in the tail of the animal.1 We found that each afferent fiber responds either to rostral or caudal displacement with a strong rate-sensitive component. Instantaneous spike frequency averaged over periods of constant stimulus velocity appears to be a linear function of velocity in the 75 -500 ym/s range. Sensitivity varies between 0. 1 and 0. 2 spikes/[m. Units identified as efferent do not respond to cupular motion, nor do the efferents appear to exert an effect on affer-ent response, at least in a Flaxedilized preparation (see Section XXII-B for a detailed description of this work).
C. M. Oman, L. S. Frishkopf
2. Central Processing of Neural Responses
A major objective this year is to obtain responses to lateral-line stimulation at the level of the second-order neurons in the medulla. We hope to study the central repre-sentation of responses to oppositely directed stimuli, which are encoded peripherally in separate groups of neurons. An attempt will be made to explore within the medulla the spatial map of distribution of lateral-line organs on the body surface. We plan to begin these physiological studies in Xenopus, for which the peripheral anatomy and phys
-iology of the lateral-line system have been extensively explored and the medullary pro-jections of the posterior lateral line nerve have recently been investigated by R. M. Boord2 at the University of Delaware.
(XXII. COMMUNICATIONS BIOPHYSICS)
References
1. C. M. Oman, "Dynamic Response of the Semicircular Canal and Lateral-Line Organs," Ph.D. Thesis, Department of Aeronautics and Astronautics, M.I. T., June 1972.
2. R. M. Boord, Personal communication, 1972.
E. Biomedical Engineering
We have focused our efforts during the past year on development and evaluation of instrumentation, including computer systems, which can be applied to problems in med-icine and physiology. We have completed the development of a laboratory computer system that includes the necessary peripheral hardware for real-time signal pro-cessing and control, and provides an easily used programming language patterned after BASIC. A duplicate of this system is located in our laboratory at Boston City Hospital and a similar system, with programming for manipulation of vectorcardio-grams will be delivered to the NASA Manned Space Flight Center for use with the SKYLAB project to be launched in April 1973. We have developed several promising algorithms for beat-to-beat analysis of electrocardiograms, and work toward developing a noninvasive measurement of blood pressure continues, with major emphasis on means of detecting arterial pulse arrival. We have been increasingly concerned with predictive diagnostic measures, and we plan to emphasize monitoring ambulatory patients. This activity complements an ongoing program for providing medical care in nursing homes. Major new projects include the development of a miniature programmable computer sys-tem, which will be small enough to be carried easily by a patient, and sufficiently powerful to provide summary statistics for intervals in excess of 24 hours.
S. K. Burns, R. G. Mark
(XXII. COMMUNICATIONS BIOPHYSICS)
A.
COCHLEAR POTENTIAL RESPONSE AT THE ROUND-WINDOW
MEMBRANE OF THE CATNIH (Grant 5 PO1 GM14940-06) T. F. Weiss, W. T. Peake
We have reported previously measurements of the cochlear potential response to tones, measured with micropipets in the scalae of the basal end of the cochlea and with gross electrodes on the surface of the bony wall of the cochlea near the round window.1 -This report presents both some new measurement methods and some data with which we can compare results obtained with different methods. Some of these results have been discussed elsewhere by Weiss and Peake.4
1. Methods
A system for delivering acoustic stimuli (tones) and recording responses under com-puter control has been described by Weiss et al.5 This system was used to mea-sure E, the fundamental component of cochlear potential response to tones, and Pd' the fundamental component of the sound pressure near the tympanic membrane, as the fre-quency was swept over the range of interest. After initial calibration of the acoustic system, the computer system can maintain Pd constant as the frequency varies. Figure XXII-1 shows this system with additional equipment used to maintain the response variable I E constant while the frequency is swept.
2. Results
a. Transfer Ratio from Sound Pressure at the Tympanic Membrane to Cochlear Potential Response
The transfer ratio has been measured as a function of frequency both with constant Pd (Fig. XXII-2)and constant E . The potential, ERW, was measured with a wire elec-trode on the round-window membrane (Figs. XXII-3 and XXII-4). Both sets of curves show the following features: (i) A sharp, relatively level-independent resonance at 2.7 kHz (appearing as a local minimum in Fig. XXII-2 and as a local maximum in Fig. XXII-3 caused by a resonance in the middle-ear cavity that can be removed by opening the bony septum. (ii) Sharp, level-dependent changes occur between 700 Hz and 2 kHz for low-level characteristics (Pdl less than 60 dB (Fig. XXII-2); ERWI equal to 0 and
10 dB (Fig. XXII-3)). These appear to be the same phenomenon that has been attrib-uted to contributions of neural potentials to the cochlear potential response.7 (iii) There is a range of frequency and level for which IERW and IPd are proportional: For the constant Pdl characteristics the range is 2 < f
<
16 kHz and IPdl < 90 dB SPL,DSK
DIGITAL OSCILLOSCOPE TOGGLE SWITCHES
S
TELETYPE PLOTTER BUTTONS
Fig. XXII-1.
Computer system to measure constant IPd
(magnitude of the
fundamental component of the pressure near the tympanic mem-brane) and constant JE (magnitude of the fundamental compo-nent of the cochlear potential response) characteristics. For constant Pd characteristics (switch B in position 1 and switch C open), the computer controls the frequency and level of the volt-age to the earphone to achieve the desired value of IPd at each frequency. (The transfer ratio of pressure to oscillator voltage, Pd/Vosc' and the transfer ratio of the pressure of the tip of the probe tube to the voltage output of the probe-tube microphone, Pd/Vptm, are measured during the calibration procedure at the beginning of each experiment.) Switch A controls whether IEIor IPd is measured. The response signal selected for measure-ment is fed to tracking filter #1 (an electrically tuned filter with 2-Hz bandpass) tuned to the oscillator's frequency. The output of the tracking filter is put into a logarithmic converter and a phase meter. The reference signal for the phase meter is ob-tained from the oscillator voltage fed through a phase compen-sator which introduces a phase shift in the reference signal equal to that introduced by the tracking filter. The log magnitude and phase of the fundamental component of the response signal are fed into the computer through a two-channel signal multiplexer and an A -D converter. For constant IE I (switch B in position 2
and switch C closed), the computer controls the frequency of the voltage to the earphone, but the level of this voltage is determined by a voltage-controlled attenuator (designed by A. H. Crist). The cochlear-potential response is fed to tracking filter #2, to loga-rithmic converter #2, and then to a comparator. The comparator (designed by E. C. Moxon) compares the output of the logarithmic converter (which is proportional to log I EI ) with a preset control level (which is proportional to the desired value of log E ). If E m > E c , the comparator output is such that the rate of change of the voltage-controlled attenuation (dB/s) is positive; if E < Ec' the rate of change of attenuation is negative. Thus as the fre-quency is swept, the feedback loop attempts to maintain E = E and, with switch A in position 2, the computer system can be used to measure the Pd required to maintain E at the constant value. With switch A in position 1 the computer measures E so that the frequency range over which E was, in fact, held constant can be determined.
IPdl (dB re 0.0002 dynes/cm2 rms) ~VTT IT I -I 1 1111111 I I TIIITJ T i i i I i i i I i 1000 FREQUENCY (Hz) S 10000 I 20000 I 10000 20000
Fig. XXII-2. Magnitude of cochlear potential responses to tones ERW for a constant sound pressure level at the tympanic membrane, Pd (in the range 30-100 dB SPL) vs frequency. ERW was obtained with a silver-wire electrode on the round-window membrane (bulla open, septum closed). The lowest curve was obtained with the stimulus off and represents the noise level in the mea-surement. The two characteristics at 70 dB SPL were measured at the beginning and end of this set of measurements. In each decade of frequency there are 40 data points equally spaced on a logarithmic scale. These points are connected by straight lines. The symbols indicate every 6t h data point.
QPR No. 108 50 40 30 20 I0 0 -10 -20 -30 -40 -- 50 40 30 -20 - 10 -0 --20 -- 30 -- 40 I I I I I I I I 20 100 326
1000
FREQUENCY (Hz)
30
-Fig. XXII-3. Magnitude of the sound-pressure level at the tympanic membrane, Pd , required to obtain a constant cochlear-potential response (of 0, 10, and 20 dB re 1
pV
rms) on the round-window membrane JE WI . The electrode was not moved between the recording of thedata in Figs. XXII-2 and XXII-3. The lowest curve was obtained with the stimulus off and is the voltage noise output of the probe-tube microphone and amplifier referred to the pressure at the tip of the probe tube; i. e., it is the noise level in the pressure mea-surement. The upper curve represents the maximum pressure generated by the acoustic system for the constant El character
-istics. The decrease of pressure at low frequency is in part attrib-utable to the frequency response of the voltage -controlled attenuator. 130 120 rm 110 us S100 90 B r e uV r m s ) 89 0 80 20dB 70 IOdB 60 0dB 50 40 ius Off 30 20 PC#4 If0000 2 10 10000 20000 120 -
110100
E 90 -o S80-09
70-O 60-50 -40 30 100Desired IERwl (dB re I uV rms)
1000
FREQUENCY (Hz)
Fig. XXII-4. Cochlear -potential response for constant cochlear -potential characteristics. These characteristics were obtained for the same conditions as the characteristics shown in Fig. XXII-3. The feedback system controlled ERWJ at 20 dB for the fre-quency range 50-11,000 Hz, at 10 dB for 40-12, 000 Hz, and at 0 dB for 50-15, 000 Hz. Thus the data of Fig. XXII-3 are valid only for these frequency ranges. In Figs. XXII-5 and XXII-7, we plotted characteristics for those ranges of fre-quency for which the cochlear potential was maintained at its control value as indicated by records like these. In subse-quent figures the potentials have been corrected for the fre-quency response of the recording amplifiers. This correc-tion is less than 3 dB for the frequency range shown.
o IPd =70dB SPL
O
IERwI=3.2pV rms PC#4 I I I i I 11 II 1000 FREQUENCY I 1 I I 1 100 1 10000 20000 (Hz)Fig. XXII-5.
Comparison of IPd/ERW , obtained by measuring E RWI
for
IPd
= 70 dB SPL and by measuring
P d
I
required to
maintain
iERWI
=
3. 2
[V
rms (bulla open, bony septum
intact).
QPR No. 108
+20 +10 0 - 10 -20 80-70 -60 -50 -40 -30 -20 80 70 -60 -50 -40 -30 20 I I I I I I _100 328 ...I-100 1000 10000 20000 FREQUENCY (Hz)
Fig. XXII-6.
Effect of interrupting the ossicular chain on the cochlear potential response recorded at the round-window membrane ERW. I Pd required to obtain ERWI = 3. 2 [V rms was measured with the bony septum open so that the incudostapedial joint could be seen. This response criterion was met within 3 dB over the frequency range 42 _< f < 17, 000 Hz. The ossicular chain was interrupted by carefully removing a small piece of the incus at the incudosta-pedial joint and the measurement was repeated. I Pd required to obtain IERW = 3.2 [iV rms was equal to or greater than the maximum IPd generated by the acoustic system for most fre-quencies. Near 1 kHz the value of Pd required was 50 dB larger for the interrupted ossicular chain than for the normal condition. The ossicular chain was reconnected with a dab of dental cement and the measurement was repeated. ERW = 3. 2 V rms within 3 dB for the frequency range 53 < f < 20, 000 Hz for this curve.(XXII. COMMUNICATIONS BIOPHYSICS)
and for the constant IE characteristics the range is 2 : f 12 kHz for the three levels shown. A careful examination of the data shows there are systematic (although some-times small) deviations from linearity for f < 1 kHz for all levels shown. Near 1 kHz the deviations may be very large.
To compare results obtained by these two techniques, we compute Pd/ERWi from each set of measurements. Since significant nonlinearities appear, the two ratios are not, in general, equal; however, Pd /E W computed for Pd 70 dB SPL and for
JERWI 3. 2 [iV rms are approximately equal (Fig. XXII-5). These values of stimulus and response parameters represent a compromise of the following factors: For larger Pd the relation of ERW to Pd is more nonlinear; for smaller !Pd ERW is above the noise over a smaller frequency range and ERW is contaminated more by the neural component of the response.
We wished to evaluate the possible contribution of transmission paths from the stimulus system to the response which do not involve the ossicular chain of the middle
ear. For this purpose we measured (Fig. XXII-6) Pdi required to obtain ERVI : 3. 2 [IV rms for a normal middle ear, and for a middle ear with the ossicular chain interrupted. These measurements show that with our experimental arrangement and with an intact middle ear we cannot attribute an appreciable fraction of the recorded
rc 'nd-window response to factors other than stapes motion over the frequency range 60-20,000 Hz.
In our laboratory we have carried out experiments with cats either resting on their back- or on their bellies. In one experiment we looked for an effect of the orientation of the animal on the recorded potentials. We measured the ratio of
IPdl required to obtain ER1 v I = 3. 2 [pV rms with the animal on its back and on
its belly. The difference between these two measurements was less than 8 dB for 60 < f < 10, 000 Hz. +20 +20 + 10 + 10 m Pd (dB re 0.0002 dynes/cm2 rms) 0- i o 100 dB 0 SA 90 dB + 80dB -0 x 70 dB -10
0
60 dB PC#I -20 1 --20 20~
T I I I llI I 20 20 100 1000 10000 20000 FREQUENCY (Hz)Fig. XXII-7. EERW/EG vs frequency for different 1Pd
(XXII. COMMUNICATIONS BIOPHYSICS)
b. Effect of Electrode Position
Recently, Price8 has published data showing a frequency dependence of the ratio between IERwI and IEG , the magnitude of the cochlear potential response recorded on the bone near the round window. To investigate this, electrodes were placed simultaneously on the bone and on the round-window membrane and either constant
IPdl or constant E characteristics were measured (Fig. XXII-7 in this report and Fig. XXII-1 in ref. 4). ERW/EG is relatively independent (+2 dB) of frequency in the range 400 Hz-20 kHz. Below 400 Hz the ratio decreases. ERW/E G depends
systematically on stimulus level for f < 400 Hz, so that for IPdl > 70 dB SPL the frequency at which ERW/EG decreases below its high-frequency value is lower.
In two experiments we measured the ratio IERW/ET1 (where ET is the cochlear-potential response recorded in scala tympani) by using KCL-filled pipets as electrodes. For 200
<
f < 10, 000 Hz, -6 dB<
ERW/ET<
+5 dB for measurements obtained for 70 < dPd<
100 dB SPL.References
1. H. S. Sohmer, W. T. Peake, and T. F. Weiss, "Intracochlear Potential Recorded with Micropipets. I. Correlations with Micropipet Location," J. Acoust. Soc. Am. 50, 572-586 (1971).
2. T. F. Weiss, W. T. Peake, and H. S. Sohmer, "Intracochlear Potential Recorded with Micropipets. II. Responses in the Cochlear Scalae to Tones," J. Acoust. Soc. Am. 50, 587-601 (1971).
3. T. F. Weiss, W. T. Peake, and H. S. Sohmer, "Intracochlear Potential Recorded with Micropipets. III. Relation of Cochlear Microphonic Potential to Stapes Veloc-ity," J. Acoust. Soc. Am. 50, 602-615 (1971).
4. T. F. Weiss, and W. T. Peake, "Cochlear Potential Response at the Round-Window Membrane of the Cat - A Reply to the Comment of G. R. Price" (to appear in J. Acoust. Soc. Am.).
5. T. F. Weiss, G. M. Goldmark, D. W. Altmann, and R. M. Brown, "Automated System to Control Stimulus and Measure Response Variables in Experiments on the Auditory System," Quarterly Progress Report No. 95, Research Laboratory of Elec-tronics, M.I. T., October 15, 1969, pp. 122-127.
6. J. J. Guinan and W. T. Peake, "Middle-Ear Characteristics of Anesthetized Cats," J. Acoust. Soc. Am. 41, 1237-1261 (1967).
7. See ref. 2, Figs. 6 and 7.
8. G. R. Price, "Comment on Intracochlear Potential Recorded with Micropipets. III. Relation of Cochlear Microphonic Potential to Stapes Velocity," J. Acoust. Soc. Am. 51, 2059-2061 (1972).
(XXII. COMMUNICATIONS BIOPHYSICS)
B. NEURAL RESPONSES OF LATERAL-LINE ORGANS IN NECTURUS MACULOSUS TO DIRECT MECHANICAL STIMULATION
NIH (Grant 5 PO1 GM14940-06)
C. M. Oman, L. S. Frishkopf
We have developed a technique for stimulating individual freestanding cupulae in the lateral-line organs of Necturus maculosus, by means of a small wire hook. The anat-omy of the organs of this common aquatic salamander, and their innervation have been
described in a previous report. Afferent and efferent nerve responses were recorded from one organ on the tail of the animal while another organ of the same stitch was stimulated. Efferent nerves were observed to respond to touch stimuli, but not to lateral-line afferent stimulation. Possibly because of the relaxing agent used, efferents did not appear to modify afferent response. We report here results of preliminary
experiments in which afferents were found to respond in a direction-sensitive manner, with instantaneous spike frequency proportional to cupula velocity.
1. Introduction
The mudpuppy (Necturus maculosus) is a large aquatic salamander common in lakes and streams of central and northeastern United States. The lateral-line system of Necturus comprises a large number, perhaps as many as a thousand, freestanding organs, distributed over the animal's dorsal and lateral surfaces. These are arranged in linear groups, called stitches, each of which comprises from one to perhaps eight organs. The sensory epithelium of each organ contains 8-10 hair cells morphologically similar to those found in the vestibular and auditory systems of other vertebrates. The hair cells are separated and surrounded by a great many supporting cells; together they form a bulbous structure within the skin, roughly 200 Lm in diameter. Surmounting the central portion of each organ and projecting into the surrounding water is a long, tapering, gelatinous cupula which serves to couple the motion of the water to the under-lying hair cells.
A theoretical model has been developed2 for the dynamics of cupula movement in response to relatively uniform motions of the surrounding water. It appears that the cupula responds as an overdamped second-order system with respect to water velocity. The time constants of the response are expected to be heavily influenced by cupula length. For a unit step change in local water displacement, the cupula should deflect almost immediately to an angle proportional to cupula length. The time required for the cupula to return to the erect position is expected to range from a few to several hundred milliseconds, depending on cupula length. Apparently the lengths of the cupulae are normally limited only by a continual wiping and breaking off of the terminal portions
(XXII. COMMUNICATIONS BIOPHYSICS)
during active movements of the animal. Hence the dynamic response of an individual organ is expected to be highly individualistic. As a result, if indirect hydrodynamic stimulation is used in an experimental preparation, the resulting cupula motion is dif-ficult to quantify. Therefore we sought to develop a technique for driving the cupula directly by mechanical means.
2. Methods
The animals (Necturus maculosus) weighed between 80 gm and 120 gm. Each was relaxed before use by injection of gallamine triethiodide (Flaxedil; Davis & Geck) into a lymph space on the top of its head. The dosage was 0. 9 mgm/100 gm body weight. When the animal no longer responded to toe pinch, it was placed in water in a plastic tray with its tail held motionless by a sponge-lined clamp. We observed the blood flow rate in the tail with an operation microscope, and adjusted the clamp pressure to insure adequate circulation. Air was bubbled through the water beside the animal's external gills.
Both afferent and efferent nerve responses were recorded from the same micro-electrode. The electrodes, with tip diameters of less than 2
p~m,
were filled with a mixture of 3M KC1 and 5% methyl blue. The blue dye was used to make the electrode tip visible in the water during the positioning process. Electrode impedance was usu-ally approximately 5 MQ. Electrodes were positioned by means of micrometer drives and viewed through a Zeiss operation microscope. Potentials were measured with a wideband neutralized input capacity preamplifier (Bioelectric Instruments NF-1, 101 2input impedance).
Nerve spike responses were usually encountered within 50
p~m
of the surface of the organ. Spike heights were usually 200-400pV,
roughly four times the ambient noise level.Cupulae were directly displaced by means of a hook, fabricated by bending a flame-pointed tungsten wire with forceps under a dissecting microscope. With practice, hooks can be made in practically any desired shape. The maximum diameter of the curved portion of the hooks was 50-70 rim, roughly equal to the diameter of the cupula. The other end of the tungsten wire was glued into the tip of a broken glass electrode, and mounted in a micrometer drive so that the hook could be moved in precise displacement increments in rostral-caudal direction. Driver displacement was measured by means of a carbon potentiometer mounted on the micrometer drive. Smooth, nearly constant velocity truncated displacement ramps could be easily generated manually.
Normally, the cupula is so transparent as to be almost invisible under the light microscope. Various stains (methylene blue or Janus green B) can be used to stain the cupula, but these stains are also known to abolish afferent response. Since the outline of the underlying organ may easily be visualized, however, the location of the cupula
(XXII. COMMUNICATIONS BIOPHYSICS)
could be inferred, and the hook attached to it by lowering the hook to the surface of the skin near the organ with the micrometer controls and moving it along the surface of the skin until it surrounded the organ. The hook was then raised 50 Fim, as determined on the micrometer drive, and the stimulation began. At the conclusion of the experiment, the position of the cupula relative to the hook was verified by staining.
3. Re sults
Initial attempts to record afferent responses showed that the unstained organ was extremely sensitive to water motions in the holding tray. Sending water past the organs with a pipet produced strong bursts of afferent activity. Usually several different units, distinguishable on the basis of spike height and shape, were apparent in the record at the same time. Isolation of individual units was occasionally possible by adjusting the recording electrode. The observed units could be grouped in four major categories.
(i) Spontaneously active units, sensitive to rostral flow of water, presumably affer-ent.
(ii) Spontaneously active units, sensitive to caudal flow of water, also afferent. (iii) Units which did not appear to respond to local water flow, but in which bursting or slowing changing activity that appeared to be correlated with pulse rate or toe pinch was evidenced.
(iv) Units which exhibited regular bursting or irregular spontaneous activity, but did not respond to any applied stimulus.
It is presumed that the units in group (iii) are efferents. Responses of lateral-line efferents have been observed in Necturus by Schmidt;3 in Xenopus by Gorner4 and Russell;5,6 and in the sea eel by Hashimoto et al.7 The function of the efferents in the lateral line is the subject of some debate. Hashimoto et al.7 found that the efferent
system in canal organs in the Japanese sea eel is directly activated by afferent activity in that organ, and that efferent activity inhibits afferent response. On the other hand,
Russell did not observe efferent response to afferent stimulation in Xenopus, but did observe efferent responses to active movements. He also reported that efferents inhibit afferent activity, a finding that Gorner failed to observe. Schmidt found efferent activity in Necturus to be correlated with rotatory, vibratory, and tactile stimulation, and gill movements. Our present findings tend to confirm the results of the last two authors, in that efferent responses to afferent stimulation were not observed, but responses to pinching or prodding the animal were seen. An attempt was made to stimulate the effer-ents with a flashgun stimulus to the visual system, but this was unsuccessful.
It was also observed that activity of afferent units (types (i) and (ii)) was uncorrelated with activity of efferent units (type (iii)). This may be due to the effects of Flaxedil, the relaxing agent that was used in the preparation. Russell5, 6 has demonstrated that stim-ulation of lateral-line efferents normally inhibits afferent activity. This effect is
(XXII. COMMUNICATIONS BIOPHYSICS)
reversibly blocked by D-tubocurarine chloride.
The chief pharmacologic action of
curare in skeletal muscle is to compete with acetylcholine at the cholinergic receptors
of the motor end plate.
Flaxedil has a similar action.
We might suspect, therefore,
that even though the efferent fibers continued to be active in this preparation, the
phys-8.
iological function of the efferent, presumably cholinergic synapses,
in the lateral line
organs would be impaired.
Afferent response to stimuli applied to the cupula by means of a hook was studied in
more detail.
Although previous studies on lateral line organs in several other
species
9 - 1 1indicated that both the canal and freestanding varieties of lateral-line organs
are primarily transducers of cupula displacement, we found to our surprise that the
afferent response appeared associated with cupula velocity.
The unit shown in
Fig. XXII-8 had low spontaneous activity, so the stimulus-related responses are quite
evident. If this unit was functioning in response to cupula displacement, then the
response must have been one of very rapid adaptation. In other units, the
velocity-related response was observed superimposed on irregular spontaneous activity, usually
with average frequencies less than 5 spikes/second.
Fig. XXII-8.
Response of caudally sensitive unit to driver displacement.
Upper Trace: Unit response.
Lower Trace: Driver position.
Current efforts are aimed at studying this effect more quantitatively.
For example,
average frequency was calculated during constant velocity portions of records obtained
from 11 experimental runs in 4 stimulus situations in 3 animals. Averaging was done
over the constant velocity portions of the record to eliminate any artifact introduced by
impulsively stopping the driver. Average frequency was calculated by dividing the
num-ber of response spikes over the constant velocity interval by the duration of the interval.
Responses of the caudally sensitive unit shown in Fig. XXII-8 are plotted as a function
of driver velocity in Fig. XXII-9.
Data in Fig. XXII-9 were taken in two runs of 15
stimulus presentations each at intervals of several seconds.
Responses to stimuli in
which driver velocity was not constant were discarded.
This unit has a sensitivity of
approximately 0. 16 spikes/pm, regardless of a change in driver position between runs.
QPR No. 108
I a
(XXII. COMMUNICATIONS BIOPHYSICS)
A : NO INITIAL DISPLACEMENT
O : INITIAL DISPLACEMENT = 25 .Lm CAUDALLY
A o
:,
o
A 0 O A 00I
I
I
I
I
I
I
I
100 200 300 400 DRIVER VELOCITY (/.m/s)Fig. XXII-9.
Response frequency vs driver velocity of caudally sensitive unit, for two different values of initial driver displacement. Driver height is 50 jLm.Velocity threshold for this unit was clearly less than 60 ktm/second, and possibly con-siderably lower, as spontaneous activity was observed to be less than 1 spike/second. Figure XXII-10 shows the response of a rostrally sensitive unit observed in a dif-ferent stitch. Sensitivity appears similar to that of the unit in Fig. XXII-8, although the response was to motion in the opposite direction.
Some decay in velocity sensitivity was generally observed over periods of several
110 100 S0 O OO O I I I I I I I I I 100 200 300 400 DRIVER VELOCITY ( pm/s)
Fig. XXII-10. Response frequency vs driver velocity for rostrally sensitive unit.
(XXII. COMMUNICATIONS BIOPHYSICS)
hours. However, removal of all cupulae on a given stitch other than the one being stim-ulated did not appear to affect the velocity sensitivity. This indicates that the observed activity represents the response of the organ to suprathreshold motion of only the cupula that was being stimulated.
4. Discussion
We are seeking to perfect automated methods for stimulus delivery and data collec-tion so that we can study more thoroughly the dynamics of afferent response to different classes of displacement inputs. We are also running controls with different kinds of anesthesia. Initial attempts with subcutaneously injected sodium pentobarbital indicate that if a displacement-sensitive component of response occurs, the magnitude of this response stimulus is quite small compared with the transient burst provoked by the cupula movement. If the rate sensitivity observed in these experiments represents a "physiologic" phenomenon, then it suggests that, in Necturus at least, the lateral-line organs function primarily to detect the transient component of the cupula displacement. This in turn implies that the afferents signal flow acceleration at sufficiently low frequencies and flow velocity at higher frequencies.
References
1. L. S. Frishkopf, H. Liff, and C. M. Oman, "Structure and Motion of Cupulae of Lateral-Line Organs in Necturus maculosus: I. Introduction," Quarterly Progress Report No. 104, Research Laboratory of Electronics, M.I. T., January 15, 1972, pp. 326-329.
2. C. M. Oman, "Structure and Motion of Cupulae of Lateral-Line Organs in Necturus maculosus: IV. Preliminary Model for the Dynamic Response of the Freestanding Lateral-Line Cupula Based on Measurements of Cupula Stiffness," Quarterly Prog-ress Report No. 104, Research Laboratory of Electronics, M. I. T. , January 15, 1972, pp. 336-343.
3. R. S. Schmidt, "Amphibian Acoustico-lateralis Efferents," J. Cell Comp. Physiol. 65,
155-162 (1965).
4. P. Gorner, "Independence of Afferent Activity from Efferent Activity in the Lateral Line Organ of Xenopus laevis daudin," in P. Cahn (Ed.), Lateral Line Detectors
(Indiana University Press, Bloomington, Ind., 1967), pp. 119-214.
5. I. J. Russell, "Influence of Efferent Responses on a Receptor," Nature 219, 177-178 (1968).
6. I. J. Russell, "The Role of the Lateral Line Efferent System in Xenopus laevis," J. Exptl. Biol. 54, 621-641 (1971).
7. T. Hashimoto, Y. Katsuki, and K. Yanagisawa, "Efferent System of Lateral Line Organ of Fish," Comp. Biochem. Physiol. 33, 405-421 (1970).
8. I. J. Russell, "The Pharmacology of Efferent Synapses in the Lateral Line System of Xenopus laevis," J. Exptl. Biol. 54, 643-658 (1971).
9. A. Sand, " The Mechanism of the Lateral Line Sense Organ of Fishes," Proc. Roy. Soc. (London) B123, 472-495 (1937).
(XXII. COMMUNICATIONS BIOPHYSICS)
10. G. G. Harris and W. A. van Bergeijk, "Evidence that the Lateral Line Organs Respond to Near-field Displacements of Sound Sources in Water," J. Acoust. Soc. Am. 34, 1831-1841 (1962).
ii.
G. G. Harris and D. C. Milne, "Input-output Characteristics of the Lateral Line
Sense Organs of Xenopus laevis," J. Acoust. Soc. Am. 40, 32-42 (1966).
C.
AN OPTIMUM PROCESSOR THEORY FOR THE CENTRAL
FORMATION OF THE PITCH OF COMPLEX TONES
NIH (Grants 5 P01 GM14940-06 and 1 ROI NS10737-01)
J. L. GoldsteinA psychophysical theory of the central formation of pitch of complex tones has been
developed.
1.
Theory
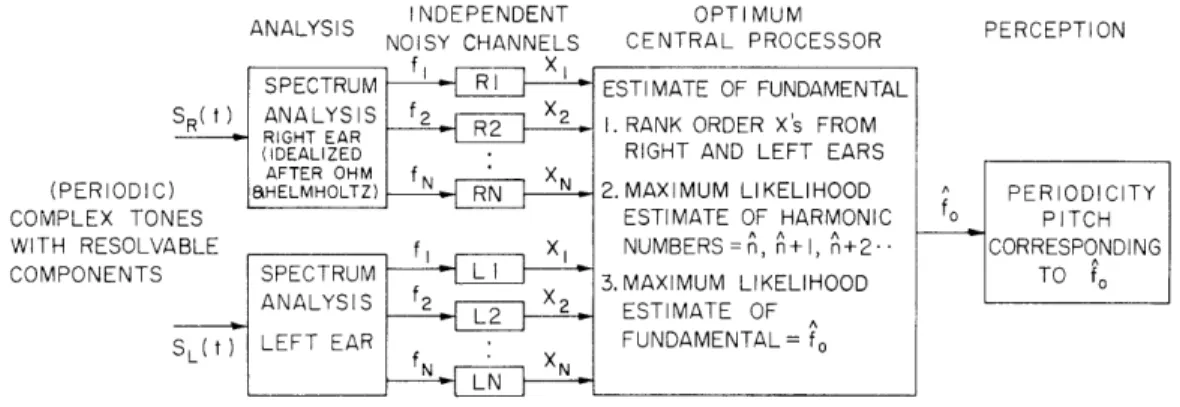
The heart of this theory is the hypothesis that a central processor makes an optimum
estimate of the fundamental frequency on the basis of a noisy representation of the
tonotopically organized stimulus (Fig. XXII-11).
The constraint on the central
proces-1
sor is that it presumes that all stimuli are periodic (Schouten, 1 de Boer?) with spectra
comprising only successive harmonics.
Both fundamental frequency
(fo)
and the
har-monic numbers (^, +1, h+2...
) must be estimated from the input to the processor.
This constraint is natural for the stimuli comprising two unknown successive harmonics
that were employed for our previously reported musical intelligibility experiments.
3This constraint is maintained as a property of the central processor even for stimuli
for which prior knowledge is incompatible, such as known harmonic numbers, or known
inharmonicity.
At present, the theory is restricted to complex tone stimuli. By hypothesis, the
central processor receives useful information from both ears only for spectral
compo-nents that are resolved by the aural spectrum analyzers.
Furthermore, it is
hypothe-sized that (within limits) only information on frequency of each component, but not
amplitude or phase, is preserved in this measurement.
Finally, it is hypothesized that
frequency information for each aurally resolved simple tone is degraded in independent
noisy channels.
These last three hypotheses, (i) aural frequency resolution, (ii)
reten-tion of only frequency informareten-tion for each resolved component, and (iii) independent
noisy transmission of the frequency information, reduce to one hypothesis, namely that
the component frequencies in the stimulus are represented at the input to the central
processor by independent stochastic signals.
The present theory is a strictly
mathe-matical development of the hypotheses of independent stochastic representations of
(XXII. COMMUNICATIONS BIOPHYSICS)
component frequencies and of optimum estimation of the fundamental.
Note in Fig. XXII-11 that the simple conception (ca. 1863) of aural frequency analysis invoked here is all that we need. In 1843, Ohm provided the conception of aural signal decomposition in accord with Fourier series. Helmholtz5 reminded us of
INDEPENDENT NOISY CHANNELS SPECTRUM 0 SR( t) ANALYS IS RIGHT EAR (IDEALIZED AFTER OHM f X ) HELMHOLTZ) RN ES ABLE fI X1 SPECTRUM ANALYSIS SL(t) LEFT EAR OPTIMUM CENTRAL PROCESSOR ESTIMATE OF FUNDAMENTAL
I. RANK ORDER X's FROM RIGHT AND LEFT EARS
2. MAXIMUM LIKELIHOOD ESTIMATE OF HARMONIC NUMBERS = , n+ , n+2 3. MAXIMUM LIKELIHOOD ESTIMATE OF FUNDAMENTAL= fo PERCEPTION PERIODICITY f0 PITCH CORRESPONDING TO fo
Fig. XXII-11.
Optimum processor theory of the central formation of the pitch of
complex tones. Idealized spectrum analyzers supply the
indepen-dent noisy channels with separate representations of each spectral
component in the stimulus.
Information on frequency of each
com-ponent, but not amplitude or phase, is conveyed stochastically to
the optimum processor.
The hypotheses of independent stochastic
representations of the component frequencies and of optimum
esti-mation of the fundamental are tested with psychophysical data.
the physical and psychophysical requirements for limited frequency resolution and gave
the first evidence for aural insensitivity to the phases of resolved components. (The
confounding role of aural combination tones
will be treated in a more complete
report.)
A second point is that the conception that the optimum processor operates on signals
representing the constituent frequencies of complex tone stimuli does not necessarily
imply the use of tonotopic or place information per se as the measure of
fre-quency.
For example, temporal periods of simple tones are not ruled out as
the measure of frequency. To emphasize that this formal theory does not require place
information per se, we assume that the frequency channels are not rank ordered or
labeled according to characteristic frequencies.
Thus the optimum processor must
measure the rank order from the frequency signals. In principle, the rank order
mea-sured from unlabeled channels could differ from that indicated by labeled channels.
In fact, however, this difference may be ignored because, from the quantification of the
stochastic frequency signals that emerges from this analysis, it is apparent that
negligible probability of incorrect rank ordering results from ranking the stochastic
samples of the frequency signals of interest.
(PERIODIC COMPLEX TON WITH RESOLVI COMPONENTS
(XXII. COMMUNICATIONS BIOPHYSICS)
2. Example of Central Processor Response
The stochastic signals xk impinging upon the central processor are taken as Gaussian with means fk and standard deviations ok . The standard deviation is the only
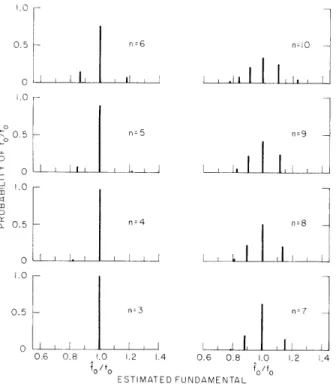
free parameter of the model. An example illustrating the salient properties of the opti-mum processor response is given in Fig. XXII-12. The stimulus is periodic, comprising two successive harmonics fl = nfo and f2 = (n+ )f o Combination tones are neglected. Both standard deviations are specified by ok/fk = . 01/.
Probability distributions of the central processor's estimate of stimulus fundamen-tal are given in Fig. XXII-12 as a function of the harmonic numbers in the stimulus.
The distributions are multimodal, each mode being approximately Gaussian with stan-dard deviation .5% of its mean. This compactness of each mode relative to the spacing between modes motivates the discrete representation in Fig. XXII-12. Errors by the central processor in estimating the harmonic numbers in the stimulus underlie the
0.5 n=6 0 .0 0.5 n 5 _o L-o n 0.5 n=4 A . I ! n=10 n=9 n=8 II 0.5 nz3 n 7 o 1 , I 0.6 0.8 1.0 1.2 1.4 0.6 0.8 1.0 1.2 1.4 fo ESTIMATED FUNDAMENTALo /f ESTIMATED FUNDAMENTAL
Fig. XXII-12.
Discrete probability distributions of the optimum processor estimate
of fundamental frequency, f o. The stimulus is periodic, comprising the successive harmonics f l=nfo and f = (n+ 1)f . The model param-eters are specified by O-k/fk = . 01/--. The distributions are multi-modal, each mode being approximately Gaussian with standard deviation .55% of its mean. Errors by the central processor in estimating the harmonic numbers in the stimulus underlie the mul-tiplicity of modes.(XXII. COMMUNICATIONS BIOPHYSICS)
multiplicity of modes. Schouten, Ritsma, and Cardozo7
gave the first empirical demon-stration of the multimodal nature of pitch responses to harmonic stimuli with harmonic numbers known (to the listener), thereby providing very important evidence for the relevance of the present theoretical approach.
3. Quantification of the Model Parameter o
k
A function of a single variable, ok = o(fk), (Fig. XXII-13) was found to give a respectable description of the musical intelligibility data reported previously,3
as
0.10
r-(--- EXTRAPOLATION BEYOND DATA)
b z o S0.03 0 0 0 z Z 0.01 0.003 0.10 0.30 1.0 3.0 10.0
FREQUENCY OF SIMPLE TONE COMPONENT, f(kHz)
Fig. XXII-13.
Relative standard deviations charac-terizing the precision with which fre-quency information from aurally resolved tones is communicated to the central processor. Theoretically derived from musical intelligibility data for three subjects.3
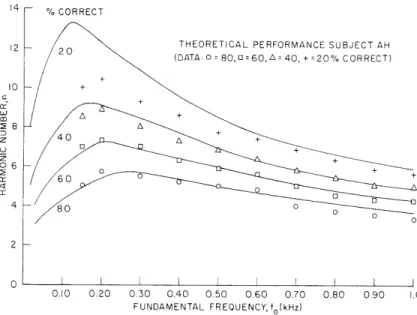
THEORETICAL PERFORMANCE SUBJECT AH
(DATA: 0 = 80,o=60,A40, + =20%CORRECT)
0.10 0.20 0.30 0.40 0.50 0.60 0.70 0.80 0.90 FUNDAMENTAL FREQUENCY, fo(kHz)
Fig. XXII-14. Theoretical and measured performance gibility experiment for subject AH.3
in musical
intelli-K
(XXII. COMMUNICATIONS BIOPHYSICS)
shown in Figs. XXII-14, XXII-15, and XXII-16. This theoretical result demonstrates that deterioration of musical intelligibility with increasing harmonic number is accounted for primarily by deterioration in the central processor's optimum estimation of har-monic number. It is unnecessary to attribute this deteriorating performance to a grad-ual failure of aural frequency resolution with increasing harmonic number. At some high harmonic number the failure of aural frequency resolution presumably blocks the
THEORETICAL PERFORMANCE SUBJECT NH (DATA:0 -80,0= 60 A= 40,+=20% CORRECT)
A~ +n
0.10 0.20 0.30 0.40 0.50 0.60 0.70 0.80 0.90 1.0
FUNDAMENTAL FREQUENCY,fo(kHz)
Fig. XXII-15. Subject NH, as in Fig. XXII-14.
12 - % CORRECT THEORETICAL PERFORMANCE SUBJECT SW
20 (DATA: o =80, 0=60, = 40,+=20% CORRECT)
0 +
O
0 2 0 I I [ 0I
0.10 0.20 0.30 0.40 0.50 0.60 0.70 0.80 0.90 1.0
FUNDAMENTAL FREQUENCY, fo(kHz)
Fig. XXII-16. Subject SW, as in Fig. XXII-14.
(XXII. COMMUNICATIONS BIOPHYSICS)
operation of the central processor.
4. Dominant Region
Ritsma8 demonstrated empirically that pitch changes in periodic signals comprising two successive harmonics are most noticeable when the harmonic numbers n and n+l are chosen in the 3-5 neighborhood. This phenomenon is predicted in the present theory by the discriminability of responses in the principal mode. Ritsma's data, together
6
D z 5 THEORY E RITSMA'S DATA
SSUBJECT SUBJECT AER=O
SUBJECT NH <a JH 0 O_4 NG=A 0 AH RR= o. Fig. XXII-17. 3
sw o ^ Dominant-region phenomenon for two-tone signal with frequencies nf and (n+1)f °
d 8 o0 0
2 <
Ritsma's
data are predicted by theopti-L,
Vmum processor theory.
0
0.050 0.10 0.20 0.50 1.0 2.0 FUNDAMENTAL FREQUENCY, fo (kHz)
with theoretical predictions using ac(f) from Fig. XXII-13, are shown in Fig. XXII-17. The theoretical optimum may be understood as the interaction of two opposing ten-dencies with changing harmonic number. For fundamentals below approximately
500 Hz higher harmonic numbers benefit from increased precision (lower 0o/f, see Fig. XXII-13); however, central estimation of harmonic numbers deteriorates with increasing harmonic number. Hence Ritsma' s dominant-region phenomenon need not imply the presence of a special mechanism that enhances information from a particu-lar spectral region, as might be associated with the operation of spatial filtering on aural tonotopic patterns.
A more complete report is in preparation.
References
1. J. F. Schouten, "The Perception of Pitch," Philips Tech. Rev. 5, 286-294 (1940), N. B. p. 294.
2. E. de Boer, "On the Residue in Hearing," Doctoral Thesis, University of Amsterdam, 1956.
3. A. J. M. Houtsma and J. L. Goldstein, "The Central Origin of the Pitch of Complex Tones: Evidence from Musical Interval Recognition," J. Acoust. Soc. Am. 51, 520-529 (1972).
(XXII. COMMUNICATIONS BIOPHYSICS)
4. G. S. Ohm, "Ueber die Definition des Tones, nebst daran gekniipfter Theorie der Sirene und ihnlicher tonbildender Vorrichtungen," Ann. Phys. Chem. 59, 513-565 (1843).
5. H. L. F. von Helmholtz, "Die Lehre von den Tonempfindungen als physiologische Grundlage fir die Theorie der Musik" (F. Vieweg und Sohn, Braunschweig, 1863). English Translation: On the Sensations of Tone (Dover Publications, Inc. , New York, 1954).
6. J. L. Goldstein, "Auditory Nonlinearity," J. Acoust. Soc. Am. 41, 676-689 (1967). 7. J. F. Schouten, R. J. Ritsma, and B. L. Cardozo, "Pitch of the Residue," J. Acoust.
Soc. Am. 34, 1418-1424 (1962), N. B. Figure 6.
8. R. J. Ritsma, "Frequencies Dominant in the Perception of the Pitch of Complex Sounds," J. Acoust. Soc. Am. 42, 191-198 (1967), N. B. pp. 195-197 and Table I.