HAL Id: hal-03132547
https://hal.inrae.fr/hal-03132547
Submitted on 25 Feb 2021HAL is a multi-disciplinary open access
archive for the deposit and dissemination of sci-entific research documents, whether they are pub-lished or not. The documents may come from teaching and research institutions in France or abroad, or from public or private research centers.
L’archive ouverte pluridisciplinaire HAL, est destinée au dépôt et à la diffusion de documents scientifiques de niveau recherche, publiés ou non, émanant des établissements d’enseignement et de recherche français ou étrangers, des laboratoires publics ou privés.
Slaughter cattle to secure food calories and reduce
agricultural greenhouse gas emissions? Some prospective
estimates for France
Pierre-Alain Jayet, Ancuta Isbasoiu, Stéphane de Cara
To cite this version:
Pierre-Alain Jayet, Ancuta Isbasoiu, Stéphane de Cara. Slaughter cattle to secure food calories and reduce agricultural greenhouse gas emissions? Some prospective estimates for France. Review of Agricultural, Food and Environmental Studies, Springer, 2020, 101 (1), pp.67-90. �10.1007/s41130-020-00117-9�. �hal-03132547�
Slaughter cattle to secure food calories and reduce agricultural greenhouse gas emissions?
Some prospective estimates for France
Abstract
We assess the potential for increasing the net amount of food calories produced by French agriculture and the possible implications in terms of greenhouse gas emissions and agricul-tural area allocation. This analysis is based on an agriculagricul-tural supply model for the European Union mainly with regard to arable crops, meadows, fodder crops and the main animal prod-ucts. The model calculates the variations in agricultural greenhouse gas emissions associated with the required level of production. Within the framework of a prospective approach carried out under the technical and economic conditions of the period 2007-2012, we calculate the extent of the changes in an agricultural production system, to which we assign the objective of increasing the net production of calories. In France, for an increase of 40% to 60% depend-ing on the year, three-quarters of meadows would disappear, a large proportion of temporary meadows would switch to cereals, and fallows could exceed 20% of the total agricultural area. These changes would result from the sharp fall in livestock, especially of cattle for meat. The key factor in the analysis is animal feed, which, in addition to the decrease in grass consump-tion, would lead to a slight increase in fodder and cereals produced and consumed on the farm, and a sharp decrease of around 50% in the purchase of concentrated feeds. The reduction in greenhouse gas emissions is substantial, at least in terms of methane, and could exceed 30% of reference emissions in carbon dioxide equivalent.
Keywords: Food calories; Agricultural production; Livestock and feed; Greenhouse gas emissions; Mathematical programming model
1
Introduction
The trade-offs implied by growing food demand and the need to preserve the environment are central to the problem we propose studying. In view of the multifaceted nature of the problem we restrict our analysis to the agricultural and animal production sector and to greenhouse gas emissions. Agricultural production is under pressure from evolving demand, to the detriment of meat products, at least in the European Union for a segment of the population. Changes in the eating habits of certain consumers contribute to modifying the entire food production chain and, ultimately, affect the demand for agricultural products. The entire agricultural production system is therefore faced with contrasting changes in terms of plant and animal production. At the same time, the supply of food calories needs to keep pace with rising global demand, driven by the increasing global population and changes in standards of living. To what extent is the agricultural sector able to satisfy this additional demand? Within the European Union, in particular in countries such as France where the agricultural sector is sizable, answering this question is important for assessing the capacity to seize potential new market opportunities, as well as within the perspective of securing food production. Because of the profound changes in the agricultural sector potentially involved, it is essential also to assess the associated environmental impacts, which are at the core of the concerns regarding agricultural policy.
As long as animal or plant-based calories are nutritionally substitutable, there is an interest in estimating the potential for net production of edible calories. This potential must obviously include uses other than human food, especially animal feed. Goods competing directly with human nutrition include cereals that are consumed directly on farms or consumed indirectly in the form of industrial feeds. Prospective studies have addressed the issue of radical changes in behavior that make the current production system compatible with the nutritional needs of the population
(Berners-Lee et al. 2018). It is also relevant to study to what extent adaptation of the current production system could meet increasing nutritional needs.
Changes in diet –in terms both of composition and total quantity– will weigh on agricul-tural production, resource use (water, land), and the environment (Aleksandrowicz et al. 2016), with consequences for agricultural and environmental policies (Beddington et al. 2012). In partic-ular, the impacts of dietary changes on food-related greenhouse gas emissions have been increas-ingly addressed in the literature (Smith et al. 2013;Bajzelj et al. 2014;Springmann et al. 2016,
2018).
This literature has highlighted the key role of animal products (Herrero et al. 2013;Brent
et al. 2019), in particular with respect to their link with agricultural GHG emissions (Thornton
2010;Weiss & Leip 2012;Leip et al. 2014). According toSpringmann et al.(2016), compared to
a baseline scenario in 2050, food-related greenhouse gas emissions could be reduced by 29-70% (3.3 to 8 GtCO2eq) through increasingly plant-based diets and less animal-sourced foods.Hedenus
et al. (2014) show that partially replacing animal products with cereals or pulses and ruminant
meats with other meats could reduce food-related GHG emissions by 3.4 to 5.2 GtCO2eqby 2050,
and by approximately 2 GtCO2eq more in the event of technical mitigation in the agricultural
sector. According toBajzelj et al.(2014), if dietary recommendations were adopted on a global scale, the reduction in GHG emissions projected in 2050 would be from 5.8 to 6.4 GtCO2eq, while
Tilman & Clark(2014) estimate a reduction of 4.2 to 8.4 GtCO2eqby switching to diets based on
vegetarian, Mediterranean and fishery products. Westhoek et al.(2014) find that halving animal production would lead to a significant reduction in greenhouse gas emissions (around 25-40%) and a decrease of 40% in nitrogen emissions. Doing so would also make the EU a major exporter of cereals. A diet containing fewer meat products is often put forward as a way of reducing GHG emissions. According toBryngelsson et al.(2016), in order to meet the EU 2050 climate targets, massive reductions in beef consumption are essential, whereas high consumption of pork and poultry is still feasible. Tukker et al. (2011) argue that major dietary changes in meat and milk consumption are needed to have a significant impact on GHG emissions. More broadly, it is argued that agricultural consumption and production patterns need to change in order to mitigate environmental externalities. ForBurney et al. (2010) intensification of production is a way of reducing GHG emissions, although forValin et al.(2013) this is debatable. The specific role of grasslands and livestock has been raised when addressing the issue of climate change (O’Mara
2012;Röös et al. 2017). According to O’Mara(2012), in addition to contributing significantly
to food security through their role in the feeding of ruminants, grasslands could contribute up to 1.5 GtCO2eq to the overall mitigation potential of 5.5 to 6 GtCO2eqin 2030. Some analyses
emphasize the need to preserve grasslands (Aubert et al. 2019), while others highlight the need for animal protein for human consumption (Van Kernebeek et al. 2016).
In this paper, we approach the question from a different angle than the one commonly used in the literature. Instead of studying the reduction in animal production needed to mitigate GHG emissions, we focus on how the current agricultural system can deliver a given increase in the total supply of net food calories.1 As animal production is less calorie efficient than plant-based production, this implies a shift from animal-plant-based to plant-plant-based agricultural activities. The supply-side model used to carry out this analysis enables us to assess the potential of production that could simultaneously allow (i) changes in the allocation of agricultural land between the various activities, (ii) substitution between the different animal feed sources and (iii) adjustment of the animal capital. We also investigate the extent to which increased dietary calorie production is conducive to lowering GHG emissions, in particular making a distinction between the two major agriculture-related gases, methane (CH4) and nitrous oxide (N2O).
The model used in this article has the advantage of providing the marginal cost of pro-ducing one extra food calorie as the shadow price attached to the constraint that sets total level of production. This implicit price of the food calorie offers a synthetic measure of the economic
capacity of the current system to increase the net calorie content of agricultural production. The analysis focuses on the French agricultural sector. However, the link that can be made between the marginal increase in caloric production in France and the marginal increase at the Eu-ropean level is addressed through the quantitative relationship between calorie production and the marginal cost of production at both national and European scales. The system studied is therefore geographically well defined. We study its capacity to increase its net calorie production limited to direct inputs and outputs, just as we calculate the direct greenhouse gas emissions induced by the net production of food calories. The domestic or foreign nature of the flows of inputs and outputs as well as the virtual GHG emissions induced by these exchanges are not part of the analysis.
For the analysis, we use the AROPAj agricultural model. The model describes the techni-cal and economic conditions of production on the supply-side and the microeconomic choices of a set of price-taker farmers. Prices are thus exogenous. Inter-annual variability (e.g. due to weather variability) which, in addition to prices, affects the agricultural production sector is taken into ac-count by calibrating and running the model separately over several years of observation. From a technical standpoint, the model, which is based on a set of independent models of representative farm groups, involves maximizing the joint gross margin of all the representative farm groups by adding a satisfaction constraint of a given level of net production of calories. The balance of calo-ries produced includes the main crops grown in France, as well as milk and meat production. with all production counted in “out-of-farm” quantities (i.e. not processed). A small number of sales crops (e.g. tobacco and flax) are not taken into account in the balance sheet, or rather they are “neutral” in the same way as fodder and the quantities of cereals directly allocated on the farm to animals. The quantities of industrial concentrated feed are counted negatively.
It is important to note that this type of analysis is prospective, and in no way predictive, as it is based on a specific and limited scenario and on the assumption that the current economic and physical environment remains unchanged. Even when there is no endogenous price feedback (due to a significant change in goods supply) or climate feedback (due to a significant change in GHG emissions), the variability of the situations over the observed years makes the analysis robust. The values of economic and technical parameters are realistic and are based on large-scale observations covering a wide variety of production systems.
Our findings underscore the key role of animal feed. They also show that animal pro-duction, in particular beef, is the most sensitive to a change in the net food calorie requirement. France has less capacity to increase caloric production than the EU average, since from the outset it has a larger net caloric balance. It is therefore more expensive for France to increase its level of calorie production, and its potential for increase is lower (30% against 120% for the EU as a whole). Animal production is penalized as the level of calories produced is high, mainly for cereal production. This is because animals need feed that comes partly from outside the farm and be-cause they generally produce fewer food calories than they consume. Land allocation follows this trend with a sharp decline in grassland, an increase in field crops, and the emergence of fallow land at a potentially high level. The net calorie deficit in regions where cattle production is predomi-nant and where, correlatively, there are large areas of grassland, would result in their agricultural activity ceasing. These results clearly stem from the fact that the model only takes into account the activities present in their initial state in each of the farm groups. Finally, it is shown that, for France, methane emissions could be significantly reduced (up to 50% for the highest level of net production), whereas direct emissions of nitrous oxide would vary little (less than 10%).
2
Material and methods
After presenting the model and its extension as a particular mode in its use, we describe the scenarios and assumptions used for the simulations. The input data and the categories of expected results are then briefly presented.
2.1 Model
Quantitative results analyzed in the article are based on the European agro-economic model AROPAj (seeDe Cara & Jayet (2011),De Cara et al. (2018) andJayet et al. (2019) for a more comprehensive presentation). AROPAj is a supply-side model in the category of mathe-matical programming models with a linear basic structure.
The AROPAj model represents the behavior of economic agents represented by farms, or more specifically groups of farms (hereafter called farm types or farm groups), that have simi-lar characteristics and are derived from a clustering method applied to individual farm samples originating from the Farm Accounting Data Network (FADN), in accordance with four variables –FADN-defined types of farming, altitude, presence of irrigation and FADN-normalized economic size– in every FADN region. The current version of the model is calibrated against six sets of an-nual FADN data, which are taken as six realizations of the economic situation. Each of the years 2007-2012 leads to the delineation of the EU agricultural sector in year-based independent sets of farm groups (from 1747 to 1993 farm groups depending on the year).
The generic form of the model is represented by maximizing the gross margin (πk) of farm
group k against the plant and livestock sourced supply and the input demand: maxxk πk(xk, θk, φ )
s.t.xk∈Ak(θk, φ )
xkconstituting the vector of activities for farm group k, (e.g. the area of each crop, the number of
animals in each category, the production of meat and milk). The overall production at the k-farm level is limited by the constraints referring to the production setAkwhich relates to a Akmatrix in
our basic linear programming framework. The vector θk concerns k-specific parameters, and the
vector φ refers to common parameters such as policy tools.
Among the main constraints, we specify those of crop rotation, the availability of utilized agricultural area, the nitrogen balance at the crop plot level when the yield requires inputs of min-eral or organic nitrogen, animal feed requirements, the demographic balance between age groups, sexes and milk or meat-oriented production (only detailed for bovines) and the implementation of the Common Agricultural Policy instruments.
The flexibility of livestock numbers plays an important role in the analysis, together with changes in animal diet. The model allows the number of animals to vary within a set interval. More specifically, for certain categories of animals that can be directly associated with the "quasi-fixed" capacities of the farm (i.e. livestock buildings), the numbers may vary according to a fixed proportion of the reference population (y0). Formally, these numbers (y) vary so that |y−y0| < d y0,
dbeing the livestock adjustment rate (LVA) that is chosen.
Note that permanent grasslands are not included in rotational constraints. These may, however, vary with fodder areas and herbivore numbers, and they may vary in replacement of fallows. More generally, any kind of activity area may be replaced by fallow, and vice versa. These potentially significant changes due to the flexibility of the model are, however, limited by the fact that changes in the structure of farms are not included. Thus the model allows a large increase or decrease in an activity, or even its cessation, but it does not allow the emergence of an activity not initially present. With regard to farming systems and the link with meadows, it should be recalled that the reversal of meadows is inherently difficult in many regions, and that it is also contrary to the recommendations of the Common Agricultural Policy (CAP).
In our scenario, with regard to the Common Agricultural Policy, we opt for an extensive decoupling scheme in which direct payments are based on area whatever the activity. In other words, there is no distortion between land uses due to public policies when we focus on the tech-nical and economic capability to provide food calories.
When we take into account constraints that combine several or all farm groups simultane-ously, and if we want to achieve a common goal in terms of dietary calories, the model is used in
aggregate mode: maxxk
∑
k πk(xk, θk, φ ) ∀ k xk∈Ak(θk, φ )∑
k bkxk≥ Qcal (ρ)where xk variables are weighted by bk in their contribution to the net balance of food calories
produced, and Qcal is the amount of food calories expected from the farming systems considered. We denote by ρ the shadow price related to the Qcal calorie limit.
There are three main types of lever for adjusting production and substituting between production activities when the level is imposed on the production system as a whole:
– Intergenerational changes in the cattle population: as well as the range of relative variation left to the herd, the implicit cost of animal feed can lead to a change in the age at which animals are slaughtered in each age class (calves under one year of age, young males and females one to two years of age, heifers and oxen, and cows).
– Substitution between the feeds taken into account, namely (i) cereals produced and con-sumed on the farm, (ii) fodder produced from meadows and forage areas, and (iii) one cat-egory of bought raw feed and four categories of bought concentrated, simple or compound feed, rich in energy or protein. Concentrated feed is counted negatively in the balance of food calories produced, while cereals and fodder produced on farms are neutral in this bal-ance.
– Adjustment of net production of food calories between representative farms: the optimal so-lution associated with a level of calories produced for all farms is such that the marginal cost of production is the same for all farms, but the individual contribution to calorie production varies from farm to farm.
2.2 Scenarios
The concept of scenario is here associated with the parameters of the AROPAj model likely to vary in the simulations carried out and the way in which these parameters evolve. We focus the analysis on two parameters, namely the level of net production of dietary calories, and the rate of adjustment of animal capital, which is common to the animal categories concerned for all farm groups.
In more detail, the simulations will be carried out as follows:
– We vary the level of net calorie production from the benchmark level and increase it until the model (i.e. optimization program) fails to find a solution. The maximum level thus achieved represents the potential for net production of calories in a physically realistic (un-der the prevailing technical conditions) and economically rational way (from the standpoint of maximizing the gross margin under the economic conditions initially observed).
– We take four levels of livestock adjustment (LVA: 5, 15, 25 and 35%), recalling that this relates to the amplitude of variation of four bovine categories out of 21 (i.e. dairy cows, slaughtering cows, 18-month and more than 2-year-old beef) and the categories of sheep, goat, pork and poultry.
LVA refers to the exponential rate of variation of the herd relative to the initial value for a given category. This rate is hypothetically identical for the eight categories concerned and for all the farm groups modeled.
Note that the adjustment of animal capital may result in a lower or higher effective rate of change, depending on the categories of animals and farm groups. This rate may be lower than the rate chosen, for example for dairy cows under the effect of milk quotas. It may be higher for other
bovine categories, with the possibility of exiting the animals at a younger age (by increasing the sale of calves and reducing the sale of bulls and/or oxen).
Even though the model allows us to constrain the amplitude of surface variations by type of activity, we opted for flexibility. The area of permanent meadows can therefore vary under the standard constraints of the model. In fact, this flexibility works realistically in mixed animal and plant production systems. When the demand for food calories becomes high, the optimal solution proposed by the model results in a sharp decline in permanent pastures and herd size for extensive livestock systems. Even when there is no alternative to animal production, the mere fact that animals may need nutrients from concentrated food leads these "net negative calorie" systems to significantly reduce their activity by decreasing the number of cattle on the farm. Given the structure of agricultural land in the model, which is not based on a geographical distribution of plots but on the endowment in useful agricultural area for farm groups, the apparent transformation of meadows into fallow is the net sum of land reallocation between meadows, crops and fallow. At the same time, since meadows are closely linked to the presence of herbivores, the rigidity of the model automatically amplifies the shift from meadows to fallows when the herd decreases.
Scenarios are presented for each of the six years of calibration of the AROPAj model (2007 to 2012), even though we mainly use the results for the three years 2010-2012. The simulations are all based on the joint maximization of the gross margin of the farm groups, for the European Union on the one hand and for France on the other.
2.3 Data
Inputs
The parametrization of AROPAj is largely based on individual data from the European FADN. One of the use conditions is that no FADN-based parameter may mobilize fewer than 15 individuals in the sample. The use of FADN is therefore limited to the classification of individuals into farm groups and the pre-estimation of parameters. The model also draws on technical data (mainly related to the nutritional needs of animals and the energy content, proteins and dry matter of feeds). In areas of realistic physical values, adjustment of some of the technical parameters and pre-estimated parameters from the FADN is performed during the calibration phase of the model. All these operations are detailed in a free online access document (Jayet et al.(2019)).
Greenhouse gas emissions are calculated following the Intergovernmental Panel on Cli-mate Change (IPCC) guidelines. The eleven emission source groups considered in the AROPAj model are: (i) N2O emissions from agricultural soils, subdivided into: direct emissions –use of
synthetic fertilizers, manure application, biological N fixation, crop residues and animal production– and indirect emissions –atmospheric deposition and leaching and run-off; (ii) N2O emissions from
manure management; (iii) CH4 emissions from manure management, (iv) CH4 emissions from
enteric fermentation and (v) CH4emissions from rice cultivation (seeDe Cara et al.(2005);IPCC
(2001)). The emissions calculation module is based on the values updated by the IPCC in 2005 and 2011. In a more detailed overview, the AROPAj GHG block is delineated into 20 tiers, following the guidelines of the IPCC (see TableA.2).
As for carbon storage, we will refer to external information when we need to assess the impacts of land allocation change on carbon storage in the soil. All figures on GHG emissions are estimated in metric tons of CO2equivalent (tCO2eq) and based on the global warming potential of
the two gases as revised by the IPCC, which is 298 for N2Oand 25 for CH4(metric tons of CO2
per metric ton of gas) over a time-period of 100 years.
Data related to dietary calorie intake are based on values from FAO reports. They are reproduced in TableA.3. The results relating to the estimates of the amounts of dietary calories are expressed in metric tons of soft wheat equivalent (tsweq).
Outputs
We extract some of the outputs of the AROPAj model from the standard file containing the optimal solution (from 1800 to 2700 primary and dual variables depending on the farm groups). This mainly concerns areas, placing them in six groups: cereals (durum wheat, soft wheat, barley, maize, rye, oats, other straw cereals, rice), oilseed crops (rapeseed, sunflower, soya), fodder (corn, beet, protein crops), grasslands (permanent and temporary), fallows (equivalent to unused agricul-tural land, set-aside being no longer relevant), and industrial crops (sugar beet, potatoes, cotton, tobacco).
In terms of production, we mainly consider the production of seven straw cereals, distin-guishing between (i) the share collected and intended for non-farm food or non-food uses, and (ii) the proportion directly consumed on the farm for animal feed. We also consider the quantities of concentrated feed for livestock, which has a strong impact on the net balance of dietary calories produced. Estimates of greenhouse gas emissions are given for each of the two gases (methane and nitrous oxide).
As regards “ dual ” variables, we retain the one that is associated with the net quantity of food calories required from the production system as a whole (European, but especially French). For a given value of the dual price, all production systems adjust their calorie production by equalizing their marginal cost of production at this price. This result clearly remains valid whatever the aggregation level of the farm groups implemented, especially the national level. On the other hand, an identical additional effort in relative terms will entail different marginal costs. And the potential for relative increase will in principle be very different from one group to another and from one country to another.
The net level of calory supply in the reference situation is a useful indicator in this regard. Table1shows the number of farm groups with a negative initial caloric balance for the EU, France and Ireland (two countries with contrasting agricultural typologies). The number of farm groups with a negative net food calorie production situation is a reducing indicator. For example, for France in 2010, 38% of the farm groups in this situation correspond to 35% of the 235,000 farms represented in the model and to 19% of the 23.5 million hectares of UAA. The deficit in food calories attributable to them represents 29% of the net balance in food calories. In any case, the large proportion of farm groups with negative caloric production –in fact almost all farm groups specialized in animal production have a net negative caloric production– shows that the European livestock systems are not self-sufficient: almost all of them rely on external caloric feed inputs which are larger than their total caloric output.
Table 1. Number of AROPAj farm groups with negative net calorie production in the reference-year situa-tion (against total number of farm groups).
2007 2008 2009 2010 2011 2012 EU 673 552 619 686 627 689 (1798) (1747) (1802) (1901) (1910) (1993) France 75 53 52 63 52 62 (164) (159) (157) (164) (169) (170) Ireland 16 15 15 13 15 14 (20) (19) (18) (17) (20) (18)
Note that the number of farm groups is related to the diversity of the systems sampled in the FADN (in particular according to the “economic dimension” of these systems), and has little or no relation to the utilized agricultural area. In addition, the AROPAj typology is constructed completely independently from one year to the next. But the diversity of production systems is generally well represented over the years.
3
Results
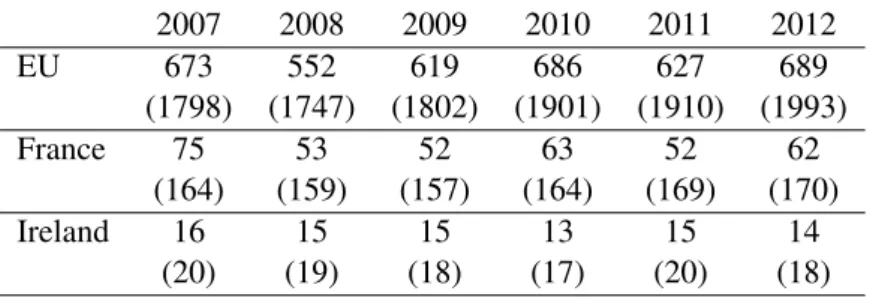
Under the current technical and economic conditions, by limiting the LVA to 25%,France considered in isolation could increase its net production of dietary calories by 40% on average (with gains from 55 to 75 Mtsweq, or from 75 to 110 Mtsweq, depending on the year),while the EU
as a whole could more than double it (result shown on the x-axis, Figure1).
This finding reflects the fact that since France starts from a more favorable situation, it is more expensive to provide an additional effort in this direction. Inter-annual variability is relatively large, and reflects the weather and economic conditions, which vary significantly over the period. In addition, the marginal cost of producing calories for the EU as a whole increases relatively slowly with the level of production required from European farms until the target approaches twice the reference production. Evaluated in monetary units per ton of common wheat equivalent, this doubling is achieved at a marginal cost close to half the price of common wheat paid to the producer. The loss of gross margin would be around 5%. It is possible to reach a a higher level target (at most around 2.5 times the reference value), but at a marginal cost fifteen to twenty times higher than the price of wheat. For France, which would be associated with its own calorie production target, the increase in the target for the same moderate level of the marginal cost of production would be around 35% of the reference production level.
200 250 300 350 400 450 500 550 calories Mtsweq 0.2 0.4 0.6 0.8 1.0 shadow price 1000€/t EU-27 (25% LVA) 60 70 80 90 100 110 calories Mtsweq 0.2 0.4 0.6 0.8 1.0 shadow price 1000€/t France (25% LVA)
Figure 1. Shadow prices associated with food calorie production when varying at the EU level (left) and the
France level (right), for the six years: 2007 2008 2009 2010 2011 2012.
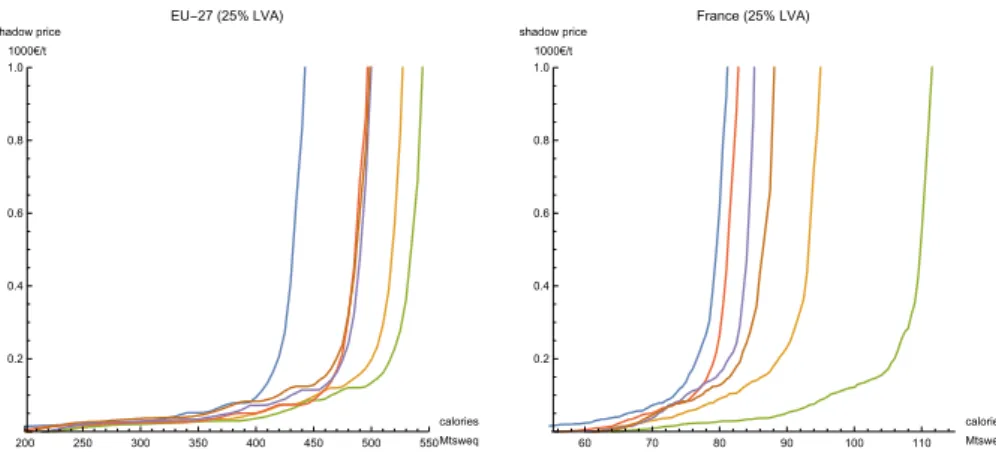
To facilitate representations and better analyze the complexity of the technical and eco-nomic processes involved, we use the three years 2010-2012 (2009 appears atypical in quantitative terms, although keeping the same qualitative aspect). Also note the results for a marginal cost of calorie production of 150 AC/tsweq, chosen to be comparable to the average price of soft wheat
observed over the period (Figure2).
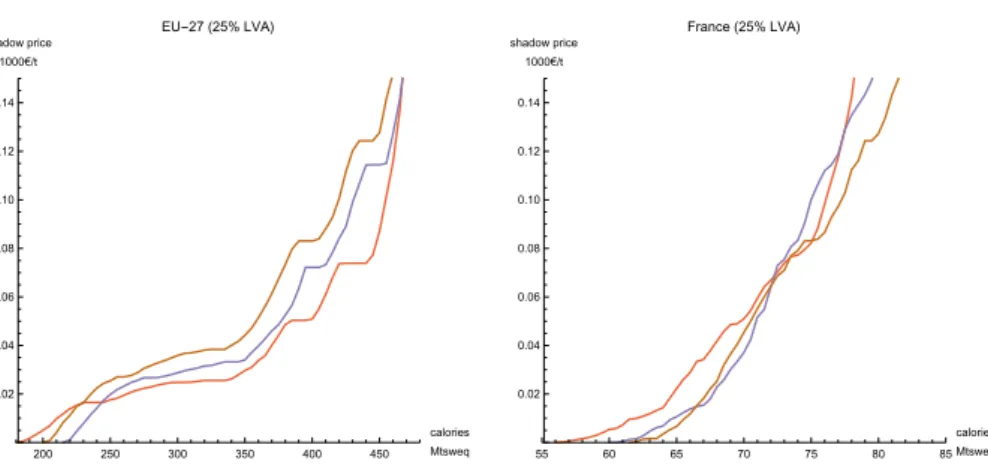
For a given dual price, the level of production of calories and the solution leading to them are clearly identical, whether we analyze the optimal response of France in isolation with a national objective or whether France is considered within the European Union with a European objective. But given that marginal cost curves are different for France and for the EU, Figure3 illustrates the gap between what the EU can offer and what France can offer when the marginal cost varies. This is particularly the case when the EU continues to significantly increase the level of calorie production, over the interval between 250 and 350 Mtsweq, while France remains between 65 and
68 Mtsweq depending on the year.Below and above this threshold, the variation in production in
France is correlated with that of the European Union. These results are a reminder of how countries differ in terms of their agricultural production systems, and how large the economic gain can be from coordinating production objectives between EU countries. We would have the same type of results at the regional level. Compared to the rest of the EU, it therefore appears to be a costly
200 250 300 350 400 450 calories Mtsweq 0.02 0.04 0.06 0.08 0.10 0.12 0.14 shadow price 1000€/t EU-27 (25% LVA) 55 60 65 70 75 80 85 calories Mtsweq 0.02 0.04 0.06 0.08 0.10 0.12 0.14 shadow price 1000€/t France (25% LVA)
Figure 2. Shadow prices associated with food calorie production when varying at the EU level
(left) and the France level (right) - Focus when shadow price lower than 1AC/kgsweq for the years:
2007 2008 2009 2010 2011 2012 .
obstacle to overcome when France needs to increase the production of food calories above 65 Mtsweq. 200 250 300 350 400 450 500 EU calories (Mtsweq) 55 60 65 70 75 80 85 90 France calories (Mtsweq) (25% LVA)
Figure 3. Net calorie production (in Mtsweq) produced by France when France either coordinates with the
rest of the European Union or acts alone, given the year:2007 2008 2009 2010 2011 2012 .
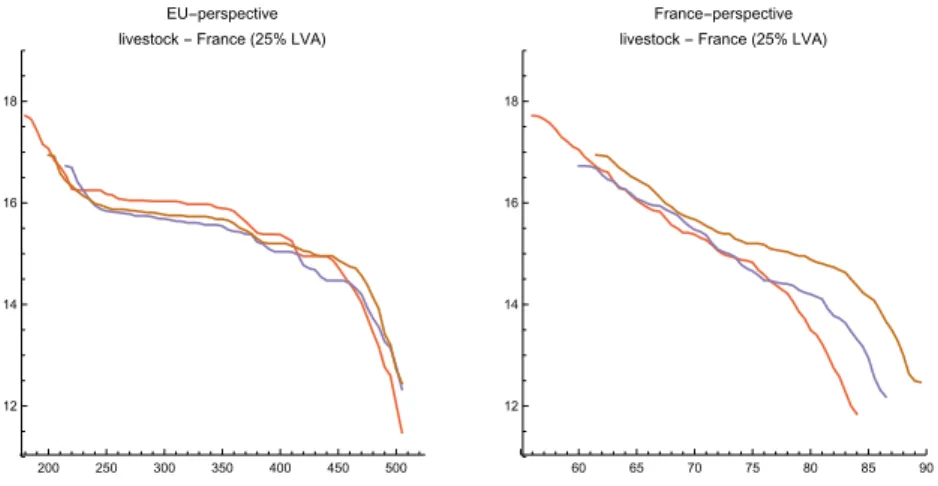
Figures 4 and 5 show how animal production and grasslands change when the calorie production target increases, always distinguishing France taken in isolation and France within the EU. We find the level highlighted in Figure3. Because of the structure of its agriculture, which is more oriented towards crop production than animal production compared to the average of EU member states, France faces a more costly effort for a given gain in caloric production. Whereas in the initial situation it produces more than 25% of net calories in the EU, its share in the highest production drops to 18% due to an initially lower proportion in animal production than in the rest of the EU.
Overall, the increase in the level of calories produced is made possible mainly by the decrease in animal production consuming food in competition with human food. Regions oriented towards animal production – Brittany in France, and Ireland or the Netherlands in Europe – are therefore strongly affected. If the EU were to set very high targets for net food calorie production,
200 250 300 350 400 450 500 12 14 16 18 EU-perspective livestock - France (25% LVA)
60 65 70 75 80 85 90 12 14 16 18 France-perspective livestock - France (25% LVA)
Figure 4. Change in livestock numbers (millions of livestock units) in France, considering the change in the dietary calorie production at the EU scale (left) and at the France scale (right), given the year:
2007 2008 2009 2010 2011 2012 (x-axis refers to the level calorie production expressed in Mtsweq).
200 250 300 350 400 450 500 2000 4000 6000 8000 EU-perspective grasslands - France (25% LVA)
60 65 70 75 80 85 90 2000 4000 6000 8000 France-perspective grasslands - France (25% LVA)
Figure 5. Change in grassland area (thousands of hectares) in France, considering the change in
the dietary calorie production at the EU scale (left) and at the France scale (right), given the year:
2007 2008 2009 2010 2011 2012 (x-axis refers to the level calorie production expressed in Mtsweq).
this could result in grasslands being abandoned and fallows emerging. Given the weight of animal feed in the caloric balance, it is better to reduce animal production even when there is no alternative agricultural production. Geographical considerations show the importance of the distribution of effort, from region to region within a country, and between different Member States within the EU.
The importance of the role of animal production for increasing calorie production is also demonstrated through geographical analysis of changes in the allocation of agricultural land, as illustrated by the maps in Figure6. The sharp decrease in grassland is partly offset by an increase, where possible, in the areas under crops. But the proportion of land in growing cereals may sometimes decrease or increase only very slightly in breeding and polyculture breeding areas. This situation reflects the significant role of cereals produced and directly consumed on the farm. As explained above, in the model, adjustments in response to satisfying an increasing demand for calories can be made at several levels, by an internal adjustment of bovine demography for livestock farms, and by a modification of feed sources when possible. For example, if forage crops offer higher yields than grasslands, even though they are more expensive, this may be enough to change the allocation of land. When there is no substitution activity (on farms specializing in animal husbandry), the feed consumed comes from outside the farm in the form of concentrates
purchased, which are counted negatively in terms of net calories. As a result, the size of the herd decreases, as does the demand for feed, and ultimately, the areas of meadows and fodder (replaced in this case by fallow land). These effects translate into virtual transfers of calories produced between farms and therefore between regions, since, on a given scale (France in this case), the marginal cost of the last calorie produced is balanced from one farm to another. The sharing of effort between farms means that variations in land allocation and in the size of herds on farms are all the more complex and significant the greater the effort required.
0.0 0.1 0.2 0.3 0.4 0.5 0.6 0.7 0.8 0.9 1.0
Figure 6. Change in regional average share of the area dedicated to cereals (left) and grasslands (right)
from 2012-based starting situation providing 200Mtsweq(top) to the 2012-based situation with production
of 500Mtsweq(bottom).
Land allocation in France is analyzed in more detail for activities categorized into six groups: (1) cereals, (2) oil-protein crops, (3) “industrial” crops (sugar, potatoes, tobacco, etc.), (4) forage, (5) permanent and temporary grassland, (6) fallows (Figure7).
Between the initial situation and the maximum possible level in food calorie production, the increase in cereal area is notable in hectares and growth rate (between 2.5 and 3Mha, +30%). The increase for industrial crops is significant in terms of rate (40%), though applying only to smaller areas, while oil-protein production tends to slightly decrease, as long as the target level of production of calories in France does not increase by more than 20%. For all these activities, there is either an acceleration or a reversal of the trend when the required level of net food calorie production increases by more than 20%. In particular, forage evolution is reversed, with fairly large areas involved.
Changes in grassland and fodder area show that the net caloric intake is highly dependent on animal feed. The analysis of changes in animal feed is complemented by studying the evolution
55 60 65 70 75 80 85 90 9500 10 000 10 500 11 000 11 500 cereals 55 60 65 70 75 80 85 90 2500 2600 2700 2800 2900
oilseeds & proteins
55 60 65 70 75 80 85 90 600 700 800 900 1000 1100 1200 1300 industrial crops 55 60 65 70 75 80 85 90 1600 1800 2000 2200 2400 fodders 55 60 65 70 75 80 85 90 2000 4000 6000 8000 grasslands 55 60 65 70 75 80 85 90 0 1000 2000 3000 4000 5000 fallow
Figure 7. Change in area sharing within utilized agricultural area (1000 ha) when the
calorie production target increases,given the livestock adjustment rate (25%) and the year:
of cereal production and the proportion of this production directly consumed by animals. At the same time, we study the evolution of ingested quantities of industrial concentrated feed (mainly from cereals produced in Europe). Figure8summarizes this shift.
55 60 65 70 75 80 85 90 55 60 65 70 75 marketed cereals 55 60 65 70 75 80 85 90 4 6 8 10 12 on-farm (cereals) 55 60 65 70 75 80 85 90 15 20 25 30 concentrated feed
Figure 8. Change in cereal production, on-farm re-use of cereal production and industrial concentrated feed (Mt) when the calorie production target increases, given the livestock adjustment rate (25%) and the year:
2007 2008 2009 2010 2011 2012 (x-axis refers to the level calorie production expressed in Mtsweq).
A more detailed analysis of the simulation results shows that the altered evolution ob-served when close to the maximum achievable amount of calories is linked to milk production. Milk production would hold up better than other animal production (beef, pork and poultry), since it is partly protected by the remunerative system of milk quotas of the CAP, which is kept op-erational in our simulations. As already mentioned, cereals intended for the market are counted positively in the calorie balance, while cereals produced and used on the farm are counted as neu-tral and concentrates are counted negatively. With the increase in the calorie production target, concentrates that are "richer" in food content but more expensive may, at a certain level of the tar-get, be replaced by cereals produced in mixed farming systems when the implicit value of the food calorie becomes very high. When the value of the food calorie reaches the highest levels, the most profitable animal production in turn becomes penalized in the case of feed imported to the farm. In addition, cereal foods originating from the farm are produced by mixed polyculture-livestock systems. This also explains the contrasting trends, increasing for cereals sold and unchanged or increasing moderately for cereals recycled on the farm.
The key role played by animal feed could be reinforced or reduced by adjusting the level of animal capital, considered in principle to be a determining factor in the hypotheses. In fact, although this is important, as we have seen above what matters is the possibility (in reality and in the model) of modifying the slaughter age of cattle (slaughtered at a younger age, they consume less cereals). More specifically, we study the impact of the rate of adjustment on the results obtained. Figure9shows that a rate increase slightly amplifies the evolution of agricultural land sharing among the six groups of activities without modifying their structure. There is therefore a calorie production potential that increases with the livestock adjustment rate, extending to the highest potential. Moreover, when we approach this maximum amount of calories produced, the change in the number of livestock calculated in livestock equivalent units (LU), all animal production combined, is of the order of -1% when the adjustment rate increases by 10% from 25% to 35%.
Relationships between the capacity of the productive system to produce dietary calories (human / dietary calories), the livestock adjustment rate, and the physical (meteorological) and economic (price) characteristics of the productive system environment can be summarized by the evolution of the marginal cost of producing calories, as shown in Figure 10. The effect of the physical and economic environment is significant. The effect of an increase in the LVA rate appears more important, with a significant increase in the production of calories for a marginal cost of 140AC/tsweq, of the order 8% when the LVA rate increases from 5% to 35%.
60 70 80 90 5000 10 000 15 000 20 000 25 000 5% 60 70 80 90 5000 10 000 15 000 20 000 25 000 15% 60 70 80 90 5000 10 000 15 000 20 000 25 000 25% 60 70 80 90 5000 10 000 15 000 20 000 25 000 35%
Figure 9. Change in agricultural area sharing increases (1000 ha), given the livestock adjustment rates 0, 15, 25 and 35% (from the left to the right) and the year 2012, when activities are grouped as follows:
cereals oils & proteins industrials fodders grasslands fallows
(x-axis refers to the level calorie production expressed in Mtsweq)
55 60 65 70 75 80 85 0.02 0.04 0.06 0.08 0.10 0.12 0.14 5% 55 60 65 70 75 80 85 0.02 0.04 0.06 0.08 0.10 0.12 0.14 15% 55 60 65 70 75 80 85 0.02 0.04 0.06 0.08 0.10 0.12 0.14 25% 55 60 65 70 75 80 85 0.02 0.04 0.06 0.08 0.10 0.12 0.14 35%
Figure 10. Change in marginal cost crossing the level of food calories produced (1000AC/tsweq),
given livestock adjustment rates 0, 15, 25 and 35% (from the left to the right) and the years:
2007 2008 2009 2010 2011 2012 (x-axis refers to the level calorie production expressed in Mtsweq).
The joint analysis of the results presented in Figures 4 and 5 (for France) on the one hand, and in Figures 9 and 10 on the other, shows that a large part of the calorie gain is possible by moderately progressive modification of the allocation of land and livestock (with a gain in calories of the order of two thirds to three quarters depending on the year). The remaining gain is always correlated between the two explanatory factors, but with a much greater impact. When the implicit cost of the calorie produced becomes high, the adjustments made possible by changes in feed become difficult, and reduction in animal activity, in particular in the cattle herd, becomes even more necessary, with as a corollary reduction in areas of meadows to the benefit of fallow.
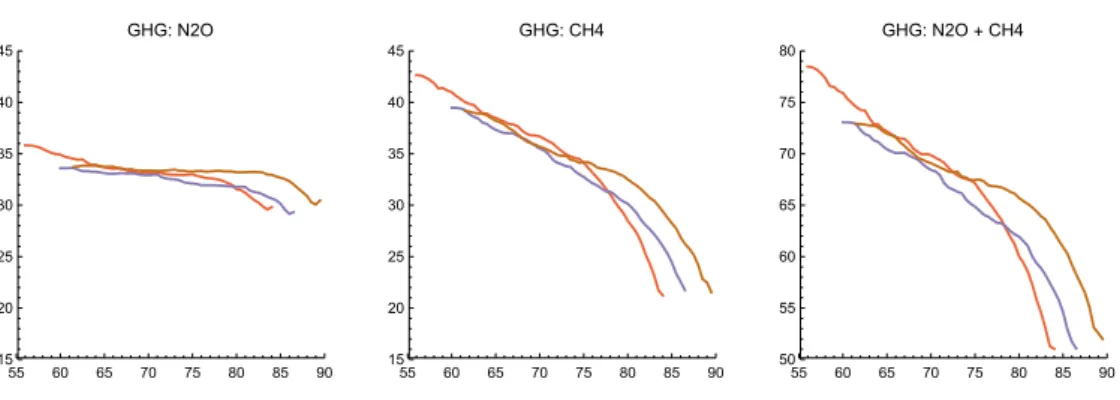
The results obtained from the simulations confirm that a decrease in animal production in favor of crop production could benefit the environment, at least as regards direct emissions of greenhouse gases of agricultural origin. More specifically, the gain is evident in terms of methane emissions, so that the estimated drop in direct emissions for the two gases of agricultural origin amounts to 35% for 2012 and for a LVA rate of 35% (Figure11).
This result may be tempered by the fact that some of the permanent grasslands might be plowed, with a negative effect following the destocking of carbon, but most of the reduction in permanent grassland area is reflected in abandoned fallows, with no effect on storage or removal of carbon. The gain in cultivated areas is mainly to the detriment of temporary grassland. A more detailed analysis of the simulations carried out for 2012 gives the following differences between the initial situation and reaching maximum production of food calories in terms of area: permanent grasslands down 4.8Mha, temporary grasslands down 1.8Mha, cereals up 1.9Mha, fallows up 4.2Mha, oilseeds almost unchanged, forage up 0.2Mha. Plowed permanent grassland is estimated at 0.6Mha, which is likely to release carbon in the form of carbon dioxide of about 4.5MtCO2eq/year on average over 20 years (seePoeplau et al.(2011) and the review byPellerin
55 60 65 70 75 80 85 90 15 20 25 30 35 40 45 GHG: N2O 55 60 65 70 75 80 85 90 15 20 25 30 35 40 45 GHG: CH4 55 60 65 70 75 80 85 90 50 55 60 65 70 75 80 GHG: N2O + CH4
Figure 11. Change in emissions of greenhouse gases from agricultural sources (MtCO2eq), given livestock
adjustment rates of 35% and the years:2007 2008 2009 2010 2011 2012 (x-axis refers to the level
calorie production expressed in Mtsweq).
emissions.
This result supports the idea that a change in diet for the improvement of human health would contribute significantly to the reduction of negative externalities to the environment. Through our analysis, this is proven for methane emissions. The effects of nitrous oxide emissions are more difficult to determine, since a gain in emissions from reduced livestock effluents is offset by higher emissions from fertilizer consumption, but the increase is probably limited by the lower consump-tion of nitrogen in organic form due to the decline in livestock manure.
4
Summary and concluding remarks
We conducted a prospective analysis on the basis of a techno-economic model aimed at assessing the potential for net food calorie production in France, and what this means in terms of changes in plant and animal production, agricultural land allocation and greenhouse gas emissions. The analysis appears robust in terms of results with regard to the inter-annual variability taken into account when the model is run in as many independent versions as the years of observation.
The approach is conducted in the economic and meteorological contexts of the years on which the model is calibrated. In particular, the prices of the goods concerned in the model are exogenous and unchanged, and data related to meteorology (such as yields and irrigation water expenditure) are unchanged. Sectoral economic policy elements such as the CAP are also un-changed. Perhaps more importantly, the farm structure is unchanged, as also is the type of animal and plant activity deployed in each of the represented farms. These choices allow us to focus on the effects specific to the target, even if the hypotheses clearly constitute limits that it would be appropriate to raise and to rank one by one. Far from being a forecast, the hypotheses and op-tions used in our scenarios represent "futures" that are technically and economically possible and realistic.
The scenario studied is based on the variation of two elements: (i) the level of net food calorie production required from the production system, counting positively the quantities of ce-reals, oil-protein seeds, sugar, milk and meat farm outputs, and negatively concentrated feed pur-chased for livestock; (ii) the rate of adjustment of animal capital to the initial capital, which “au-thorizes” the categories of cows, bulls, oxen, sheep, goats, pigs and poultry to vary within a limited range, given that for the cattle herd, the other categories adjust freely subject to the constraints of transition from one age class to another. The maximum level of dietary calorie production is de-termined by the existence of a solution to the optimization program. The adjustment rate used for animal capital is 25% by default, and the values of 5, 15, 25 and 35% have been taken into account
for the sensitivity analysis.
The national approach must be re-situated in the context of the EU, given the level of integration of agricultural and environmental objectives between Member States. Through the marginal cost of producing dietary calories, the relationship between what would be produced by “autonomous” France and France in the EU is clarified. We show that, for a marginal cost of calorie production of less than 150 euros per ton of wheat equivalent, France can increase its calory production by up to 40%. This is to be compared, for the same marginal cost, with an increase of up to 125% for the EU on average. This result arises from the contrasting characteristics of national agriculture in the EU, and the fact that net food calorie production relative to the agricultural area in the reference situation is higher in France than the European average.
In France, a limited increase of 30 or 50% of calorie production (in the range of 52 to 78 Mtsweq for the years 2010 to 2012) would result in a steady and moderate change in land use
and a steady and moderate decline in livestock production. Permanent and temporary grassland areas could decrease by up to 2Mha (9Mha initially), offset by an increase in cereal area of around 1Mha and fallows of 1.5Mha. The change in areas of other activities would be lower: either up (forage, industrial crops) or down (oilseed crops). The decline in animal production is both regular and more pronounced, falling from 17 to 15 million livestock units. In addition, the production of calories required from the production system would result in more significant changes, in par-ticular a further decrease in grassland area of 3Mha, an additional 1.5Mha increase in cereals and a fall-over to more than 3Mha extra in fallows. There would be a reversal of the trend for other groups of agricultural activities. Finally, the additional decline in livestock would be 2.5 to 3 MLU.
In terms of production systems, those which are initially systems with a negative balance of net production of calories change the most strongly, then stabilize when the target of calories produced increases, because of the food cost of animal production. It is therefore the breeding and polyculture breeding systems that are most affected. More than animal capital, particularly with regard to beef production (the variation of which is limited by hypothesis for cows, bulls and oxen), the most important factor in productive adjustments is animal feed.
It is obvious that short-term market reactions (price adjustment) and the evolution of long-term production structures incorporating these short-long-term market balances necessarily alter these results. To limit ourselves to analyses in general or partial equilibrium, it would be interesting to conduct them by systematically measuring the relative impact at the level of disaggregation of sectors and goods traded and in terms of competition – perfect / imperfect – between operators. Where traditional animal production is threatened, it could emerge from other crop production systems (for higher-yielding food and non-food uses) and animal production (milk or meat, ori-ented towards more profitable quality products). These structural or market effects will need to be addressed as well as the impacts of climate change on production systems, both in the short term and in the long term.
One point seems well established: the increase in net output of dietary calories would lead to a very significant reduction in greenhouse gas emissions from agriculture. This reduction gain is mainly dependent on methane emissions that (in Europe) come mostly from animal activities. The nitrous oxide balance sheet is more mixed, since N2Oemissions associated with the management
of livestock manure would be offset by increases related to the increase in fertilizer consumption required by crops. The N2Obalance sheet is even more complex to establish because of organic
nitrogen inputs via livestock effluents, and organic nitrogen with loss rates (N2O, NO3, NH3) at
different levels caused by the use of mineral fertilizers – which the AROPAj model is able to take into account. On the environmental issue, one of the critical points of the analysis concerns the possible release of carbon caused by plowing grasslands. Our results indicate that grasslands would largely become fallow land, and for the remaining part, the shift to tilled land would reduce the gain obtained in the reduction of greenhouse gas emissions by less than 20%, and much less than 20% if the changes operate over a long time horizon.
References
Aleksandrowicz, L., Green, R., Joy, E. J. M., Smith, P., & Haines, A. (2016). The Impacts of Dietary Change on Greenhouse Gas Emissions, Land Use, Water Use, and Health: A Systematic Review. PLoS ONE, 11(11). https://doi.org/10.1371/journal.pone.0165797.
Aubert, P.-M., Schwoob, M.-H., & Poux, X. (2019). Agroecology and carbon neutrality in europe by 2050: what are the issues? Technical report,
ID-DRI, https://www.iddri.org/sites/default/files/PDF/Publications/
Catalogue%20Iddri/Etude/201904-ST0219-TYFA%20GHG_0.pdf.
Bajzelj, B., Richards, K., Allwood, J., Smith, P., Dennis, J., Curmi, E., & Gilligan, C. (2014). The importance of food demand management for climate mitigation. Nature Climate Change, 4, 924–929. https://doi.org/10.1038/nclimate2353.
Beddington, J., Asaduzzaman, M., Fernández, A., Clark, M., Guillou, M., Jahn, M., Erda, L., Mamo, T., Van Bo, N., Nobre, C., Scholes, R., Sharma, R., & Wakhungu, J. (2012). Achieving food security in the face of climate change: Final report from the Commission on Sustain-able Agriculture and Climate Change. Technical report, CGIAR Research Program on Climate Change, Agriculture and Food Security (CCAFS). Copenhagen, Denmark.
Berners-Lee, M., Kennelly, C., Watson, R., & Hewitt, C. N. (2018). Current global food pro-duction is sufficient to meet human nutritional needs in 2050 provided there is radical societal adaptation. Elem Sci Anth, 6(1).
Brent, F. K., Santo, R. E., Scatterday, A. P., Fry, J. P., Synk, C. M., Cebron, S. R., Mekonnen, M. M., Hoekstra, A. Y., de Pee, S., Bloem, M. W., Neff, R. A., & Nachman, K. E. (2019). Country-specific dietary shifts to mitigate climate and water crises. Global Environmental Change. https://doi.org/10.1016/j.gloenvcha.2019.05.010.
Bryngelsson, D., Wirsenius, S., Hedenus, F., & Sonesson, U. (2016). How can the EU climate targets be met? A combined analysis of technological and demand-side changes in food and agriculture. Food Policy, 59, 152–164.
Burney, J., Davis, S., & Lobell, D. (2010). Greenhouse gas mitigation by agricultural intensifica-tion. Proceedings of the National Academy of Sciences of the United States of America (PNAS) Early Edition.
De Cara, S., Henry, L., & Jayet, P.-A. (2018). Optimal coverage of an emission tax in the pres-ence of monitoring, reporting, and verification costs. Journal of Environmental Economics and Management, 89, 1–13.
De Cara, S., Houzé, M., & Jayet, P.-A. (2005). Methane and Nitrous Oxide Emissions from Agriculture in the EU: A Spatial Assessment of Sources and Abatement Costs. Environmental & Resource Economics, 32, 551–583.
De Cara, S. & Jayet, P.-A. (2011). Marginal abatement costs of greenhouse gas emissions from European agriculture, cost effectiveness, and the EU non-ETS burden sharing agreement. Eco-logical Economics, 70, 1680–1690.
FAO (2003). Les bilans alimentaires. Organisation des Nations Unies pour l’alimentation et l’agriculture.
Hedenus, F., Wirsenius, S., & Johansson, D. (2014). The importance of reduced meat and dairy consumption for meeting stringent climate change targets. Climatic Change, 124(1-2), 79–91.
Herrero, M., Havlik, P., Valin, H., Notenbaert, A., Rufino, M. C., Thornton, P. K., Blümmel, M., Weiss, F., Grace, D., & Obersteiner, M. (2013). Biomass use, production, feed efficiencies, and greenhouse gas emissions from global livestock systems. Proceedings of the National Academy of Sciences of the United States of America, 110(52), 20888–20893.
IPCC (2001). Good Practice Guidance and Uncertainty Management in National Greenhouse Gas Inventories. Technical report, Japan: Institute for Global Environmental Strategies (IGES). Jayet, P.-A., Petsakos, A., Chakir, R., Lungarska, A., De Cara, S., Petel, E., Humblot, P., Go-dard, C., Leclère, D., Cantelaube, P., Bourgeois, C., Clodic, M., Bamière, L., Ben Fradj, N., Aghajanzadeh-Darzi, P., Dumollard, G., Isb˘a¸soiu, A., Adrian, J., Pilchak, G., Bounaf-faa, M., Barberis, D., Assaiante, C., Ollier, M., Henry, L., & Florio, A. (2019). The Euro-pean agro-economic AROPAj model. https://www6.versailles-grignon.inra.
fr/economie_publique_eng/Research-work: INRA, UMR Economie Publique.
Leip, A., Weiss, F., Lesschen, J. P., & Westhoek, H. (2014). The nitrogen footprint of food products in the European Union. The Journal of Agricultural Science, 152, 20–33.
O’Mara, F. (2012). The role of grasslands in food security and climate change. Annals of Botany, 110, 1263–1270.
Pellerin, S., Bamiere, L., Launay, C., Martin, R., Schiavo, M., Angers, D., Augusto, L., Balesdent, J., Basile-Doelsch, I., Bellassen, V., et al. (2019). Stocker du carbone dans les sols français, Quel potentiel au regard de l’objectif de 4 pour 1000 et à quel coût? Synthèse du rapport d’étude. Technical report, http://institut.inra.fr/ Missions/Eclairer-les-decisions/Etudes/Toutes-les-actualites/
Stocker-4-pour-1000-de-carbone-dans-les-sols-francais.
Poeplau, C., Don, A., Vesterdal, L., Leifeld, J., van Wesemael, B., Schumacher, J., & Gensior, A. (2011). Temporal dynamics of soil organic carbon after land-use change in the temperate zone - carbon response functions as a model approach. Global Change Biology, 17, 2415–2427. https://doi.org/10.1111/j.1365-2486.2011.02408.x.
Röös, E., Bajželj, B., Smith, P., Patel, M., Little, D., & Garnett, T. (2017). Greedy or needy? Land use and climate impacts of food in 2050 under different livestock futures. Global Environmental Change, 47.
Smith, P., Haberl, H., Popp, A., Erb, K.-h., Lauk, C., Harper, R., Tubiello, F. N., de Siqueira Pinto, A., Jafari, M., Sohi, S., Masera, O., Böttcher, H., Berndes, G., Bustamante, M., Ahammad, H., Clark, H., Dong, H., Elsiddig, E. A., Mbow, C., Ravindranath, N. H., Rice, C. W., Rob-ledo Abad, C., Romanovskaya, A., Sperling, F., Herrero, M., House, J. I., & Rose, S. (2013). How much land-based greenhouse gas mitigation can be achieved without compromising food security and environmental goals? Global Change Biology, 19, 2285–2302.
Springmann, M., Clark, M., Mason-D’Croz, D., Wiebe, K., Bodirsky, B., Lassaletta, L., Vries, W., Vermeulen, S., Herrero, M., Carlson, K., Jonell, M., Troell, M., Declerck, F., Gordon, L., Zurayk, R., Scarborough, P., Rayner, M., Loken, B., Fanzo, J., & Willett, W. (2018). Options for keeping the food system within environmental limits. Nature, 562.
Springmann, M., Godfray, H. C. J., Rayner, M., & Scarborough, P. (2016). Analysis and valuation of the health and climate change cobenefits of dietary change. Proceedings of the National Academy of Sciences of the United States of America, 113(15), 4146–4151. https://doi.org/10.1073/pnas.1523119113.
Thornton, P. K. (2010). Livestock production: recent trends, future prospects. Philosophical Transactions of the Royal Society B: Biological Sciences., 365, 2853–2867.
Tilman, D. & Clark, M. (2014). Global diets link environmental sustainability and human health. Nature, 515, 518–522.
Tukker, A., Goldbohm, R. A., de Koning, A., Verheijden, M., Kleijn, R., Wolf, O., Pérez-Domínguez, I., & Rueda-Cantuche, J. M. (2011). Environmental impacts of changes to healthier diets in Europe. Ecological Economics, 70(10), 1776–1788.
Valin, H., Havlik, P., Mosnier, A., Herrero, M., Schmid, E., & Obersteiner, M. (2013). Agricultural productivity and greenhouse gas emissions: trade-offs or synergies between mitigation and food security? Environmental Research Letters.
Van Kernebeek, H. R. J., Oosting, S. J., Van Ittersum, M. K., Bikker, P., & De Boer, I. J. M. (2016). Saving land to feed a growing population: consequences for consumption of crop and livestock products. The International Journal of Life Cycle Assessment, 21(10), 677–687.
Weiss, F. & Leip, A. (2012). Greenhouse gas emissions from the EU livestock sector: a life cycle assessment carried out with the CAPRI model. Agriculture, Ecosystems & Environment, 149, 124–134.
Westhoek, H., Lesschen, J. P., Rood, T., Wagner, S., De Marco, A., Murphy-Bokern, D., Leip, A., van Grinsven, H., Sutton, M. A., & Oenema, O. (2014). Food choices, health and environment: Effects of cutting Europe’s meat and dairy intake. Global Environmental Change, 26, 196–205.
A
Appendix
Table A.2. GHG emission calculation tiers in the AROPAj model. N2O - Agr soils - Direct emissions / synthetic fertilizers
N2O - Agr soils - Direct emissions / manure application N2O - Agr soils - Direct emissions / by crops residues N2O - Agr soils - Animal production (pasture ...)
N2O - Agr soils - Indirect emissions / N atmospheric redeposition N2O - Agr soils - Indirect emissions / N from leaching
N2O - Manure management
CH4 - Manure management (Dairy cattle) CH4 - Manure management (Non-dairy cattle) CH4 - Manure management (Sheep)
CH4 - Manure management (Goats) CH4 - Manure management (Swine) CH4 - Manure management (Poultry) CH4 - Rice cultivation
CH4 - Enteric fermentation (Dairy cattle) CH4 - Enteric fermentation (Non-dairy cattle) CH4 - Enteric fermentation (Sheep)
CH4 - Enteric fermentation (Goats) CH4 - Enteric fermentation (Swine) CH4 - Enteric fermentation (Poultry)
Table A.3. Calorie content of products exported from farms (FAO 2003); the content is weighted by the life duration of the animals in each category (in years), as estimated for the AROPAj model.
Crops Calorie content Animal category Calorie content Meat content [kcal/100g] (non-reported on farm) [kcal/100g] [ton/animal/year] oats 385 two-year-old males on-farm 250 0.48 durum wheat 334 female calves from dairy herd 250 0.27 soft wheat 334 female calves from breeding herd 250 0.27 maize 356 18-month-old bulls 250 0.4 other cereals 340 8-day old slaughtered calves 250 0.1 barley 332 two-month-old slaughtered calves 250 0.25
rye 319 dairy cows 250 0.036
rice 362 six-month-old calves (field) 250 0.27
suckler cows 250 0.080
goats 210 0.012
sheep 210 0.012
sugar beet 70 pigs 220 0.26
field vegetables 40 poultry 200 7.5
proteins 80 milk 61
potatoes 67 concentrated feed:
soy 335 simple / energy 350
protein fodder 387 simple / protein 350 rapeseed 387 compound / energy 350 sunflower 387 compound / protein 350