Clonogenic Neoblasts Are Pluripotent Adult Stem
Cells That Underlie Planarian Regeneration
The MIT Faculty has made this article openly available.
Please share
how this access benefits you. Your story matters.
Citation
Wagner, D. E.; Wang, I. E. and Reddien, P. W. “Clonogenic Neoblasts
Are Pluripotent Adult Stem Cells That Underlie Planarian
Regeneration.” Science 332, 6031 (May 2011): 811–816 © 2011
American Association for the Advancement of Science (AAAS)
As Published
http://dx.doi.org/10.1126/science.1203983
Publisher
American Association for the Advancement of Science (AAAS)
Version
Author's final manuscript
Citable link
http://hdl.handle.net/1721.1/110557
Terms of Use
Creative Commons Attribution-Noncommercial-Share Alike
Clonogenic neoblasts are pluripotent adult stem cells that
underlie planarian regeneration
Daniel E. Wagner1,3, Irving E. Wang1,3, and Peter W. Reddien1,2,4
1Howard Hughes Medical Institute, MIT Biology, Whitehead Institute for Biomedical Research, 9
Cambridge Center, Cambridge, MA 02142, USA
2Associate member, Broad Institute
Abstract
Pluripotent cells in the embryo can generate all cell types, but lineage-restricted cells are generally thought to replenish adult tissues. Planarians are flatworms and regenerate from tiny body
fragments, a process requiring a population of proliferating cells (neoblasts). Whether regeneration is accomplished by pluripotent cells or by the collective activity of multiple lineage-restricted cell types is unknown. Using ionizing radiation and single-cell transplantation, we identified neoblasts that can form large descendant-cell colonies in vivo. These clonogenic neoblasts (cNeoblasts) produce cells that differentiate into neuronal, intestinal, and other known post-mitotic cell types and are distributed throughout the body. Single transplanted cNeoblasts restored regeneration in lethally irradiated hosts. We conclude that broadly distributed, adult pluripotent stem cells underlie the remarkable regenerative abilities of planarians.
Pluripotent cells, such as embryonic blastomeres, differentiate into mature cell types spanning three germ layers (1–3). Although essential for development, pluripotent cells are generally not known to be present in adult animals (4, 5). Adult tissues, by contrast, are typically maintained by specialized, tissue-specific adult stem cells (5–11). Planarians are flatworms well known for the ability to regenerate whole animals from small pieces of tissue (12). Planarian regeneration requires a population of proliferative cells, historically known as neoblasts, that exist throughout the body and collectively produce all known
differentiated cell types (13, 14). Neoblasts have great potential for molecular genetic studies in Schmidtea mediterranea where a sequenced genome and molecular tools (including RNAi technology) enable identification and study of genes controlling regeneration (14, 15). To date, however, neoblast properties have only been studied at the level of a population (14, 16–21). The cell population known as neoblasts, therefore, could either contain only lineage-restricted cells that together allow regeneration, or could contain, within the population, stem cells that are pluripotent at the single-cell level. A fundamental issue to address for understanding planarian regeneration, therefore, is the in vivo potential of individual proliferating planarian cells.
Colonies are generated from single smedwi-1
+cells following irradiation
We developed an in vivo method, utilizing ionizing radiation, that permits study of rare, individual proliferating cells and their descendants. Irradiation eliminates dividing cells and is a classic strategy for studying stem cells (22, 23). All dividing cells in adult planarians express the smedwi-1 gene (24) (Fig. 1A); these cells are specifically, rapidly, and
NIH Public Access
Author Manuscript
Science
. Author manuscript; available in PMC 2012 April 27.Published in final edited form as:
Science. 2011 May 13; 332(6031): 811–816. doi:10.1126/science.1203983.
NIH-PA Author Manuscript
NIH-PA Author Manuscript
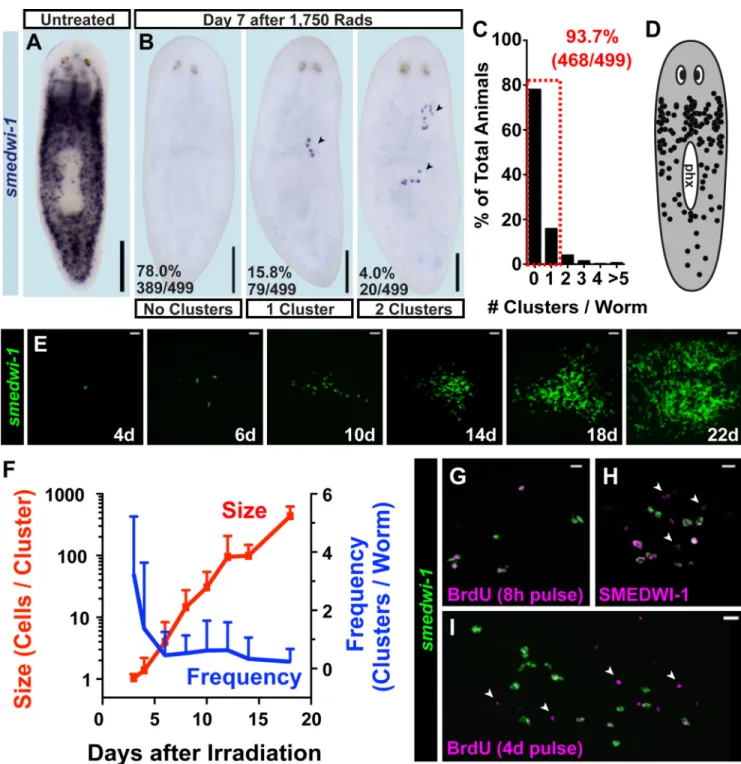
completely depleted following exposure to high irradiation doses (e.g., 6,000 rads) (17, 24, 25). Low irradiation doses (i.e., 500 rads) eliminate some proliferating cells, leaving a large number spread ventrally throughout the animal (19). We identified an irradiation dose (1,750 rads) that eliminated all smedwi-1+ cells from most (78%) animals (Fig. 1B). However, seven days after 1,750 rad exposure, rare smedwi-1+ cells were present in the
minority of animals (22%) as sparse “clusters” (Fig. 1B–C). Clusters consistently displayed compact, isolated, colony-like morphology and originated ventrally throughout the body (Fig. 1D, S1A–C) but were not associated with specific known tissues (Fig. S1D–E). These clusters, if resulting from clonal growth of single smedwi-1+ cells, provide the opportunity
to study the developmental potential of individual planarian cells.
Numerous smedwi-1+ cluster attributes indicate they result from clonal growth. smedwi-1+
clusters were preceded by isolated smedwi-1+ cells present 3–4 days following irradiation,
and typically displayed 3–10 cells after one week (Fig. 1E–F). Based on the low proportion of animals with smedwi-1+ cells in close proximity 3 days post-irradiation with 1,750 rads
(Fig. S2), it is improbable that clusters arose from multiple adjacent smedwi-1+ cells (P =
0.0138, 2-tailed Fisher’s Exact Test). Cluster size increased dramatically over time,
suggesting exponential growth, ultimately yielding hundreds of smedwi-1+ cells 14–18 days
post-irradiation (Fig. 1E–F). Consistent with clusters originating from pre-existing
smedwi-1+ cells that survived irradiation, a cluster location scatterplot resembled the normal
smedwi-1+-expression pattern (Fig. 1D), and cluster frequency decreased with increasing
irradiation doses (see below, Fig. 3A). BrdU delivery labels smedwi-1-expressing cells (ref (24) and Fig. S3A), followed by a rapid decline in incorporation within 24–48 hours (ref (17) and Fig. S3B–D) demonstrating unincorporated BrdU does not perdure long term. A BrdU pulse followed by irradiation resulted in clusters consisting entirely of BrdU+; smedwi-1+ cells (Fig. S3E), indicating smedwi-1+-cluster expansion results from division of
existing smedwi-1+ cells (i.e., by clonal growth). If some other process, such as
dedifferentiation, produced smedwi-1+ cluster cells, these cells should have been BrdU−.
Following irradiation, every proliferative cell detected by an 8-hour BrdU pulse (Fig. 1G), or by using probes for the conserved proliferation marker genes histone h2b (Smed-h2b) (26), pcna (Smed-pcna) (27), or ribonucleotide reductase (Smed-RRM2-1) (17, 28) (Fig. S3F–H), existed in clusters and expressed smedwi-1 (n=815). Therefore, no other source (non-smedwi-1+) for proliferating cells exists outside of smedwi-1+ clusters in irradiated
animals. Furthermore, if additional sources for smedwi-1+ cells (other than clonal growth)
existed, cluster number would be expected to increase with time and small, newly formed clusters might be present at late timepoints following irradiation. Neither of these possibilities was observed (Fig. 1F). New cluster production was also not observed following amputation or feeding (Fig. S4), which elicit proliferative responses (29, 30). These data indicate that clonal expansion (producing colonies) represents the source of new smedwi-1+ dividing cells during cluster formation and growth.
Not all proliferating cells (neoblasts) necessarily have the capacity to form colonies. We term cells displaying this capacity clonogenic neoblasts (cNeoblasts); these cells express smedwi-1, have a body-wide (head-to-tail) distribution (Fig. 1D), and generate large, expanding colonies of smedwi-1+ cells. The ability of small numbers of colonies ultimately
to restore both smedwi-1+ cells and mitotic activity to normal levels (Fig. S5) suggests a
stem cell-like capacity for self-renewal.
To investigate the potential of individual cNeoblasts, we analyzed smedwi-1+ colonies using
three well-established differentiation assays involving a SMEDWI-1 antibody (24, 29, 31), BrdU pulse-chase (17, 18, 31), and post-mitotic cell type markers (17, 29, 31, 32).
SMEDWI-1 protein is present in smedwi-1 mRNA+ dividing cells and temporarily remains
NIH-PA Author Manuscript
NIH-PA Author Manuscript
detectable in post-mitotic descendant cells (24). Differentiating cells therefore transit through a SMEDWI-1(protein)+;smedwi-1(mRNA)− state (29, 31). All colonies examined
(12/12) contained SMEDWI-1+; smedwi-1− cells (Fig. 1H). Independently, BrdU can label
cells that divide and exit the smedwi-1+ state. All colonies analyzed by 4-day BrdU
pulse-chase (31/31) contained BrdU+; smedwi-1− cells (Fig. 1I) and no BrdU+ cells existed in
worms lacking smedwi-1+ colonies (25/25 animals), indicating that colonies produce, and
are the only source for, cells exiting the smedwi-1+ undifferentiated state. SMEDWI-1+ or
BrdU+ colony cells can thus be assessed for lineage-specific marker expression to determine the developmental potential of individual cNeoblasts.
cNeoblasts display broad differentiation capacity
Described adult stem cells typically only produce differentiated cells corresponding to their germ layer and tissue of origin (5). To address whether cNeoblasts, by contrast, could produce cell types derived from multiple germ layers, we identified and characterized markers for neuronal (ectoderm-derived) and intestinal (endoderm-derived) lineages. In untreated animals, some SMEDWI-1+ descendant cells expressed a choline acetyl-transferase ortholog, Smed-chat (Fig. S6); chat expression is widely conserved in cholinergic neurons (33). SMEDWI-1+; chat+ cells were enriched in brain regions, had
neuronal morphology, and chat+ cells co-expressed additional neuronal markers (Fig. S6),
indicating that SMEDWI-1+; chat+ cells are differentiating neurons. Smed-gata4/5/6 and
Smed-hnf4, orthologs of endoderm-promoting GATA4/5/6 and HNF4 transcription factors, respectively (34), were expressed in intestinal cells and also in interspersed cells
surrounding the intestine (Fig. S7–10). Many of these interspersed cells were irradiation-sensitive and SMEDWI-1+, indicating they represent differentiating endodermal cells (Fig. S8, S10). A third endoderm marker gene used, Smed-mat, was expressed in intestinal branches (Fig. S8, S10). Finally, additional differentiation marker genes used (Smed-AGAT-1, NB.21.11E, Smed-MCP-1, Smed-ODC-1, Smed-CYP1A1-1, and NB.52.12F) are expressed in partially overlapping mesenchymal populations of post-mitotic cells (Fig. S11A–F) (17). These populations have unknown lineage relationships but turnover rapidly, and are consequently depleted following irradiation (17) (Fig. S11G–L).
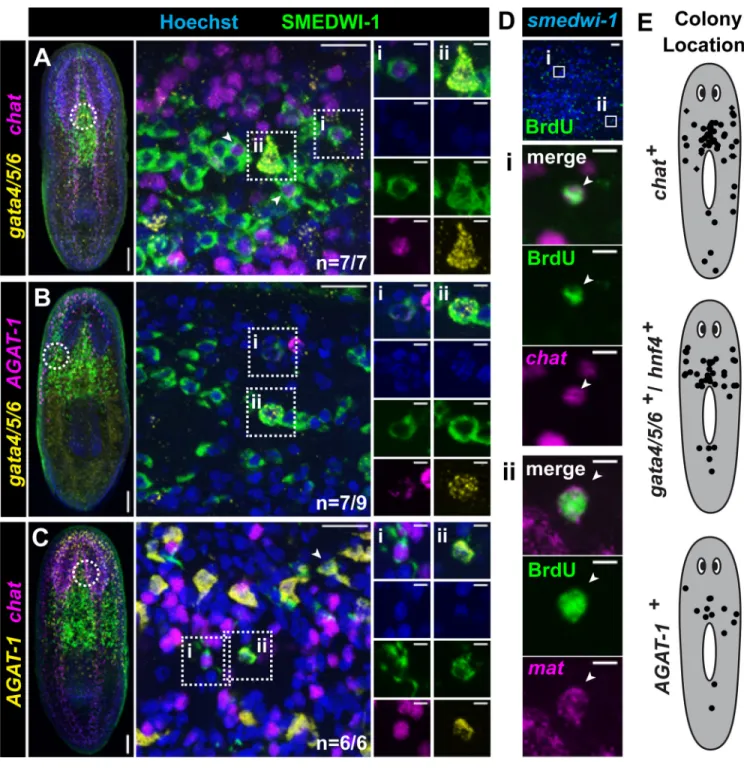
Using SMEDWI-1 to label colony cell descendants, individual colonies were examined for the presence of both gata4/5/6+ and chat+, both gata4/5/6+ and AGAT-1+, or both AGAT-1+
and chat+ differentiating cells. In nearly all cases (n=20/22), individual colonies contained
newly produced cells of both lineages tested (Fig. 2A–C, S12). The 1,750 rad dose yields rare, well-separated colonies (See Fig. 1C); animals fixed 7 days after irradiation contained single colonies (12/28 animals), no colonies (12/28), and only rarely, more than one colony (4/28). Given the high frequency of colonies producing multiple lineages (20/22), it is improbable that all such cases were the result of multiple colonies merging (P<0.0001, Fisher’s Exact Test). In addition, using a 4-day BrdU pulse chase as an independent method, we identified several colonies containing both BrdU+; chat+ (neuronal) and BrdU+; mat+
(intestinal) cells (Fig. 2D). Nearly all colonies examined, using the SMEDWI-1 antibody or BrdU, produced differentiated cells for any single lineage analyzed (n=61/64) (Fig. S13). These colonies were distributed throughout the body and not restricted to specific anatomical regions (Fig. 2E). Finally, nearly every smedwi-1+ colony examined had
associated cells expressing every additional differentiation marker tested (NB.21.11E, MCP-1, ODC-1, CYP1A1-1, NB.52.12F) (n=110/115, Fig. S14A–E); descendant cell clusters, furthermore, were never observed in regions lacking smedwi-1+ colonies (Fig.
S11G–L). In addition, even early colonies (7 days post-irradiation) had associated
differentiated cells (Fig. S14F). Together, these data indicate that broad multipotency and a body-wide distribution are fundamental attributes of individual cNeoblasts.
NIH-PA Author Manuscript
NIH-PA Author Manuscript
Small numbers of cNeoblasts restore regenerative ability
Irradiated planarians cannot regenerate (35) and suffer massive tissue loss because of failed replacement of aged differentiated cells (35, 36). However, transplantation of large numbers of cells (16) or tissue fragments can restore regenerative ability to irradiated hosts and change sexual behavior to that of a donor (16, 20, 21, 37). We sought to determine whether small numbers of cNeoblasts would restore regenerative ability to irradiated animals. Following irradiation, some animals were fixed and colony numbers determined; remaining animals were followed to assess survival and regeneration frequencies. Increasing irradiation doses resulted in decreasing colony numbers (Fig. 3A–B) and survival rates (Fig. S15A). Regeneration, which involves production of diverse cell types (Fig. S16), was initially impeded in animals cut 4 days post-irradiation (Fig. S15B–C); however, many animals both survived and ultimately regenerated at doses that produced sparse, measurable colony numbers (Fig. 3A–D, Table S1). These animals regenerated heads containing neurons (ectoderm), muscle (mesoderm), and intestine (endoderm) (Fig. 3D–E). The minimum number of cNeoblasts initially present in irradiation survivors can be estimated by comparing the number of colonies present (in fixed animals) to observed regeneration frequencies (see Table S1). Our data indicate as few as three (P=0.0478), four (P=0.0017), or five colonies (P<0.0001, Fisher’s Exact Test) can be sufficient to restore regenerative ability to entire animals.
Transplantation of individual cNeoblasts
To determine whether a single cNeoblast can generate all essential adult cells, we developed a method for isolating and transplanting individual cNeoblasts into lethally irradiated hosts. Previous flow cytometry studies identified an irradiation-sensitive cell population with a high percentage of smedwi-1+ cells (25, 38). However, the Hoechst 33342 DNA dye used in
this method is cytotoxic. Therefore, size and complexity properties of cells within the X1 fraction were used to define a gate for sorting unlabeled cells, which we refer to as the X1(FS) fraction (Fig. 4A–B).
X1(FS) cells are heterogeneous; however, cells with a similar morphology to X1 cells can be identified microscopically (Fig. 4C). Single selected cells were loaded into needles and transplanted post-pharyngeally into lethally irradiated hosts (Fig. 4D). To confirm that only single cells were transplanted, needles were loaded and the contents expelled into media. In all cases, only a single cell was observed exiting the needle (n=136/136). Furthermore, some animals were fixed immediately following transplant and labeled with a smedwi-1 RNA probe. All injected animals had either one (n=20/60) or zero (n=40/60) smedwi-1+ cells
(Fig. 4E–F).
If a transplanted cell was a cNeoblast capable of engraftment, then clonal growth of progeny cells would be expected. Indeed, animals examined 6 days after single cell transplantation displayed clusters with 1 to 13 smedwi-1+ cells (n=23/100) (Fig. 4G). Furthermore,
selecting for X1(FS) cells that were approximately 10µm in diameter and that had blebs and/ or cytoplasmic processes increased engraftment rates, ranging from 12% (n=17) to 75% (n=20) (Fig. S17). Cells with properties of cNeoblasts, therefore, are present in the X1(FS) fraction and can be successfully transplanted.
If cNeoblasts are pluripotent stem cells capable of self-renewal, then a single cNeoblast should, in principle, be capable of restoring tissue turnover and regenerative capacity to lethally irradiated hosts. However, for this to occur the irradiated host must survive long enough for the cNeoblast to repopulate the smedwi-1+ population and replenish dying tissue.
We therefore used a sexual S. mediterranea strain (S2F1L3F2) that can survive longer than the asexual strain (CIW4) after a 6,000 rad irradiation dose (Fig. S18). Sexual hosts
NIH-PA Author Manuscript
NIH-PA Author Manuscript
transplanted with single asexual cells had colonies consisting of large numbers of
SMEDWI-1+ cells 30 days after transplantation (n=4/17) (Fig. 4H). Every colony examined contained SMEDWI-1+; Smed-gata4/5/6+ double-positive cells (n=4/4) and most of these
colonies also contained SMEDWI-1+; Smed-chat+ double-positive cells (n=3/4) (Fig. 4H).
Transplant data thus independently confirm attributes of colonies described post 1,750 rads, further indicating that clonal growth and multipotency are important features of individual cNeoblasts.
Entire animals and strains regenerated from a single transplanted
cNeoblast
Two weeks after irradiation, lesions appeared at sexual animal head tips, followed by progressive anterior to posterior tissue regression with 100% penetrant animal death after approximately six weeks (n=78) (Fig. 5A). Remarkably, several transplant recipients lived past seven weeks and eventually developed blastemas at the site of tissue regression (n=7/130) (Fig. 5A). Animals that developed blastemas regenerated anterior and midbody structures, such as photoreceptors and pharynges (Fig. 5A), and regained feeding behavior by eight weeks after irradiation. Of the seven rescued animals, three were expanded into strains (R1, R2, and R3) by serial amputation and regeneration (Fig. S19). These animals exhibited normal blastema formation and the capacity to regenerate photoreceptors and intestine following amputation (Fig. 5B). The ability to produce multiple regenerating animals from a single transplanted cell indicates a self-renewing capability of cNeoblasts. Rescued strains did not display sexual features, such as large size and a gonopore; by contrast, animals in all three strains reproduced by binary fission, an asexual behavior seen very rarely in sexual animals (Fig. S19).
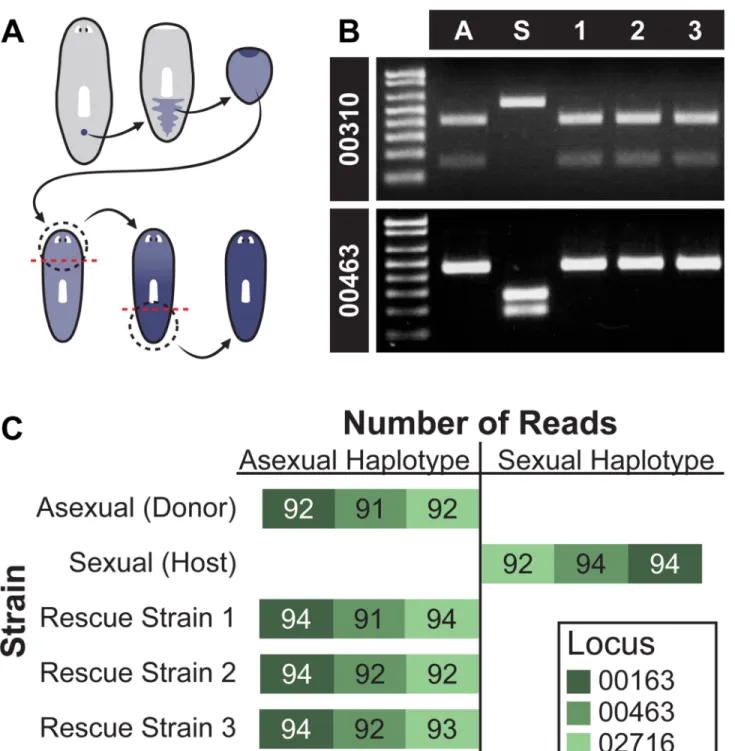
To confirm that all new tissue in rescued strains resulted from clonal division from the donor cNeoblast, we genotyped the animals using SNPs identified between the asexual strain and the sexual strain (see Materials and Methods). Genomic DNA was isolated from strain R1, R2, and R3 animals following two rounds of regeneration; growth and regeneration should replace host tissues with donor-derived cells (Fig. 6A). If, on the other hand, host cells continue to replenish tissues after irradiation, host SNPs in the collected genomic DNA would be expected. PCR-RFLP analysis of two loci (RFLP 00310 and RFLP 00463) revealed that the rescued strains have the asexual strain RFLPs, indicating that the majority of cells in these animals were donor-derived (Fig. 6B). Sequencing of three independent homozygous haplotypes (00163, 00463, and 02716), each containing six SNPs that distinguish asexual CIW4 and sexual S2F1L3F2 strains, confirmed that the rescue strains possessed the donor, rather than host, genotype (Fig. 6C). These data indicate that descendants of a single cNeoblast ultimately transformed the recipient into a genetic clone of the donor by replacing all cells present in the original host. We conclude that cNeoblasts are pluripotent stem cells with a broad, body-wide distribution and that persistence into adulthood of a pluripotent stem cell enables the remarkable regenerative feats of planarians.
Supplementary Material
Refer to Web version on PubMed Central for supplementary material.
Acknowledgments
We thank D. Kim for manuscript comments, S. Lapan for intestinal markers, M. Srivastava for phylogenetics advice, D. Wenemoser for SMEDWI-1 antibody purification, J. Owen for Illumina data, M. Griffin for flow cytometry assistance, as well as P. Hsu, G. Bell, R. Young, and all members of the Reddien Lab for extensive comments and discussion. P.W.R. is an early career scientist of the Howard Hughes Medical Institute. We acknowledge support by NIH R01GM080639 and Keck Foundation support.
NIH-PA Author Manuscript
NIH-PA Author Manuscript
References
1. Evans MJ. J Embryol Exp Morphol. 1972; 28:163. [PubMed: 4672577] 2. Evans MJ, Kaufman MH. Nature. 1981; 292:154. [PubMed: 7242681] 3. Martin GR. Proc Natl Acad Sci USA. 1981; 78:7634. [PubMed: 6950406]
4. Wagers AJ, Sherwood RI, Christensen JL, Weissman IL. Science. 2002; 297:2256. [PubMed: 12215650]
5. Wagers AJ, Weissman IL. Cell. 2004; 116:639. [PubMed: 15006347] 6. Weissman IL. Cell. 2000; 100:157. [PubMed: 10647940]
7. Spangrude GJ, Heimfeld S, Weissman IL. Science. 1988; 241:58. [PubMed: 2898810] 8. Uchida N, et al. Proc Natl Acad Sci USA. 2000; 97:14720. [PubMed: 11121071] 9. Blanpain C, Lowry WE, Geoghegan A, Polak L, Fuchs E. Cell. 2004; 118:635. [PubMed:
15339667]
10. Ohlstein B, Spradling A. Nature. 2006; 439:470. [PubMed: 16340960] 11. Barker N, et al. Nature. 2007; 449:1003. [PubMed: 17934449] 12. Morgan TH. Arch. Entw. Mech. Org. 1898; 7:364.
13. Keller J. Jen Zeit Naturw. 1894; 28:370.
14. Reddien PW, Sánchez Alvarado A. Annu Rev Cell Dev Biol. 2004; 20:725. [PubMed: 15473858] 15. Reddien PW, Bermange AL, Murfitt KJ, Jennings JR, Sánchez Alvarado A. Dev Cell. 2005; 8:635.
[PubMed: 15866156]
16. Baguñà J, Saló E, Auladell C. Development. 1989; 107:77.
17. Eisenhoffer GT, Kang H, Sánchez Alvarado A. Cell Stem Cell. 2008; 3:327. [PubMed: 18786419] 18. Newmark PA, Sánchez Alvarado A. Dev Biol. 2000; 220:142. [PubMed: 10753506]
19. Salvetti A, et al. Dev Biol. 2009; 328:305. [PubMed: 19389358]
20. Lange CS, Gilbert CW. International Journal of Radiation Biology. 1968; 14:373. 21. Wolff E, Dubois F. Revue Swisse Zool. 1948; 55:218.
22. Becker AJ, Till JE, McCulloch EA. Nature. 1963; 197:452. [PubMed: 13970094] 23. Till JE, McCulloch E. Radiat Res. 1961; 14:213. [PubMed: 13776896]
24. Guo T, Peters AH, Newmark PA. Dev Cell. 2006; 11:159. [PubMed: 16890156]
25. Reddien PW, Oviedo NJ, Jennings JR, Jenkin JC, Sánchez Alvarado A. Science. 2005; 310:1327. [PubMed: 16311336]
26. Hewitson TD, Kelynack KJ, Darby IA. Methods Mol Biol. 2006; 326:219. [PubMed: 16780204] 27. Bravo R, Frank R, Blundell PA, Macdonald-Bravo H. Nature. 1987; 326:515. [PubMed: 2882423] 28. Eriksson S, Graslund A, Skog S, Thelander L, Tribukait B. J Biol Chem. 1984; 259:11695.
[PubMed: 6090444]
29. Wenemoser D, Reddien PW. Dev Biol. 2010; 344:979. [PubMed: 20599901] 30. Baguñà J. J. Exp. Zool. 1976; 195:53.
31. Scimone ML, Meisel J, Reddien PW. Development. 2010; 137:1231. [PubMed: 20223763] 32. Pearson BJ, Sánchez Alvarado A. Development. 2010; 137:213. [PubMed: 20040488]
33. Nishimura K, Kitamura Y, Taniguchi T, Agata K. Neuroscience. 2010; 1:18. [PubMed: 20338223] 34. Morrisey EE, et al. Genes Dev. 1998; 12:3579. [PubMed: 9832509]
35. Bardeen CR, Baetjer FH. J. Exp. Zool. 1904; 1:191. 36. Dubois F. Bull. Biol. Fr. Belg. 1949; 83:213.
37. Lender T, Gabriel A. C. R, Acad. Sc. Paris. 1965; 260:4095. [PubMed: 14341958]
38. Hayashi T, Asami M, Higuchi S, Shibata N, Agata K. Dev Growth Differ. 2006; 48:371. [PubMed: 16872450]
NIH-PA Author Manuscript
NIH-PA Author Manuscript
Figure 1. Expanding colonies are generated from isolated smedwi-1+ cells following irradiation (A–B) Proliferating cells were detected by smedwi-1 expression using whole-mount in situ hybridization (ISH). Anterior, up. Ventral surface shown. (B) Representative images 7 days after 1,750-rad treatment show clusters (arrowheads) of smedwi-1+ cells (individual purple dots). (C) Histogram of cluster frequencies following 1,750 rads. (D) Clusters observed by smedwi-1 ISH 7 days post-1,750 rads displayed in a scatterplot. phx, pharynx. (E–F) Animals fixed in a timecourse after 1,750-rad treatment analyzed by smedwi-1 fluorescence in situ hybridization (FISH). (F) Mean cluster frequency (#clusters/worm) and size
(#smedwi-1+ cells/cluster) are plotted. Error bars, standard deviation (n=17–22 animals/
NIH-PA Author Manuscript
NIH-PA Author Manuscript
timepoint). (G) IF (BrdU) and FISH (smedwi-1). 234/234 BrdU+ cells (8-hour BrdU-pulse in seven-day-irradiated worms) were smedwi-1+. (H) IF (SMEDWI-1) and FISH
(smedwi-1); 12/12 colonies contained SMEDWI-1+; smedwi-1− cells (arrowheads) 7 days post-1,750 rads. (I) IF (BrdU) and FISH (smedwi-1). 31/31 colonies (with BrdU pulse days 7–11 post-1,750 rads) contained BrdU+; smedwi-1− cells. Scale bars, 200µm (A–B), 20µm
(E, G–I).
NIH-PA Author Manuscript
NIH-PA Author Manuscript
Figure 2. Clonogenic neoblasts display broad differentiation capacity
(A–C) Triple-labeling of individual colonies 22 days after irradiation. Shown are projections
through optical sections from irradiated animals. Left, tiled images (images from overlapping regions assembled) of representative animals with individual colonies are shown (anterior, up). Circles indicate approximate location of region imaged at high magnification for middle panels; middle images are optical sections with anterior to the right. Example differentiating cells from individual colonies labeled by IF (SMEDWI-1) and double FISH for gata4/5/6 and chat (A), gata4/5/6 and AGAT-1 (B), or AGAT-1 and chat (C) are shown. Proportions of colonies displaying multiple differentiating cell types are indicated. Roman numerals indicate double-positive cells, with individual channels shown in
NIH-PA Author Manuscript
NIH-PA Author Manuscript
columns to the right. Additional double-positive cells are indicated with arrowheads. See also Figure S12. (D) IF (BrdU) and double FISH (Smed-chat; Smed-mat) worms with BrdU-pulse days 14–18 after irradiation. Single colonies (n=7) contained both BrdU+; chat+ (neuronal) and BrdU+; mat+ (intestinal) descendants. Boxes indicate zoomed regions. (E) Scatterplots showing locations of individual colonies producing differentiated cell types (see also Figure S13). Colony cell differentiation was assessed by labeling with SMEDWI-1 (circles) or BrdU (diamonds). Scale bars, (A–C) left, 100µm; middle 20µm; right 5µm; (D) top image, 20µm; others 5µm.
NIH-PA Author Manuscript
NIH-PA Author Manuscript
Figure 3. Small numbers of cNeoblasts can restore tissue turnover and regenerative ability (A–B) Animals were irradiated at different doses. Some of these animals were fixed 7 days
post-irradiation (1,000 rads, 25 animals; between 1,125 and 1,875 rads, >38 animals/dose; for 6,000 rads, 26 animals) and labeled by smedwi-1+ ISH. (A) Representative smedwi-1+ ISH images. Anterior, left. (B) Colony numbers/worm are plotted (each dot represents one animal). (C) The percentage of animals with restored regeneration following irradiation (≥98 worms/dose were examined; animals were from the same irradiated cohort as in A–B). Data indicate 3 or more cNeoblasts were sufficient to restore regeneration (see also Table S1). (D) Normal head regeneration in 97/99 worms amputated 39 or 40 days after 1,250 rads. (E) Heads regenerated after irradiation contained differentiated neuronal (chat+), intestinal (mat-1+), and muscle (mhc-1+) cells (41/41 worms, 1,250 rads; 15/15 worms, 1,500 rads). SMEDWI-1+ cells were also restored (n=9/9 worms, 1,250 rads). Dotted lines, approximate amputation plane. Arrowheads, photoreceptors. Scale bars, 200µm (A), 20µm (D–E).
NIH-PA Author Manuscript
NIH-PA Author Manuscript
Figure 4. Single transplanted cNeoblasts display properties of clonal growth and multipotency
Irradiation-sensitive cells (polygonal gate) were identified by Hoechst 333342 labeling (A) and back-gated to set the X1(FS) gate (oval) based on size (FS) and complexity (SS) parameters (B). The X1(FS) fraction is heterogeneous and contains some cells
approximately 10µm in diameter with processes (arrowhead) (C). (D) Individual cells were loaded into needles (one needle used per injection) and transplanted into the medial, post-pharyngeal, parenchymal space of hosts. (E–F) FISH (smedwi-1) of a host immediately after transplantation. Anterior, up. Ventral surface shown. Zero (n=40/60) or one (n=20/60) smedwi-1+ cells were observed in all cases, with expected size and morphology. (F) is a zoomed image of (E). (G) Colony formation 9 days after irradiation, 6 days after transplant. Anterior, up. Ventral surface shown. Colonies of smedwi-1+ cells (arrowhead) appeared in
transplant recipients (n=23/100) but not in untreated animals (n=5). (H) IF (SMEDWI-1) and double FISH (Smed-gata4/5/6; Smed-chat) 33 days after irradiation, 30 days after transplant. Single colonies were observed (n=4/17); example differentiating cells from displayed colony are shown. Scale bars, 10µm (C), 50µm (E), 5µm (F) and zoomed images in (H), 20µm (H), 200µm (G).
NIH-PA Author Manuscript
NIH-PA Author Manuscript
Figure 5. Restoration of regeneration in lethally irradiated hosts by single transplanted cNeoblasts
(A) Representative images of transplant hosts. Tissue regression (asterisks) began anterior to
photoreceptors (arrowheads) and progressed from anterior to posterior (px, pharynges). Rescued animals developed blastemas (arrow) at regression site (dotted line) after seven weeks and fully regenerated after eight weeks. Anterior, up. Dorsal surface shown. (B) Representative images of rescue strains undergoing regeneration following amputation. Blastemas formed at approximate amputation plane (dotted line). Intestine (labeled with red food coloring) and photoreceptors (arrowheads) were observed in blastemas after 12 days of regeneration. Anterior, up. Dorsal surface shown. Scale bars, 1mm (A), 500µm (B).
NIH-PA Author Manuscript
NIH-PA Author Manuscript
Figure 6. Genotype conversion by single transplanted cNeoblasts
(A) Schematic showing replacement of host tissue by transplanted donor cells (blue);
animals for genotyping were amputated (dotted line) and allowed to regenerate twice. (B) PCR-RFLP analysis of rescued strains. Locus 00310 was cut by HpaI in sexual animals (S) but not asexual animals (A) or the rescued strains (1, 2, 3). Locus 00463 was cut by ScaI in asexual animals and the rescued strains, but not in sexual animals. (C) Haplotype
sequencing. Stacked histogram representing number of sequencing reads from each locus for each strain. Bars extend left for number of reads corresponding to the asexual haplotype and
NIH-PA Author Manuscript
NIH-PA Author Manuscript
right for number of reads corresponding to the sexual haplotype. Bar absence indicates no reads.