Publisher’s version / Version de l'éditeur:
Journal of Illuminating Engineering Society, 12, 3, pp. 197-203, 1983-04
READ THESE TERMS AND CONDITIONS CAREFULLY BEFORE USING THIS WEBSITE.
https://nrc-publications.canada.ca/eng/copyright
Vous avez des questions? Nous pouvons vous aider. Pour communiquer directement avec un auteur, consultez la première page de la revue dans laquelle son article a été publié afin de trouver ses coordonnées. Si vous n’arrivez pas à les repérer, communiquez avec nous à [email protected].
Questions? Contact the NRC Publications Archive team at
[email protected]. If you wish to email the authors directly, please see the first page of the publication for their contact information.
NRC Publications Archive
Archives des publications du CNRC
This publication could be one of several versions: author’s original, accepted manuscript or the publisher’s version. / La version de cette publication peut être l’une des suivantes : la version prépublication de l’auteur, la version acceptée du manuscrit ou la version de l’éditeur.
Access and use of this website and the material on it are subject to the Terms and Conditions set forth at
Effects of Haidinger's brushes on visual performance
Rea, M. S.
https://publications-cnrc.canada.ca/fra/droits
L’accès à ce site Web et l’utilisation de son contenu sont assujettis aux conditions présentées dans le site
LISEZ CES CONDITIONS ATTENTIVEMENT AVANT D’UTILISER CE SITE WEB.
NRC Publications Record / Notice d'Archives des publications de CNRC:
https://nrc-publications.canada.ca/eng/view/object/?id=50388069-4b83-4394-bf95-cf222ee2d27e https://publications-cnrc.canada.ca/fra/voir/objet/?id=50388069-4b83-4394-bf95-cf222ee2d27e
Ser
THl
N21d
,
10.
in44
,
National Research
Conseil national
C. 2
1
Council Canada
de recherches Canada
B r n
EFFECTS O F HAIDINGER'S BRUSHES ON VISUAL PERFORMANCE
by M.S. Rea
ANALYZED
Reprinted from Journal of IES April 1983 p. 197-
203 DBR Paper No.1144
Division of Building Research
&smlE
Les mesures p h o t o d t r i q u e s c l a s s i q u e s n e t i e n n e n t pas compte du degr'e n i d e l ' a n g l e d e p o l a r i s a t i o n d e l a lumikre r'efl'echie p a r d e s s u r f aces, n i de l a n a t u r e d i c h r o I q u e - b i r u r i n g e n t e de l ' o e i l humain.
Des
a n a l y s e s pr'eliminaires i n d i q u e n t quel e s
v a r i a t i o n s associ'ees3
une f o n c t i o n de t r a n s f e r t de l a performance v i s u e l l e peuvent&tre
r'eduites s i l ' o n t i e n t compte d e c e s e f f e t s d e p o l a r i s a t i o n . T o u t e f o i s , c e t t e r'eduction e s t extrsmement f a i b l e , c e q u i s i g n i f i e q u ' i l ne s e r a i t peut-&re p a s r ' e a l i s t e d e consid'ererles
e f f e t s d e p o l a r i s a t i o n dans c e s t y p e s d'exp'eriences. Les a n a l y s e s f o u r n i s s e n t a u s s i d e s preuves i n d i r e c t e s de s t r a t e g i e s de mouvement des yeux.Effects of Haidinger's brushes on visual performance
M. S.
Rea
Conventional photometric measurements account for neither the degree and orientation of polarization reflected from surfaces nor the dichroic- birefringent nature of the human eye. Preliminary analyses indicate that the variability associated with visual performance data can be reduced by accounting for these polarization effects. Reduction in variability is
extremely small, however, indicating that it might not be practical to account for these polarization effects in such experiments. Indirect evidence for eye movements is also provided by the analyses.
Introduction
A wide variety of data support the notion that a dis- crepancy can exist between photoelectrically deter- mined contrast and what people actually perceive, i.e., subjective Photometry does not ac- count for the relative polarization of the target and its background nor for the dichroic-birefringent na- ture of the human eye.4 This "polarization effect" of the eye can produce the well-known entoptic phe- nomenon called Haidinger's brushes. The appear- ance of Haidinger's brushes is dependent upon many factors, including the orientation of polarization in- cident on the cornea, individual difference~ in the polarization mechanisms of the eye, the fixation lo- cation of the individual with respect to the target, and the spectral distribution of the stimuli. For example, with targets spectrally distributed as cool white flu- orescent (CWF), subjects have on average a 2 percent difference in sensitivity to polarized test fields rela- tive to unpolarized test fields under controlled eye fixatiom5
I t is the purpose of this paper to discover whether it is possible to reduce the uncertainty associated with a function relating contrast to performance by taking into account the spectral distribution and polarization of the light reflected from a task as well as the magnitude of the dichroic-birefringent ana- lyser in the human eye. Data from a previous visual performance experiment6 have been re-examined to see whether these polarization effects are important. Because the polarization effect is dependent on fixation location, it should also be possible to gain information about eye position during the experi- ment, assuming that the polarization effect reduces uncertainty in the contrast-visual performance function.
AUTHOR: National Research Council of Canada, Ottawa, Ontario, Canada.
Background
The earlier visual performance experiment6 gives procedural details. Briefly, the subjects' task is to compare two number lists and note discrepancies as quickly and accurately as possible (Fig. 1). The adaption level is kept constant while the contrast is changed by "realistic" techniques (i.e., contrast is altered by such typical methods as ink pigment density, ink specularity, polarization of illumination, and lighting geometry). The spectral distribution of the target and the background are nearly identical to CWF. Performance score, a combination of speed and accuracy, is plotted against reference sheet photoelectric contrast (Fig. 2) where contrast (C) is defined as:
where
LB = background luminance (paper) LT = target luminance (ink).
As different lighting arrangements were used in the experiment, different degrees and orientations of polarization were reflected from the task. If polar- ization induces discrepancies between subjective contrast and photoelectric contrast, then the data plotted in Fig. 2 should demonstrate some "noise," because target and background polarization were not taken into account.
Measurement of the task stimuli
For the analyses in this paper the stimulus mate- rials that produced the abscissa values in Fig. 2 were re-examined and measured for polarization charac- teristics. Measurements were taken of the degree and orientation of polarization reflected from the ink calibration squares on the five types of stimulus sheets (including four reference sheets and a black
3
1935
3
1935
6632
1
6632
1
72958
72958
83
944
83944
391 17
391 17
51111
51111
06694
06694
85922
85922
424
16
42416
46583
46583
99254
99254
9243
1
H6
07408
07408
24010
240 10
89303
89303
05418
3 H 8
03574
03574
47539
47539
6
1337
w7
60627
60627
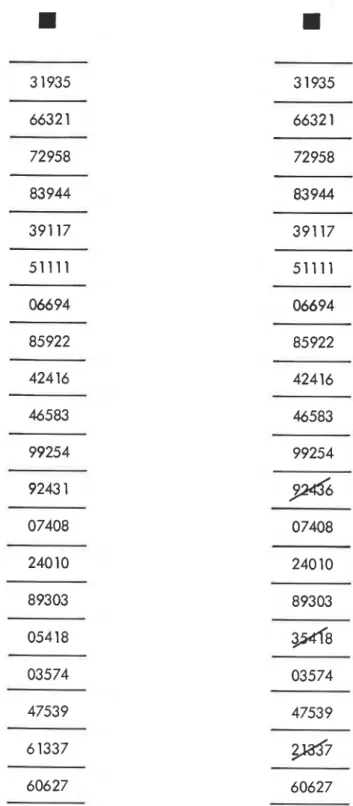
Figure 1. Stimulus configuration. Subjects were required
to search such lists for discrepancies. The reference list is on the left and the response list on the right.
matte response sheet) as well as the stimulus sheet backgrounds (see Fig. 1). The response sheet was printed with black matte ink, and the reference sheets with black matte, black gloss, gray matte or gray gloss inks. To do this, a variable dichroic ana- lyser (Polaroid, HN38) was used in front of the ob- jective lens of a Pritchard photometer (Model 1980A). Maximum and minimum analyser trans- missions produced a t each target and a t each adja-
20 - ERRORS s -- T I M E + 5 loo 46 I I I I I I t I 0 0.1 0.2 0.3 0.4 0.5 0 . 6 0.7 0.8 0.9 1 , 0 A B S O L U T F C O N T R A S T I C )
Figure 2. Visual performance score plotted against absolute
photometric ~ o n t r a s t . ~ Adaption level was held constant while contrast was changed by combinations of ink pigment density, ink specularity, polarization of illumination and incident angle of illumination. Score is a combination of time and errors.
cent background location in the lists were recorded at each list position. These maximum and minimum transmission values were either parallel (horizontal) or perpendicular (vertical) to the plane of the task, depending upon experimental conditions.
Following mark^,^ the degree of polarization (D) was computed by the formula:
max
-
minX 100 = D (in percent) (2)
max
+
minThese data are plotted in Fig. 3 (A-F). As the curves are fairly flat, the connected points were averaged (arithmetic mean). The averaged degrees of polar- ization reflected from the calibration squares and backgrounds were used in the subsequent calcula- tions.
Relating performance to contrast
The distance of the data points from the function selected to represent them depends to a large extent upon the suitability of the model used in deriving the curve; a good model accounts for more variability than a poor one. Recently, the visual system's re- sponse to increments of light has been modelled by a variety of researchers recording electrophysiological responses from various sites in the e ~ e . ~ , ~ This model has been likened to self-shunting electrical cir- c u i t ~ . ' ~ - ~ ~ Hood and his co-workers13J4 also used the same response function to model certain psycho- physical responses. (No one has attempted to model visual performance data having dependent measures like speed and accuracy). In the present experiment, an attempt was made to model visual performance using a function similar to those used in modelling both electrophysiological and psychophysical re- sponses:
0 B M l B L A C K M A T T E R E F E R E N C E l 3 B G I B L A C K G L O S S R E F E R E N C E I L L U o G M I G R E Y M A T T E R E F E R E N C E 1 G C ( G R E Y G L O S S R E F E R E N C E l 0 R E S P I B L A C K M A T T E R E S P O N S E 1 R E F E R E N C E S H E E T I B A C K C R O U N O l 75 0 R E S P O N S E S H E E T I B A C K G R O U N D l B O T T O M O F L I S T V I E W I N G A N G L E , d e g r e e s
Figure 3. Degree of polarization reflected from the cali-
bration squares on stimulus sheets at different list positions under experimental conditions. Three degrees of illumi- nation polarization were produced by different types of lu- minaire panels: Plexiglas and Mylar (PM), multilayer po- larizer (MP) and linear dichroic polarization (LP). Two in- cident angles of illumination were used: illumination from the mirror angle to a subject's eyes (0°), and illumination
from a subject's left (90' ). Four types of reference lists
were employed: black gloss (BG), black matte (BM), gray
T O P O F B O T T O M V I E W I N G A N G L E , d e g r e e s T O P O F L I S T O F L l S l L I S T
gloss (GG), and gray matte (GM). One type of response list was used throughout the experiment: black matte (RESP). A: 0°, PM B: 0°, MP C:
oO,
LP D: 90°, PM E: 90°, MP F: 90°, LPTable 1. Hypothetical effects of Haidinger's brushes. Orientation of polarization Y V H H Illustration of target and brush Fixation location b 9 0 9 (clock position)
Appearance to brighter darker darker brighter
sub] ect target target target target
XL < 1 XL < 1
Terms in equation
X = l X = 1 X = 1
where
Rmax = maximum response, or score, obtained a t a given adaptation luminance
R = response for a given target luminance
change
L = target luminance increment above, or
decrement below, threshold lumi- nance*
n = free parameter
k = half-saturation constant and another
free parameter.
The contrast data used in Fig. 2 (abscissa values
based on Eq. (1)) were transformed following Eqs. (4)
and (5) so as to put the target values in units suitable for Eq. (3).
Lk = LB(l
-
Ct) (4)where
Lk is derived threshold target luminance
Ct is threshold contrast; psychophysical
data,15 magnitude estimations, and settings of a Visual Task Evaluator16 were used to estimate threshold con- trast for these targets to be 0.055 LB is as in Eq. (1) and equal to 67 cd/m2 in
the performance experiment
and where L is as in Eq. (3) is as in Eq. (4) LT is as in Eq. (1). 400 410 I
0
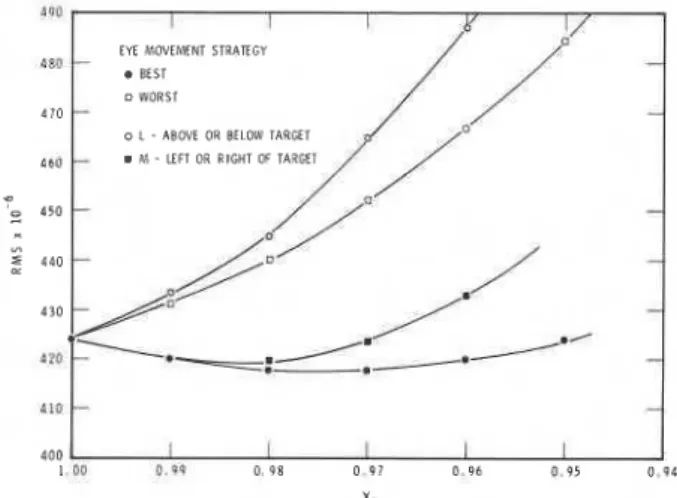
I80 P . 0 1 0.98 0.97 0.96 0.95 0 9 4Figure 4. Results of residual mean square (RMS) analysis; RMS is plotted as a function of Xi, the magnitude of the di- chroic-birefringent mechanisms producing Haidinger's brushes. The four curves correspond to hypothetical eye movement strategies employed by subjects in the experi- ment. The "best" strategy corresponds to eye positions that always maximize contrast. The "worst" strategy corre- sponds to eyes position exactly opposite that for "best." The "L strategy" corresponds to eye positions either below or above targets (numerals). The "M strategy" corresponds to eye positions consistently to the left or right of tar- gets.
For this analysis, light increments and decrements were assumed to have identical effects on the visual system. Allowing only n and k to vary, a series of it- erations was performed on the data in order to obtain the best values of the two parameters, i.e., the values that gave the lowest residual mean square (RMS).? The value of 1.02 was obtained for n; this is very close to the values obtained electrophysiologically12 and
the assumed value of n = 1.0 used in psychophysical
analyses.13J4 This agreement indicates that the vi- sion model (Eq. (3)) can be used to predict visual performance satisfactorily in this type of experi- ment.
Rationale for analysis
To see whether the dichroic-birefringent analyser influences subjective contrast in the performance experiment, transformations of Eq. (1) were per- formed following Eq. (6):
I
[LB(XLP+
X M ~ )-
L T ( X L ~+
XMS)]I/
LB(XLP
+
X M ~ ) = C (6)where
p = proportion of horizontally polarized
light reflected from the background
q = proportion of vertically polarized light
reflected from the background
Z(Yi - Y o 2 + RMS = N - P Yi - observed score Yf - predicted score N - number of cases
p - number of independent parameters estimated.
p + q = l
r = proportion of horizontally polarized light reflected from the target s = proportion of vertically polarized light
reflected from the target r + s = l
Lg, LT and C are as in Eq. (1) X i = attenuation of polarized light by the
dichroic-birefringent analyser in the eye for a given spectral distribution i = M or L.
Thus
X i = XM when fixation location is to the left or right of the target
X i = XL when fixation location is below or above the target.
X i can be applied in Eq. (6) either XL or
XM
since both are intended to have behavioral significance. Specifically, they are terms corresponding to the subjects' eye position relative to target location during performance of the task. XL corresponds to an eye position below or above the target; XM corre- sponds to a n eye position to the left or to the right of the target.$ The rationale behind the Xi values in Eq. (6) can best be shown by Table 1 and its illustra- tions.With regard to Table 1, four points should be noted:
1. The target (in this experiment, a numeral) can be schematized as a small circle reflecting elliptically polarized light, with energy primarily on the hori- zontal (H) or vertical (V) axis relative to the plane of the task.
2. The dichroic-birefringent analyser in the eye can be schematized by a prototype characterization of Haidinger's brushes, namely a darkened hour- glass.17 The hourglass is oriented vertically or hori- zontally, depending upon the primary axis of polar- ization reflected from the task. The orientation of the hourglass is perpendicular to the primary plane of polarization because less light is transmitted when the dichroic fibers are crossed with the primary axis of the light coming from the stimulus. Thus, when horizontally polarized light is reflected from the target the hourglass is vertical, and when vertically polarized light is reflected from the target the hour- glass is horizontal.$
-
3. The isthmus of the hourglass corresponds to the fixation point. Although the fixation point can be anywhere with respect to the target, only positions
XL and XM are terms less than 1.0 and are the hypothetical magnitudes of Haidinger's brushes. The XL term is always with the horizontal compo- nents ( p and I); XM is always associated with the vertical components (q and s). If the eye is to the left or right of the target during the experiment, the dichroic fibers cross the target in such a way as to decrease the brightness of the target when it is vertically polarized (s > r) and to increase the brightness of the target when it is horizontally polarized (r > s). (The background is relatively unpolarized.) As XM accomplishes this function in Eq. 6, it corresponds to an eye position to the left or to the right of the target whether it is vertically or horizontally polarized. XL accomplishes the same effect in Eq. 6 if the eye is above or below the target during the experiment. As XL and XM are mutually exclusive, when one term is not equal to 1.0 the other term must be equal to 1.0.
5 The complete hrushes would not he observed when only the target is polarized. The illustration shows the "potential" brushes for an entire field emitting polarized light.
at 12,3,6, and 9 o'clock are of interest. These are the points of maximum effect, and thus are the points to which fixation must be biased if the Haidinger's brush effect is to be discovered.
For the sake of illustration, only 9 o'clock and 6 o'clock fixation positions were drawn. These points would be equivalent to 3 o'clock and 12 o'clock, re- spectively, if the macular dichroism were symmetric about the fixation point. There is no evidence to suppose otherwise.
4. Because the stimulus paper is matte, the target ink was always more polarized than the background paper (Fig. 3, A-F). For the sake of the illustration (but not analysis), therefore, the background should be assumed to be unpolarized.
Hypotheses
By varying XL and XM in Eq. (6) and comparing the RMS values, several hypotheses can be tested. First, it is possible that subjects might attempt to maximize subjective contrast. Thus if a target reflects relatively more horizontally-polarized light (the background being relatively unpolarized), then to increase the contrast of a target reflecting less total light than the background, subjects should look im- mediately below (or above) the target. In this way, the subject can take advantage of the cross-polar- ization produced by the analyser in the eye (column C in Table I). Under these conditions XL would apply in the equation. Conversely, if the target re- flects vertically polarized light, the optimum strategy would be to look to the left or right of the target (column B in Table 1). Thus XM would apply in the equation for these conditions. If the target is brighter than the background, then the opposite strategies are best (columns D and A, respectively).
To see whether subjects' data were consistent with such a strategy to improve contrast, XL and XM values were appropriately substituted in Eq. (6) and the contrast recomputed. To see whether the trans- formation reduced the variability of the data asso- ciated with the function (Eq. (3)) the new RMS val- ues were obtained with X i values between 1.0 and 0.95 to bracket possible magnitudes of Haidinger's brushes. If the transformation characterizes the performance strategy, i.e., the eye movements of the subjects, then the RMS should go down with smaller values of Xi until it reaches a minimum at 0.98 (the estimated magnitude of Haidinger's brushes under a C WF spectral distribution5) and then begin to in- crease.
To gauge these new RMS values, opposite substi- tutions were employed (XL for XM and XM for XL), in essence providing a control condition. This would characterize the worst eye movement strategy one could use to improve contrast. If there is no differ- ence in the absolute RMS values obtained for the two hypothetical eye movement strategies, then it would appear that subjects have not used these strategies or that the RMS analysis was inappropriate.
A second hypothesis requires XM to apply irre- spective of the contrast changes induced by the an- alyser in the eye. Eye movement datalsJg indicate that people use stereotyped saccadic eye movements
when looking a t printed text. When reading a para- graph, for example, subjects move their eyes left to right along a row of printed characters. (This strategy
would be schematized in columns B and D, Table 1.)
In this experiment the configuration of the stimulus materials is much like the stimuli in the eye move- ment studies. If subjects behaved in this way, the lowest RMS values would therefore occur when XM was used in Eq. (6); XM is used to characterize eye movements to the left and right along the row of numerals. (It should be emphasized that even if the contrast and thus the scores were lowered, the RMS would be lower because, according to the hypothesis, the transformation would better characterize the eye movements employed by the subjects in the experi- ment.) Conversely, if subjects always looked below or above the target, then the RMS would be lower when XL was employed in Eq. (6). There is no evi- dence for this supposition, but it is a testable hy- pothesis and one that can gauge the XM hypothesis. As with the first hypothesis, one would expect the RMS values to be minimal a t 0.98 for the more suit- able hypothesis (XM or XL) if the analyser in the eye influenced subjective contrast in the performance experiment.
A third hypothesis (included in the previous two)
centers round the magnitude of Xi. Because the ink and the background paper were spectrally distrib- uted like CWF, one should obtain a minimum RMS
a t or near values of Xi = 0.98, the estimated magni-
tude of the dichroic-birefringent mechanisms in the
eye for a CWF spectral d i ~ t r i b u t i o n . ~ I t should be
stressed that this third hypothesis depends upon the aptness of an eye movement hypothesis. If an ex- perimental hypothesis does not properly characterize the subjects' behavior, then the RMS values will not change, worsen, or minimize at some other value. Thus, the third hypothesis is not independent of the other two.
Results of the RMS Analysis
Figure 4 presents the results of the RMS analysis. Moving one's eyes to the position that leads to the lowest contrast (worst) and always looking below or
above the target (L) are less appropriate in ac-
counting for the data than applying no coefficient
, (i.e., Xi equal to 1.0). On the other hand, moving one's
eyes to the best position for improved contrast (best) and looking to the left and right of the target (M) are more appropriate. Importantly, the two functions (the RMS functions for the so-called "best" strategy and the "left-right" strategy) were minimum near 0.98, indicating that the magnitude of the dichroic- birefringent polarization in the eye is in the neigh- borhood of 2 percent under a CWF spectral distri- bution. This estimate agrees with the 2 percent es- timate obtained in the experiment in which fixation was ~ o n t r o l l e d . ~
The similarity between the "left-right" and the "best" eye movement strategies implies that per- formance can be improved simply by moving the eyes left to right when reading these materials. If one computes the potential score improvement after the data are transformed according to the "best" strategy
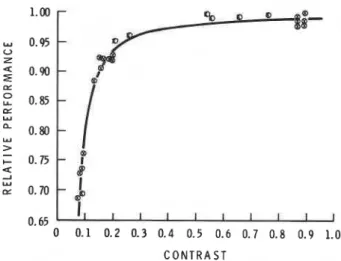
C O N T R A S T
Figure 5. Relative performance as a function of photometric contrast and contrast transformed to account for Haidinger's brushes. Curve fit based upon Eq. (3) and "best" eye movement strategy where n = 1.07 and k = 0.833.
and according to the "left-right" strategy, there is
very little difference. When Xi = 0.98, the "best"
strategy provides an over-all score improvement of 0.55 units while the "left-right" strategy increases the score by 0.33 units, both in relation to Xi = 1.0. The fact that the "best" strategy had a slightly lower RMS than the "left-right" strategy indicates that subjects may have deviated from the "left-right" strategy to improve contrast.
Minimization of RMS for the "left-right" and
"best" strategies at Xi = 0.98 supports the hypothesis
that the magnitude of dichroic-birefringent attenu- ation under a CWF spectral distribution was 2 per- cent. This indicates that polarization needs to be accounted for in order to reduce the variability in visual performance data.
Nevertheless, two points should be made. First, these are preliminary data and move evidence should be obtained (e.g., with an eye marker) about whether
it is worth making extensive measurements to de-
termine the polarization of the light reflected from the task (e.g., Fig. 3, A-F). Second, the RMS reduc- tion is very small. The circles in Fig. 5 are data from Fig. 2 using a relative performance ordinate. The "X" points in Fig. 5 were obtained from the transformed contrasts (Eq. 6), assuming the "best" eye movement
strategy and Xi = 0.98. It is apparent that the
transformed data are only marginally different from the circles, based upon conventional photometry. Thus, if the polarization reflected from the task materials is ignored, the scatter about the curve is increased only slightly.
In summary, the analyses indicate that variability in the visual performance data can be reduced by accounting for the polarization of the light reflected from the task and for the dichroic-birefringent ana- lyser in the human eye. The data are only prelimi- nary, however, and should be viewed with caution. Further, even if the data and the analysis were completely substantiated by more measurements, accounting for the polarization effect in the eye would
only marginally improve predictions of performance in this type of experiment. Lastly, the data indicate that subjects employed eye movements similar to those documented for other printed material. They may also have deviated from this strategy somewhat to improve contrast.
Acknowledgment
The author would like to thank Mr. B. Guzzo for assistance with the analyses and for making the photometric measurements. This paper is a contri- bution from the Division of Building Research of the National Research Council of Canada and is pub- lished with the approval of the Director of the Divi- sion.
References
1. R. A. Bone, "The role of the macular pigment in the detection of polarized light," Vision Research, Vol. 20, 1980, p. 213.
2. W. W. Somers and G. A. Fry, "The role of macular pigment in heterochromatic photometry," Private Communication.
3. H. L. DeVries, A. Spoor, and R. Jielof, "Properties of the eye with respect to polarized light," Physica, Vol. 19, 1953, p. 419. 4. M. S. Rea, "Photometry and visual assessment of polarized light under realistic conditions," JOURNAL OF THE ILLUMINATING ENGINEERING SOCIETY, Vol. 11, No. 3, April 1982, p. 135.
5. M. S. Rea, "Haidinger's brushes with common spectral distri- butions," BR Note 173, National Research Council of Canada, Division of Building Research, 1981, p. 22.
6. M. S. Rea, "Visual performance with realistic methods of changing contrast," JOURNAL OF THE ILLUMINATING ENGI- NEERING SOCIETY, Val. 10, No. 3, April 1981, p. 164.
7. A. M. Marks, "Multilayer polarizers and their application to
general polarized lighting," ILLUMINATING ENGINEERING, Vol. 54, No. 2, February 1959, p. 123.
8. K. I. Naka and W. A. H. Rushton, "S-potentials from colour units in the retina of fish (cyprinidae)," Journal of Physiology, Vol. 185,1966, p. 536.
9. R. M. Boynton and D. N. Whitten, "Visual adaptation in monkey cones: Recordings of late receptor potentials," Science, Vol. 170, 25 Dec. 1970, p. 1423.
10. W. R. Loewenstein, "The generation of electric activity in a nerve ending," Annals of New York Academy of Sciences, Vol. 81,1959, p. 367.
11. W. R. Loewenstein, "Excitation and inactivation in a receptor membrane," Annals of New York Academy of Sciences, Vol. 94, 1961, p. 510.
12. L. E. Lipetz, "The transfer functions of sensory intensity in the nervous system," Vision Research, Vol. 9,1969, p. 1205.
13. D. C. Hood and M. A. Finkelstein, "Comparison of changes in sensitivity and sensation: Implications for the response-in- tensity function of the human photopic system," Journal of Ex- perimental Psychology: Human Perception and Performance, Vol. 5, No. 3, 1979, p. 391.
14. D. C. Hood, M. A. Finkelstein, and E. Buckingham, "Psy- chophysical tests of models of the response function," Vision Research, Vol. 19, 1979, p. 401.
15. H. R. Blackwell, "Contrast threshold of the human eye," Journal of the Optical Society of America, Vol. 35, No. 11,1946, p. 624.
16. H. R. Blackwell, "Development of procedures and instruments for visual task evaluation," ILLUMINATING ENGINEERING, Vol. 65, No. 4, April 1970, p. 267.
17. J. Walker, "Studying polarized light with quarter-wave and half-wave plates of one's own making," Scientific American, Dec. 1977, p. 172.
18. A. L. Yarbus, "Eye movements and vision," New York, Ple- num, 1967.
19. K. Rayner, "Eye movements in reading and information processing," Psychological Bulletin, Vol. 85, No. 3, p. 618, 1978.
This publication is being distributed by the Division of Building R e s e a r c h of the National R e s e a r c h Council of Canada. It should not be reproduced i n whole o r in p a r t without p e r m i s s i o n of the original pQblisher. The Di- vision would be glad to b e of a s s i s t a n c e in obtaining such p e r m i s s i o n .
Publications of the Division m a y b e obtained by m a i l - ing the a p p r o p r i a t e r e m i t t a n c e (a Bank, E x p r e s s , o r P o s t Office Money O r d e r , o r a cheque, m a d e payable
to t h e R e c e i v e r G e n e r a l of Canada, c r e d i t NRC) to the National R e s e a r c h Council of Canada, Ottawa. K1A 0R6. Stamps a r e not acceptable.
A l i s t of allpublications of the Division i s available and m a y be obtained f r o m the Publications Section, Division of Building R e s e a r c h , National R e s e a r c h Council of Canada, Ottawa. KIA OR6.