HAL Id: hal-01848009
https://hal.archives-ouvertes.fr/hal-01848009
Submitted on 22 Jan 2021HAL is a multi-disciplinary open access archive for the deposit and dissemination of sci-entific research documents, whether they are pub-lished or not. The documents may come from teaching and research institutions in France or abroad, or from public or private research centers.
L’archive ouverte pluridisciplinaire HAL, est destinée au dépôt et à la diffusion de documents scientifiques de niveau recherche, publiés ou non, émanant des établissements d’enseignement et de recherche français ou étrangers, des laboratoires publics ou privés.
A critical review of the T(LIESST) temperature in spin
crossover materials – What it is and what it is not
Guillaume Chastanet, Cédric Desplanches, Cherif Baldé, Patrick Rosa,
Mathieu Marchivie, Philippe Guionneau
To cite this version:
Guillaume Chastanet, Cédric Desplanches, Cherif Baldé, Patrick Rosa, Mathieu Marchivie, et al.. A critical review of the T(LIESST) temperature in spin crossover materials – What it is and what it is not. Chemistry Squared - Chem2, Science2, 2018, 2, pp.2. �10.28954/2018.csq.07.001�. �hal-01848009�
Review
doi: 10.28954/2018.csq.07.001 1
A critical review of the T
(LIESST) temperature
in spin crossover materials – What it is and what
it is not
Guillaume Chastanet a,*, Cédric Desplanches a, Chérif Baldé a,b,
Patrick Rosa a, Mathieu Marchivie a, Philippe Guionneau a
Email(s): guillaume.chastanet@icmcb.cnrs.fr
a CNRS-Université de Bordeaux, ICMCB, UMR 5026, 87 av. du Dr. A. Schweitzer, Pessac, 33608 France b Laboratoire de Chimie et Physique des Matériaux (LCPM), Université Assane Seck de Ziguinchor
Bp: 523 Ziguinchor, Sénégal.
Abstract: Light-Induced Excited Spin-State Trapping has been studied since 1982 in solution and 1984 in solid state as it offers a reversible way of photoswitching the electronic configuration of spin crossover systems. Since then, the lifetime of the photo-induced state was deeply investigated through kinetics measurements. In 1998, a fast and easy way to record the limit temperature above which the photo-induced state is erased, denoted T(LIESST), was introduced. This procedure has been widely used in the spin crossover community due to its easiness and its efficiency to provide detailed information on the photo-induced state. Correlations between T(LIESST) and structural parameters have been proposed for instance. However, it intrinsically contains drawbacks that can lead to misinterpretation of behaviours and can lead to an over-estimation of its scope. This review aims to present and discuss not only the correct way to measure T(LIESST) but also the essential contributions it has brought and the limits not to be exceeded in its interpretation.
Keywords: Light-Induced Spin Switching, Metastable state lifetime, Structural distortion, Functional materials, Molecular switches, Photophysics.
I. Introduction
The Spin CrossOver (SCO) phenomenon is a change of the electronic configuration of a metal ion induced by external stimuli [1]. This change is associated with drastic modifications of the ligand field strength, molecular and crystal structures, microscopic and macroscopic volumes, magnetic and electronic properties such as colour, conductivity or dielectric characteristics. Among the different perturbations used, temperature and light are probably the most studied in comparison with other stimuli such as pressure for example [2]. While increasing the temperature can basically be viewed as a source of energy allowing electrons to be promoted from t2g to eg orbitals, irradiation by light can act in different ways thus
offering a wider range of possibilities. Indeed, wavelength can be adjusted to specific transitions (d-d, MLCT, LMCT, LLCT…) of the compound leading to different photo-induced processes. In this way, for instance, ligand conformation changes can be induced by light irradiation (photo-isomerization or cyclization) leading to a ligand field change consequently tuning the global SCO behaviour. This is typically the case for the Ligand-Driven Light-Induced Spin Change (LD-LISC) [3] and the Light-Driven Coordination-Induced Spin-State Switching (LD-CISSS) [4] phenomena. In addition, when the excited transition involves the metal centre, (d-d or metal-ligand charge transfer transitions) some transient excited states can be populated leading to photo-induced spin-state switching. This is the case in the widely studied Light-Induced Excited Spin-State Trapping (LIESST) effect [5] that is at the heart of the work presented here. Finally, there is a third action of light related to the energy deposited into the material. Depending on the number of photons, a strong heating may occur, leading to photo-thermal effects that allows the occurrence of spin crossover [6]. Therefore, using light affords selective and reversible spin state switching opening a wide field of creativity from functional materials towards applications. On top of that, light can
Chem2, 2018, 2-2
2 operate on an ultrafast time scale since photoswitching can be achieved within less than one picosecond [7]. The combination of a fast and selective input with fast readout of the spin state paves the way for ultrafast data manipulation.
Most of the studies so far have been conducted on iron (II) complexes since they may exhibit a diamagnetic (low spin, LS) to paramagnetic (high spin, HS) crossover, therefore with a sharp contrast of the physical and structural properties between the two phases. The first study of the LIESST effect was done in solution in 1982 by McGarvey et al. using laser flash photolysis to probe the dynamics of the spin equilibrium [8]. This technique uses laser light with its wavelength centred on d-d or MLCT absorption bands of the complexes. In 1984, Decurtins et al. investigated the LS→HS* photoswitching in the solid state (HS* refers to the photo-induced HS state). Studying [Fe(ptz)6](BF4)2 (ptz = 1-propyl-1H-tetrazole) crystals by
absorption spectroscopy, irradiation in the absorption band of the LS state (514 nm) induced population of a metastable HS* state [5]. This phenomenon, observed at low temperatures (below 50 K), was named Light-Induced Excited Spin-State Trapping (LIESST) to describe the fact that light allowed the population of an excited metastable state with a long lifetime at cryogenic temperatures. Two years later, an irradiation at 820 nm into the absorption band of the photo-excited HS* state evidenced population of the LS ground state, proving the reversibility of the LIESST process, later referred to as reverse-LIESST [9]. That discovery has led to numerous investigations to clarify e.g. the mechanism of photoswitching from the molecule to the material scale, the different nature and timescales of the intervening transitions and intersystem crossings, and the lifetime of the final photo-induced state [10]. In particular structural investigations went from the first crystal structure of a sample in the light-induced HS state in 2001 [11] to charge density studies of the metastable state [12] and recent pioneering ultrafast crystallography studies of the photo-induced SCO mechanism [13]. Indeed spectroscopic ultrafast techniques, with a strong feedback of advanced ab initio calculations [14], have been intensively used in the last decade on some simple Fe(II) compounds such as [Fe(bipy)3]2+ [15] (bipy=2,2’-bipyridine) or [Fe(tpy)2]2+ [16]
(tpy= 2,2′:6′,2″-terpyridine), taken as models for the photophysical processes in other metal transition complexes. One of the crucial aspects, obviously, concerns the lifetime of the photo-induced state. Two methods can be used to record it. One way is the detailed analysis of the relaxation kinetics to extract the activation energy parameters. This approach requires the recording of isothermal HS*→LS relaxations at different temperatures in order to build the Arrhenius plot and to extract the activation energy parameter. The detailed works of Hauser et al., using such a method, have allowed the identification of a temperature independent tunnelling region as well as a thermally activated region for the relaxation, and have clarified the role of cooperativity in the material [17]. Indeed, cooperativity plays a crucial role in the relaxation kinetics since self-acceleration and non-linear behaviours are observed. Note that the paramount role of cooperativity in this process is confirmed by ultrafast crystallography that shows that a single photon can transform more than 7 molecules [18, 19].
The other way to follow the lifetime of the metastable state is by measuring the “relaxation temperature” called T(LIESST). In 1986, Herber et al. used Variable-Temperature Fourier Transform Infrared Spectroscopy (VT-FTIR) to follow the thermal evolution of the metastable HS* state [20]. This study was based on the different infrared fingerprints of the HS and LS states of [Fe(phen)2(NCS)2] (phen =
1,10-phenanthroline) allowing identification of the state under light-irradiation. Based on that, the authors defined a temperature T2 above which the light-induced phenomenon was no longer observable with
the technique used. The idea of recording the “relaxation temperature” above which the metastable HS state is erased was followed by Létard et al. [21] with the idea of offering a simple and quick way to compare compounds in regards to their interest for light-induced SCO. Based on magnetic characterizations, using a SQUID magnetometer, the magnetic response was followed upon light irradiation at 10 K and after irradiation in the dark upon slow heating at 0.3 K/min. When reaching the thermally activated region of the relaxation, the photo-induced HS state was efficiently erased and the LS state was recovered. The
T(LIESST) temperature was defined as the inflexion point of this relaxation in the thermally activated
region and determined by the minimum of the ∂χMT/∂T curve. Applying this very same procedure to more
than 50 compounds successfully allowed the comparison of T(LIESST) with the thermal spin crossover temperature T1/2 and to propose some structure-properties relationships of importance to identify chemical
parameters favouring the increase of this relaxation temperature [22].
The T(LIESST) temperature afforded fast evidence of the temperature region at which the photo-induced state was easily observable. It has been widely applied for many studies, sometimes without particular cautions either in the way it was recorded or on the interpretation. In this review, we want to recall the initial procedure and emphasize overall what kind of information the recording of T(LIESST) can bring and what it cannot.
Chem2, 2018, 2-2
3
II. The T(LIESST) measurement and database
As mentioned above, the protocol for the measurement of T(LIESST) was arbitrarily fixed initially (10 K, light on, wait for saturation, light off, scan rate of 0.3 K/min). The correct observance of this procedure ensures that results are comparable from one compound to the other. The measurement of T(LIESST) therefore gives a number to discuss the HS*→LS relaxation and reflects the temperature above which the SCO information cannot be kept for more than a few minutes. Figure 1 shows an archetype example of the T(LIESST) measurement done on the mononuclear compound [Fe(dpp)2(NCS)2] (dpp =
dipyrido[3,2-a:2’,3’-c]phenazine) using a SQUID magnetometer [23]. The magnetic response is expressed as the χMT
product (χM stands for the molar magnetic susceptibility and T the temperature). Light irradiation is applied to the material at low temperature (10 K) in the diamagnetic LS state to induce the population of the paramagnetic HS* state. This increase of the HS* population can be followed by the increase of the magnetic signal as a function of time. The irradiation is stopped when photosaturation is reached, i.e. a plateau is reached. Afterwards, the temperature is slowly increased at a rate of 0.3 K/min, while the magnetic behaviour is recorded continuously. A slight increase in χMT is often observed between ca. 10-20
K and can be attributed to the zero-field splitting of the HS* state for a Fe(II) ion in a non-ideal octahedral environment. Apart from this purely magnetic evolution, the population of the light-induced HS* state remains almost constant up to 40-50 K since in this region the relaxation process is governed by quantum tunnelling through the energy barrier. Above this region, the relaxation process becomes thermally activated and the efficient relaxation induces a decrease in the χMT product that recovers its initial value.
The T(LIESST) temperature is determined by the minimum of the ∂χMT/∂T curve.
Figure 1. a) T(LIESST) experiment recorded for the mononuclear [Fe(dpp)2(NCS)2] complex [23] with
(o) the temperature dependence of MT recorded in the cooling and warming modes without irradiation,
(∆) the change recorded during 1h of irradiation at 10 K, and (■) the behaviour recorded during the warming mode (0.3 K/min) when the light irradiation was switched off. The inset reports the ∂χMT/∂T
curve. b) [T1/2; T(LIESST)] database. Violet diamonds and green circles stand for complexes based on
mono- and bidentate ligands. Blue circles stand for tridentate ligand-based complexes, belonging mainly to the [Fe(bpp)2]X2·S family. The orange triangle relates to a macrocyclic ligand and purple stars to 3D
Prussian blue analogs.
From the determination of the T(LIESST) value of several compounds, a comparison could be made in order to draw trends for chemists to increase the lifetime of the photo-induced state [22]. In particular, the correlation between T(LIESST) and T1/2 was evidenced based on a [T1/2; T(LIESST)] database, still
growing today. The aim of this paper is not to recall how this database was built but to clarify what information it can provide. From this [T1/2; T(LIESST)] database, Létard et al. observed a linear
dependence between T(LIESST) and T1/2 and extracted the empirical relationship T(LIESST) = T0 – 0.3T½
where T0 is the initial value of the linear function. This linear relationship agrees with the “inverse energy
Chem2, 2018, 2-2
4 the HS*→LS relaxation. Remarkably, this linear relationship was also obtained contemporaneously on the sole basis of structural studies (see below III.1) [24]. Therefore, discrete values of T0 obtained from this
experimental dependence of T(LIESST) with T1/2 were used to define so called "T0 lines" (Figure 1). The
latter reflects the relationship between T1/2 and the zero-point energy difference that separates the HS and
LS potential wells (Figure 2). Moreover, a detailed investigation of the isothermal relaxation kinetics of the photo-induced HS* state at different temperatures, similar to the pioneering investigations of Hauser
et al. [17] allowed the determination of the energy barrier for each compound, and the perfect simulation
of the thermal relaxation curve [22e]. It illustrated that this approach was coherent with previous investigations, leading to a comparable view of the compounds’ behaviours after photo-excitation.
Figure 2. Sketch of the LS (blue) and HS (red) potential wells in the isotropic breathing model (left) and in the anisotropic breathing model (right) for polymorphs I (highly distorted) and II (weakly distorted) of
the [Fe(PM-BiA)2(NCS)2] compound, as function of the Fe-N bond length and the distortion parameter
(adapted from reference [40b]).
Additionally, it was particularly noticed that families of compounds belong to specific T0 lines. The most
illustrative example is the [Fe(bpp)2]X2·S family of homoleptic complexes based on tris-heterocyclic
N,N,N-tridentate ligand with bpp = 2,6-di-(1H-pyrazol-1-yl)pyridine (1-bpp) or 2,6-di-(1H-pyrazol-3-yl)pyridine
(3-bpp), X = anion and S = solvent molecules [25]. This family, including tens of compounds with different
anions, solvent or functionalized bpp ligands, aligns along a T0 = 150 K line, together with different
solvatomorphs. It was thus concluded that the fact that families of compounds align along a specific line allows the study of the influence of parameters on the T(LIESST) value.
III. Strengths of the T(LIESST) measurement
III.1- Structure-properties relationships
One of the main initial challenges for the design of relevant photo-switchable SCO compounds was to identify the crucial chemical and structural parameters that allow the tuning of the relaxation rate and consequently the T(LIESST) value. Since 1984, many studies have been undertaken giving important clues on ways to tune the lifetime of the photo-induced state. There are two levels at which chemistry can act: the molecule and the surrounding network.
The “inverse energy gap law” has given some useful trends. The transition temperature T1/2 reflects the
required thermal energy to induce the LS→HS switching and therefore primarily depends on the ligand field strength. However, since it equals ∆H/∆S, it depends also on the global entropy of the material and many parameters may affect this value. Therefore, the crystal packing obviously plays a key role both on the thermal spin crossover feature as often and early evidenced [19, 26-28]and on the lifetime of the metastable state. For instance, in solid solutions the size of the host network strongly tunes the quantum tunnelling relaxation rate [17]. Hence, cadmium and manganese of larger size than Fe(II) in its HS state, stabilize the HS state by exerting a ‘‘negative” internal pressure. It induces an important decrease of T1/2
Chem2, 2018, 2-2
5 N6 pseudo-octahedral environment typical of Fe(II) SCO), with a similar ionic radius as the Fe(II) HS
state, induces no change in T(LIESST) but shifts T1/2towards lower temperatures. Finally, nickel with an
almost intermediate ionic radius between HS and LS Fe(II) generates a slight decrease in T(LIESST) and
T1/2with increasing doping level [29]. There are also a plethora of examples showing the effect of anion
size or crystallized solvent molecules on the thermal spin crossover temperature and therefore on the relaxation of the photo-induced state [25, 30, 31].
From the molecular point of view, the non-adiabatic multiphonon theory [32] and Hauser et al. works [17] have evidenced that the bigger the metal-ligand bond length variation, the bigger the separation between the potential wells, and by consequence the slower the relaxation. However, this one-parameter description suffers in the face of experimental evidence, which shows that parameters other than the bond length variation have to be taken into account. Indeed, studies using phosphorus ligand-based complexes that present larger metal-ligand bond-length variations [33], have shown some photoswitching effects without any clear improvement compared to nitrogen-based ligands [34]. It was always thought that cooperativity favours long-lived photo-induced states [35], but then it is difficult to explain why strongly cooperative materials rarely exhibit photoswitching [36]. From the [T1/2 ;T(LIESST)] database, it was proposed that
the lowest T0 values are found in complexes based on monodentate ligands, while the highest values
correspond to pentadentate macrocyclic ligands. It means that, at a given transition temperature T1/2, the
T(LIESST) increases as a function of the denticity of the ligand. To complete this description, the stiffness
of the coordination sphere was also suspected to play an important role. However, the most promising parameter that would favour long-lived metastable states is the distortion of the coordination sphere. In a strong way, it implies that the single configurational coordinate with two simple two-dimensional potential wells is not valid. This follows from the non-isotropic bond-length variation upon spin crossover [28] (Figure 2). From structure-properties relationships based on structural experimental data, it appeared that
T(LIESST) increases with the distortion of the coordination sphere [24]. A screening of some iron(II) SCO
complexes clearly demonstrated that, provided similar bond lengths and crystal packings, the trigonal distortion of the coordination polyhedron varies linearly with T(LIESST) [24]. It was then evidenced that the highest T(LIESST) should be obtained for the largest modification of the trigonal distortion from HS to LS [24, 26, 28].This empirical observation has been confirmed so far, and the highest T(LIESST) for an iron(II) molecular complex corresponds indeed to the largest observed polyhedron distortion [37]. Interestingly, since T1/2was also evidenced as depending on the trigonal distortion, a linear dependence of
T(LIESST) and T1/2was confirmed on the basis of structural data and a comparison of the relationships
allow one to envisage the temperature range for a given family of SCO compounds (Figure 3). Interestingly, theoretical calculations on the trigonal distortion later confirmed the crystallographic observations [14a,38]. The above result gives a clear guideline for the design of SCO materials and reciprocally it validates the relevance of the T(LIESST) measurement.
Based on the above assumptions, the effect of distortion on the energy barrier is sketched, showing that for a given bond length variation, the increase in the distortion parameter, increases the height of the energy barrier [17b, 19, 39, 40b] (Figure 2). The inner coordination sphere geometry is then confirmed as the key scale to tune the lifetime of the photo-induced state. At a larger scale, the molecular packing acts as a perturbation that can modulate this lifetime in agreement with the inverse energy gap law. The building of the [T1/2; T(LIESST)] database, based on magnetic and structural data, has therefore given important
clues and trends to improve the lifetime of the photo-induced state. III.2- Further predictive abilities
The fact that families of compounds tend to align along a given T0 line like the [Fe(bpp)2]X2·S family on T0
= 150 K or [Fe(L)2(NCX)2] on T0 = 100 K line (where L is a bidentate ligand as phen, bpy, and many
others… and X = S, Se, BH3, BPh3) gives some predictive character to the [T1/2 ; T(LIESST)] database.
Indeed, when a compound is identified as belonging to a family of compounds, especially regarding the denticity of the ligand involved in the complexation, its properties almost always prove to fall on the related
T0 line which shows the relevance of the method. The already cited bpp family perfectly exemplifies this
point [22]. However, interestingly, some - rare - compounds fall apart from the “family line” they should follow. This is typically the case of the [Fe(PM-BiA)2(NCS)2] polymorphs I and II (PM-BiA =
N-(2-pyridylmethylene)aminobiphenyl) that belongs to the larger family of the formula [Fe(PM-L)2(NCX)2]
(with X=S or Se, and PM-L = N-(2-pyridinemethylene)) functionalized by L, an aromatic function) [40]. Most of the compounds of this family align along the T0 = 100 K line except phase I of the PM-BiA
Chem2, 2018, 2-2
6 both phases of this compound, the distortion of the coordination sphere in phase I is much higher than in phase II (Figure 2, left) [24, 40b].
Figure 3. The modification of the trigonal distortion [28, 24, 26] from HS to LS, denoted , for iron(II) complexes belonging to the same family [Fe(L)2(NCX)2] with L a bidentate ligand and X = S or
Se, is compared to their T(LIESST) (circle) and T1/2 (square) values. The zone where a LIESST effect
may be observed is thus delimited (zone 3), giving indications on the maximum T(LIESST) that should be observed for this family (here about 125 K). This correlation is made feasible since all the compounds have similar metal ligand bond lengths and relatively close crystal packings. Adapted from reference [24. The role of distortion was additionally pointed out to explain an unexpected result on a homoleptic compound based on tridentate terpyridine, tpy, ligand [17b, 39c]. Deviations from the “family line” can also find their origin not at the coordination sphere scale but at the crystal packing scale. For example, recently, compounds from the bpp family [Fe(L1)2](BF4)2·S were shown to deviate from the T0 = 150 K
line due to a photo-induced crystallographic phase transition [41]. Various solvates of the [Fe(L1)2](BF4)2·S
compound (L1 = 4-(Isopropylsulfanyl)-2,6-di(pyrazol-1-yl)pyridine) were synthesized and characterized.
While most of the solvates align on the same line, one significantly falls close by. Crystallography evidenced the occurrence of symmetry breaking upon cooling and light irradiation that reduces the symmetry of the crystal packing. This symmetry lowering was suspected to lower the global entropy of this phase, leading to an artificial increase in its T1/2 value and therefore a lowering of T(LIESST) according to the empirical
T(LIESST) vs T1/2 relationship observed. Consequently, keeping in mind the above limitations, when the
T0 line is known for a family of compound, the correlation between T(LIESST) and T1/2allows one to
roughly anticipate the value of the former when knowing the latter, or conversely. It cannot be taken as a rule but as an indication that unusual phenomenon may take place.
Another predictive aspect brought by the [T1/2; T(LIESST)] database concerns the overlap between the
T(LIESST) and the thermal spin crossover curves. This overlap corresponds to the grey region of Figure
1b where the lifetime of the metastable HS* state matches the dynamics of the thermal spin crossover. Based on the structural distortion point of view, it corresponds to zone 1 in Figure 3. It therefore induces spin state freezing also called spin crossover inhibition, with particular features depending on the investigated case [23, 42]. The typical observations are reported on Figure 4. A fine tuning of the overlap between the thermal relaxation curve (used to measure the T(LIESST)) and the thermal hysteresis was obtained using a solid solutions approach [43]. By inserting manganese ions into the iron network of [Fe(dpp)2(NCS)2], therefore leading to a series of [FexMn1-x(dpp)2(NCS)2] materials, the thermal hysteresis
was shifted toward the thermal relaxation curve: while with increasing x T(LIESST) slightly increases, T1/2
strongly decreases leading to a convergence of both values. Indeed Figure 4 clearly shows that the
T(LIESST) overlaps the thermal hysteresis which becomes inhibited at one point, resulting in materials
completely blocked in the HS state (for 12 % and 15 % of Mn). By plotting the T(LIESST) and the transition temperatures T1/2↓ and T1/2↑ of the hysteresis curves as a function of the dilution ratio x, a clear
Chem2, 2018, 2-2
7 since the lifetime of the low temperature metastable phase becomes comparable to the lifetime of the HS in the hysteresis loop. A typical feature of the occurrence of such overlap is the presence of a HS residue at low temperature (frozen state) that decreases upon warming from low temperature. On the black curves reported for 4 % and 7 % of manganese in Figure 4, the decrease of the χMT product from 75 K to 100
K before it increases again to reach the fully HS state, strongly indicates the presence of a quenched state, resulting from the overlap of the thermal relaxation curve and the thermal hysteresis. It is interesting to note that the presence of the above discussed feature strongly indicates the presence of the overlap, allowing discrimination of this behaviour from usually observed spin state freezing due to thermodynamic quenching. Indeed, in such quenched compounds, at too low temperatures, the entropic contribution is too weak to drive a complete thermal SCO and a strong HS residue will be observed.
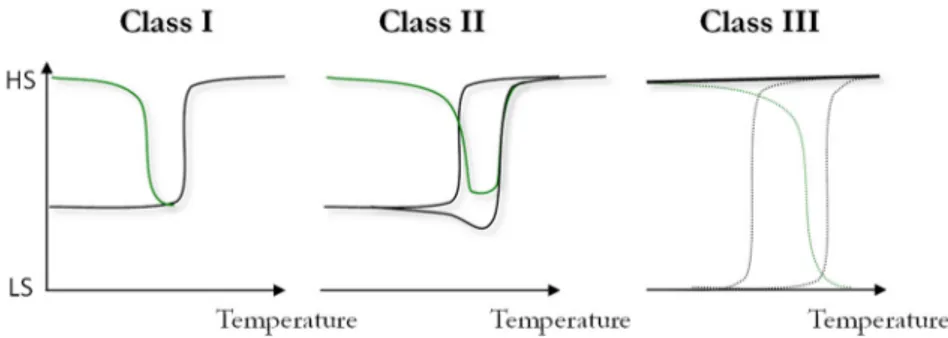
Interestingly, the study of numerous overlaps between the stable and metastable HS* states has allowed a proposed classification of the various behaviours encountered. To date, three different situations, denoted Class I, II and III have been observed: Class I concerns materials where the metastable HS* state is close to the thermal spin crossover curve but without overlapping of the HS states; - Class II deals with a significant crossing of the two regimes; and Class III is when the metastability regime overpasses the thermal SCO (Figure 5).
Class I implies the observation of an incomplete thermal SCO. The first example of Class I was reported for the [Fe(1-Mebpp)2](BF4)2·xH2O (1-Mebpp = 2,6-bis{3-methylpyrazol-1-yl}pyridine; x=0-1/3)
complex characterized by an incomplete cooperative thermal spin transition occurring in two steps centred at 147 and 105 K and a T(LIESST) value of 87 K [44]. Almost 50% of HS state was observed by magnetic measurements at low temperature. This HS residue can be erased by a special treatment between the
T(LIESST) and the T1/2 temperatures, i.e. at 100 K for 2h, allowing the full population of the LS state. An
example of intercept between the two regimes for non-cooperative SCO materials was also reported for the metal diluted [FexMn1-x(3-bpp)2](NCSe)2 series [45]. Another example was encountered for the pure
iron(II) SCO chain [Fe(abpt)2(tcpd)] (tcpd2- = 2-dicyanomethylene-1,1,3,3-tetra-cyanopropanediide anion
and abpt = 4-amino-3,5-bis(pyridin-2-yl)-1,2,4-triazole) displaying a gradual SCO conversion [46]. At low Figure 4. T(LIESST) (●) and hysteresis curves (o) for a series of solid solutions of [FexMn 1-x(dpp)2(NCS)2]. The central plot reports T(LIESST) (●), T1/2↓ (▼) and T1/2↑ (▲) for each sample,
Chem2, 2018, 2-2
8 temperature, a relatively high HS residual fraction of about 30 % was measured due to the overlap of the two regimes and reverse-LIESST effect by irradiating the sample at 830 nm has been used to reduce the residual HS fraction. The vicinity of the thermal relaxation curve and the thermal spin crossover kinetically quenched the spin conversion, especially when the relaxation curves are stretched.
Class II which deals with the intercept of the two regimes. The cooperative materials [FexMn 1-x(bpp)2](BF4)2 and [FexMn1-x(dpp)2(NCS)2] (Figure 4) exemplify this class, i.e. cooperative SCO materials
with thermal hysteresis [23, 42a,b]. This overlap results in unusual shapes of the thermal hysteresis due to the kinetic effects, as shown in Figure 4. It also completes the magnetic and photomagnetic studies performed on cis-[Fe(picen)(NCS)2] (picen= N,N’-bis(2-pyridylmethyl)1,2-ethanediamine) [47], which also
belongs to the same class, with an extremely slow spin equilibration in the vicinity of the thermal spin transition. Several examples in the literature could be also regarded in the light of overlapping SCO regions, such as the 2D coordination network [Fe(bbtr)3](ClO4)2 doped with Zn(II) [48].
Class III concerns the peculiar situation where the metastable regime overpasses the thermal SCO area (Figure 5). Basically, it is difficult to determine if a given complex is in such a situation with the overlap of the SCO phenomenon inhibited and the system remaining fully HS over the whole temperature range. However, it leads to an interesting situation where the thermal hysteresis is hidden under the quenched HS phase. Additionally, this hidden hysteresis can be revealed by light irradiation. The compounds reported by Chakraborty et al. [49] could belong to this category since the HS state can be erased by light irradiation, leading to a spin crossover compound. Similarly, the description of the collapse phase reported in RbI0.43MnII[FeIII(CN)6]0.81·3H2O by Tokoro et al. [50] belongs to this class III since the
HS phase can be erased by light in the temperature range expected for the hidden hysteresis. This peculiar situation that affords a hidden transition is of particular interest since the photoswitching implies two long-lived phases. Indeed, the strong overlap between T(LIESST) and the thermal hysteresis implies that the quenched HS state experiences an extremely long lifetime, far longer than the ones obtained in a classical LIESST state, and comparable to the stable LS state one. Let us note that class III implies that the overlap retains the distinction between the thermodynamically stable HS state above T1/2 and the metastable HS*
state. The particular situation described by this class III implies a quenching of the HS state because of the occurrence of the overlap. This is typical in solid solutions families. However, HS compounds, with HS ground states all along the temperature range from 0 to 400 K could also exhibit the reverse-LIESST process and a related hidden phase. This is probably the case of compounds reported by Chakraborty et al. [51] or Ndiaye et al. [52]. Making the distinction between these two categories of HS compounds requires knowledge of the ground state in the temperature range of the observation of the hidden phase through theoretical calculations for example.
The T(LIESST) measurement and the related linear relationship between T(LIESST) and T1/2 can therefore
help in the understanding of unusual behaviours as well as offering an opportunity to partially predict SCO behaviours in some cases and when precautions are taken (see below). This empirical relationship could be informative on the global SCO behaviour of a family of compounds, including T(LIESST) and T1/2
providing one of the two is known, but also on the origin of deviations from it. Moreover, it informs that Figure 5. Schemes of the different situations possibly encountered when T(LIESST) and the thermal spin crossover are close enough to interplay. Class II schematize the experimental situation presented in
Chem2, 2018, 2-2
9 LS compounds can be highly interesting for room temperature photoswitching if a large enough distortion can be promoted. Finally, photoswitching between long-lived states can be accessible as soon as the SCO can be inhibited. To do so, overlap between the T(LIESST) and T1/2 can be useful but one needs also to
work on elastic frustration [52, 53].
IV. Drawbacks and cautions
The T(LIESST) measurement requires some cautions both in the measurement itself and its interpretation. First the measurement protocol as defined in Figure 1 must be strictly followed. Then, even if it appears simple at first sight, the sample preparation for the SQUID experiment is crucial to insure the most efficient light penetration and good data collection and treatment. This treatment leads to the usual published curves and gives some information on the sample. However, one has to be careful not to make the T(LIESST) over-informative. In the following, the main precautions that must be taken are presented. IV.1- Sample preparation
Since light irradiation is involved in the LIESST process, obviously, the best light penetration has to be favoured; i.e. the sample preparation must lead to the deepest penetration of light into the sample. To do so, samples are prepared as thin layers. Powder or crystals can be deposited on a piece of double-face tape or sealed in a small plastic bag. By doing so, between 0.1 to 1 mg are typically used. This has several consequences. The first one is the difficulty to measure accurately the mass of the sample. One possibility to obtain it is to calculate it by comparing the thermal spin crossover curve recorded on this sample with the one obtained with a more accurately weighed sample of the same material. The other one is obviously to weigh the sample using a microbalance accurate to at least 0.01 mg. In all cases, the diamagnetic correction of the sample holder has also to be estimated, depending on the way it is prepared (see below). A second consequence of such a preparation using so small an amount of sample is the weakness of the magnetic signal. Centring of the signal in the SQUID magnetometer is then crucial, especially since at low temperature, before irradiation, compounds are usually diamagnetic, often with a magnetic contribution of the same order of magnitude as the sample holder. One way to have a proper centring is to perform it under irradiation, when the paramagnetic state is populated, and keep it for the whole measurement (typically by not using the Iterative Regression algorithm in Quantum Design SQUID magnetometers). This induces another difficulty regarding the diamagnetic to paramagnetic transition that induces a negative to positive signal change. Therefore, since the magnetic signals in the initial and final states are of opposite sign, during the photo-excitation and relaxation processes the signal irremediably passes through zero, leading to possibly wrong centring if the centre has not been fixed before.
Specific sample preparation can be made if samples are sensitive to the vacuum of the SQUID magnetometer. This is typically the case for solvated compounds. Samples can be embedded in grease (which adds a significant diamagnetic contribution) or sealed in transparent bags. However, whatever the sample preparation, in some cases the opacity of the sample is so strong that it prevents efficient light penetration. Photo-excitation is thus incomplete, and the sample can be considered as bi-phasic with a top-phase at the surface saturated in its photo-excitation, and a bottom phase practically unexcited. This is typical of a bleaching effect that could lead to non-linear photo-excitation features as well as inhomogeneity [54]. Such inhomogeneity of photo-excitation has to be taken into account when the studied material is cooperative, as the relaxation activation energy is a function of the photo-excited fraction. Optimization of light excitation requires determination of the absorption spectra of the two states involved. For a deeply coloured compound, it has been shown that the photo-excitation is better in the shoulder of an absorption band than at the maximum [22e].
Moreover, since light brings energy, it warms the sample. The intensity should be adjusted to prevent too much heating of the sample and temperature instability. Such heating effects can be probed by switching off the light and recording the magnetic signal. If a jump in the signal is observed at the same recorded temperature it means that light has locally heated the sample. One has to compromise between small heating effects and the efficiency of irradiation.
Finally, light penetration may also be strongly dependent on the morphologies of the sample grains. Microstructural studies, despite being rare, have demonstrated how the size and shapes of the grains of a SCO material may differ, depending on the synthesis [55]. In the context of LIESST measurements, one probably has to favour homogeneous and regular shapes together with small sizes.
Chem2, 2018, 2-2
10 IV.2- T(LIESST) is not a critical temperature!
Strictly speaking T(LIESST) is certainly not an intrinsic critical parameter since it depends on the measurement protocol. Several studies have shown how crucial the latter point is [22e, 23]. Indeed, the investigated temperature range scans both the tunnelling and thermal activated regions of the relaxation leading to a strong dependence on the timescale of the technique used. Laser flash photolysis, ultrafast X Ray diffraction and spectroscopy can detect the photo-induced LIESST state far above the T(LIESST) temperature [7, 8, 13, 18]. Using a SQUID magnetometer allows recording of phenomena at a timescale of 10-20 s while ultrafast spectroscopies probe femtosecond timescales. Note, however, that even in the SQUID magnetometer the way the temperature is changed may slightly affect T(LIESST). Indeed, using a sweep mode allows a fine tuning of the temperature scan rate but does not insure perfect thermalisation of the sample for scan sweep rates above 1 K/min. On the contrary, the settle mode affords good thermalisation of the sample since at each temperature a delay can be tuned for this purpose. Consequently, the temperature scan rate is only a mean value obtained through the whole duration of the measurement. The 0.3 K/min scan rate was defined using the settle mode of the SQUID magnetometer.
Figure 6. Effect of the temperature scan rate on the T(LIESST) measurement. (a) Measurements performed using a sweep mode from 0.3 K/min to 10 K/min and (b) the corresponding T(LIESST)
values as function of this rate for the [Fe(dpp)2(NCS)2] compound (adapted from reference. [23]).
(c) Simulations of the thermal relaxation curves mimicking a measurement in settle mode (the relaxation is calculated every 1 K and the delay between two consecutive temperatures is tuned to change the mean temperature scan rate) and (d) the corresponding experimental (squares) and simulated (line) T(LIESST)
values. The parameters used was obtained from the study of the [Fe(PM-BiA)2(NCS)2] compound.
-1 0 1 2 90 95 100 105 110 115 1200 1 2 3 4 5 6 7 8 9 10 0 50 100 150 200 0 1 2 3 4 Temperature / K
χ
M T / c m 3K m ol -1 ln v T(TI E SST) / K 0.3 K/mn 10 K/mn v / K mn-1 0.0 0.5 1.0 1.5 2.0 64 68 72 76 80 -3.5 -3.0 -2.5 -2.0 -1.5 -1.0 -0.5 0.0a)
b)
20 40 60 80 100 120 0 1 2 3 0.03 K/mn 60 K/mn Temperature / Kχ
M T / c m 3K m ol -1 ln v T(TI E SST) / K v / K mn-1c)
d)
Chem2, 2018, 2-2
11 Figure 6 clearly shows the dependence of T(LIESST) on the temperature scan rate. As expected, the faster the warming rate, the higher the T(LIESST) temperature. This is both linked to the kinetic nature of the
T(LIESST) temperature and the thermalisation time of the sample when a fast scan rate as used. Both
experiments on different compounds such as [Fe(dpp)2(NCS)2] and [Fe(PM-BiA)2(NCS)2] as well as
simulations show a linear evolution of T(LIESST) with ln v, where v is the scan rate of the measurement. Moreover, whatever the temperature scanning method chosen (settle or sweep mode), the trend is the same. Furthermore, the T(LIESST) temperature is a macroscopic value which intrinsically combines both the temperature independent region and the thermally activated region, as well as the existence of cooperativity or heterogeneity of photo-excitation. In other words, an analysis of the T(LIESST) temperatures integrates all the factors affecting the lifetime of the photo-induced HS state, which is both an advantage and a drawback.
Since the T(LIESST) accounts for all the influential parameters at the same time, it could depend on many factors. As already mentioned, the starting state can have an influence on T(LIESST), especially in cooperative systems. Indeed, cooperativity leads to a self-accelerated relaxation [17] with a weak influence on the T(LIESST) value [22e]. Since this self-accelerated relaxation reflects the dependence of the relaxation rate on the HS fraction, the initial HS fraction reached at 10 K could also have some effect on
T(LIESST). Figure 7 presents such an experiment together with simulations performed on the [Fe(PM-BiA)2(NCS)2] compound. First of all, after incomplete photoswitching, a small HS fraction relaxes very
quickly, leading to a small decrease in the χMT value upon warming. This could be due to inhomogeneity
of photoexcitation. Regarding the thermal relaxation curve, the abrupt character of the relaxation tends to disappear for small starting HS fraction. This is coherent with the fact that upon short excitation time, few HS* domains are formed with enough long-range interactions to promote cooperativity. The presence of different HS* domain sizes may affect the relaxation behaviour of the global material. Finally, concerning the T(LIESST) value, it slightly and linearly decreases when the starting HS fraction decreases. However, this decrease remains small (around 2 K).
The T(LIESST) measurement and consequently the T(LIESST) value strongly depend on the temperature scan rate but weakly on the starting conditions (amount of photo-excited HS molecules or used wavelength). This is clearly not a critical temperature but a tool accounting for all the chemical and physical parameters that influence the lifetime of the photo-excited state.
Figure 7. T(LIESST) dependence on the population ratio. (a) experimental curves recorded on [Fe(PM-BiA)2(NCS)2] at 0.3 K/min. (b) Simulations of the thermal relaxation curves at different starting
HS fraction and (c) T(LIESST) values as function of the initial HS fraction at 10 K with the filled squares corresponding to the experimental values and the opened squares to the simulated curves. To summarize this part, from one technique to another, depending on the way the temperature is changed,
T(LIESST) can be affected. However, keeping the temperature scan rate between 0.1 and 0.5 K/min in
sweep mode could guarantee that the temperature is changed at the same rate through the entire measurement interval, irrespective on how many temperature points have been collected. However, giving the precise information on how the measurement is performed (scan rate, settle or sweep mode, temperature interval) is crucial and should be present in all the papers reporting such measurements. Moreover, if families of compounds are compared, accuracy in the comparison will be strengthened when using exactly the same protocol.
0.0 0.2 0.4 0.6 0.8 1.0 74 75 76 77 78 10 20 30 40 50 60 70 80 0.0 0.5 1.0 1.5 2.0 2.5 3.0 3.5 T( LIESST) / K Population ratio 0 10 20 30 40 50 60 70 80 90 0.0 0.5 1.0 1.5 2.0 2.5 3.0 3.5 Temperature / K χM T / c m 3K m ol -1 Temperature / K a) b) c)
Chem2, 2018, 2-2
12 IV.3- It’s not a pure molecular behaviour!
As a consequence of the global character of the T(LIESST) measurement, it gives information on the material behaviour but not at the molecular scale. It was considered for a long time of purely molecular origin, with a small impact of the cooperativity [22e], especially because solid solution studies using non spin crossover hosts have shown no impact on the T(LIESST) value [45, 56]. Note also that structural studies clearly indicate that the trigonal distortion of the inner coordination sphere is correlated with the
T(LIESST) value as shown by a comparison of compounds showing very close, if not identical, crystal
packings [24, 28a]. Moreover, simulations have evidenced that the activation energy is the key factor to tune the T(LIESST) value [22e]. Consequently, from such studies no information on the effect of the crystal packing was expected, which must absolutely not be interpreted in the sense of the crystal packing having no effect. Early belief on the pure molecular origin of T(LIESST) was coherent with the fact that, as already mentioned in section III.2, deviation from the linear relationship between T(LIESST) and T1/2
followed from the inner coordination sphere properties. However, such deviation can also come from crystal packing effects. We mentioned the occurrence of a structural transition upon irradiation [41] and also the effect of internal pressure due to metal dilution [29]. Depending on the size of the host ion [57], the internal pressure can be tuned and the effect on the T(LIESST) recorded. It has been done on the archetypical compound [Fe(phen)2(NCS)2] (Figure 8) [29]. All the solid solutions obtained with Ni(II),
Zn(II), Co(II), Mn(II) or Cd(II) were shown to exhibit the same powder diffractogram, indicating these solid solutions were isostructural. Therefore, differences in the crystal packing are minimized to the internal pressure exerted by the host ion. Cadmium and manganese which are larger than iron in its HS state, stabilize the HS state by exerting a ‘‘negative” internal pressure, that leads to an important decrease in T1/2
and an increase in the T(LIESST) value. Zinc and cobalt, with a similar ionic radius to the HS iron, cause no change in T(LIESST) but shift T1/2 towards lower temperatures. Finally, nickel with an almost
intermediate ionic radius between HS and LS iron tends to stabilize slightly the state of smaller volume, namely the LS state. This therefore generates a slight decrease in T(LIESST) and T1/2 with increasing
doping level.
T(LIESST) is obviously recorded on a sample that is not an isolated molecule but a powder, single crystals,
isomorphous matrixes or polymeric matrixes. Therefore, when comparing compounds from the same family, information can be extracted from the thermal relaxation curve for comparison, keeping in mind that if deviations appear they do not always come from molecular differences but could be affected by any physical scales (crystal packing, pressure effects induced by host matrixes, microstructures, …).
Figure 8. T(LIESST) value as function of the metal ratio, x, in [FexM1-x(phen)2(NCS)2] compound with
M = Ni(II), Zn(II) and Cd(II). The ionic radius are Ni(II) = 69 pm, Zn(II) = 74 pm, Fe(II)LS= 61 pm,
Chem2, 2018, 2-2
13 IV.4- Cautions with the database
Regarding the previous sections, it is clear that the T(LIESST) = T0 – 0.3 T1/2 relationship is certainly not
a law. It’s a trend that agrees with the inverse energy gap law and that must be seen as a tool to help the design of SCO materials. The chemical factor underlying the T0 parameter was attributed to the
coordination sphere distortion and the stiffness of the ligands, keeping in mind the above limitation. The homo- or heteroleptic character of the complexes could also have an impact. Indeed, while the T0 =
120 K line was linked mainly bidentate ligand-based complexes, most of the [Fe(L)2(NCX)2] compounds
where L is a bidentate ligand are spread around both the T0 = 100 K and T0 = 120 K lines. From the
[Fe(PM-L)2(NCS)2] family investigation, the distortion of the coordination sphere in the HS state clearly
favours highest T0 [24]. On the contrary most of the [Fe(L’)2] complexes where L’ is a tridentate ligand
align along the T0 = 150 K line. This could follow from the fact that, in heteroleptic complexes, an
additional degree of freedom is given to the molecule to accommodate a potential structural stress such as distortion. Finally, pentadentate macrocyclic ligand-based complexes such as [Fe(L222(N3O2))(CN)2]·H2O
belong to the virtual T0= 180 K line [58]. Even the LS compound [Fe(L222N5)(CN)2]·H2O (L222N5 =
(2,13-dimethyl-3,6,9,12,18-entaazabicyclo[12.3.1]octadeca-1(18),2,12,14,16-pentaene) exhibits a T(LIESST) of 105 K [59]. This is a general trend but it seems that it does not concern all compounds. Indeed, Fe(III) complexes based on tridentate ligands do not follow the expected T0 = 150 K line. Fe(III) complexes often
exhibit faster relaxation than Fe(II) complexes, due to smaller iron-ligand distance change upon spin crossover [60]. Most of the Fe(III) complexes studied by photomagnetism are based of tridentate ligands, derived from salicylaldehyde and amines [61]. The studies performed so far do not show any particular trend in the sense that these tridentate-based Fe(III) complexes do not belong to any specific T0 line [22f,
62]. Consequently, while the inverse energy gap law is still valid, the T(LIESST) database, as defined here, would for the moment better be used only for iron(II) complexes - which constitutes only a relative limitation since iron(II) based compounds represent a very large majority of investigated SCO materials. Its use for other switchable systems should be carefully done and would deserve specific investigations. Finally, beyond the denticity of the ligand involved in the coordination of the metal ion, it seems that its stiffness is crucial. Indeed, the introduction of flexibility into the inner coordination sphere drastically reduces the T0 value [63]. For instance, the introduction of an unsaturated carbon atom between the
aromatic rings of a tridentate ligand drastically reduces T(LIESST) towards the T0 = 100 K line. This
emphasises that T0 is not the translation of only one chemical parameter but surely the combined action
of distortion and stiffness that can be, in a first view, linked to the denticity of the ligand. While distortion has been studied in detail and highlighted for its role in the lifetime of the photo-induced HS state, the effect of the stiffness of the coordination sphere is, however, hard to estimate.
V. Conclusions
"When we imagine, we only see; when we conceive, we compare" wrote the philosopher J.J. Rousseau in
Emile, or On Education (1762). The initial guideline of the T(LIESST) measurement is there in. The
T(LIESST) measurement is indeed an empirical method initially developed for the fast comparison of SCO
samples as regards their ability to exhibit interesting light-induced behaviours - not more, not less. The accumulation of data has allowed the comparison of many families of compounds which incidentally led to extraction of information on the LIESST effect itself. As discussed here, different classes of materials have been identified depending on their relative LIESST and thermal SCO behaviours, giving clear limits in the possibility to observe light-induced SCO in some cases. In addition, the comparison of T(LIESST) and T1/2 values evidences their relationship as well as the multifactorial origin of the light response of the
material, far beyond the molecular scale. We believe the T(LIESST) measurement must be performed carefully and diligently, providing full experimental details (sample preparation, time, power, and wavelength of irradiation, scan rate, measurement mode, etc.) to allow meaningful comparisons between different SCO compounds that exhibit this effect. All the above limitations - experimental as well as in term of interpretation - must always be kept in mind before making any conclusion.
VI. Acknowledgements
The authors acknowledge the Department of Cooperation and Cultural Action Embassy of France to Dakar-Sénégal, the University of Ziguinchor and its Department of Cooperation and Research, the
Chem2, 2018, 2-2
14 Ministry of Higher Education and Research of Sénégal (Program FIRST) and CAMPUS France. This work was also supported by the University of Bordeaux, the CNRS, the Region Nouvelle Aquitaine and by the LabEx AMADEus (ANR-10-LABX-42) within IdEx Bordeaux (ANR-10-IDEX-03-02), i.e. the Investissements d’Avenir programme of the French government managed by the Agence Nationale de la Recherche. The ANR is also warmly acknowledged (ANR femtomat n° 13-BS04-002). The authors also deeply thank the French network GdR MCM2 (Magnétisme et Commutation Moléculaires) for the fruitful discussions the regular meetings provide. Finally, we warmly thank all the collaborators, visitors and experts for their confidence, interest and criticisms that helped a lot in the building of the database and the understanding of the phenomenon.
VII. References
[1] Gütlich P., Goodwin H. A., (eds) Spin Crossover in Transition Metal Compounds I-III. Top. Curr. Chem., vol. 233 – 235. Springer, Berlin / Heidelberg, Germany, 2004.
[2] Guionneau P., Collet E., In Spin-Crossover Materials: Properties and Applications; Halcrow, M. A., Ed.; John Wiley & Sons Ltd: Oxford, UK, 2013; p 507.
[3] (a) Boillot M.-L., Zarembowitch J., Sour A., Top. Curr. Chem. 2004, 234, 261-276; (b) Rosner B., Milek M., Witt A., Gobaut B., Torelli P., Fink R. H., Khusniyarov M. M., Angew. Chem. Int.
Ed., 2015, 54, 12976-12980.
[4] Venkataramani S., Jana U., Dommaschk M., Sonnichsen F. D., Tuczek F., Herges R., Science, 2011, 331, 445-448.
[5] Decurtins S., Gutlich P., Kohler C. P., Spiering H., Hauser A., Chem. Phys. Lett., 1984, 105, 1-4.
[6] (a) Freysz E., Montant S., Létard S., Létard J.-L., Chem. Phys. Lett., 2004, 394, 318-323; (b) Bonhommeau S., Molnar G., Galet A., Zwick A., Real J. A., McGarvey J. J., Bousseksou A., Angew.
Chem. Int. Ed., 2005, 44, 4069-4073.
[7] (a) Cannizzo A., Milne C. J., Consani C., Gawelda W., Bressler Ch., van Mourik F., Chergui M., Coord.
Chem. Rev., 2010, 254, 2677-2686; (b) Bertoni R., Cammarata M., Lorenc M., Matar S. F., Létard J.-F.,
Lemke H.T., Collet E., Acc. Chem. Res., 2015, 48, 774-781.
[8] (a) McGarvey J. J., Lawthers I., J. Chem. Soc., Chem. Commun., 1982, 906-907; (b) Brady C., McGarvey J. J., McCusker J. K., Toflund H., Hendrickson D. N., in Spin Crossover in Transition Metal Compounds III, Top.
Curr. Chem., 2004, 235, 1-22.
[9] Hauser A., Chem. Phys. Lett., 1986, 124, 543-548.
[10] Chastanet G., Lorenc M., Bertoni R., Desplanches C., C.R. Chim., 2018, in press.
[11] Marchivie M., Guionneau P., Howard J. A. K., Chastanet G., Létard J.-F., Goeta A. E., Chasseau D., J.
Am. Chem. Soc., 2002, 124, 194-195.
[12] Legrand V., Pillet S., Souhassou M., Lugan N., Lecomte C., J. Am. Chem. Soc., 2006, 128, 13921-13931. [13] Cailleau H., Lorenc M., Guérin L., Servol M., Collet E., Buron-Le Cointe M., Acta Cryst. Sect. A, 2010, 66,
189-197.
[14] (a) Suaud N., Bonnet M., Boilleau C., Labèguerie P., Guihéry N., J. Am. Chem. Soc., 2009, 131, 715-722; (b) Kepenekian M., Robert V., Le Guennic B., J. Chem. Phys., 2009, 131, 114702; (c) de Graaf C., Sousa C.,
Chem. Eur. J., 2010, 16, 4550-4556; (d) Lawson Daku L. M., Hauser A., J. Phys. Chem. Lett., 2010, 1,
1830-1835; (e) de Graaf C., Sousa C., Int. J. Quantum Chem., 2011, 111, 3385-3393; (f) Boilleau C., Suaud N., Guihéry N., J. Chem. Phys., 2012, 137, 224304/1; (g) Sousa C., De Graaf C., Rudavskyi A., Broer R., Tatchen
Chem2, 2018, 2-2
15 J., Etinski M., Marian C. M., Chem. Eur. J., 2013, 19, 17541-17551; (h) Sousa C., Llunell M., Domingo A., de Graaf C., Phys. Chem. Chem. Phys., 2018, 20, 2351-2355.
[15] (a) McCusker J. K., Walda K. N., Dunn R. C., Simon J. D., Magde D., Hendrickson D. N., J. Am. Chem.
Soc. 1993, 115, 298-307; (b) Gawelda W., Cannizzo A., Pham V.-T., van Mourik F., Bressler C., Chergui
M., J. Am. Chem. Soc. 2007, 129, 8199-8206; (c) Consani C., Prémont-Schwarz M., Elnahhas A., Bressler C., Van Mourik F., Cannizzo A., Chergui M., Angew. Chem. Int. Ed., 2009, 48, 7184-7187; (d) Bressler C., Milne C., Pham V.-T., El Nahhas A., Veen R. M. van der, Gawelda W., Johnson S., Beaud P., Grolimund D., Kaiser M., Borca C. N., Ingold G., Abela R., Chergui M., Science, 2009, 323, 489-492; (e) Tribollet J., Galle G., Jonusauskas G., Deldicque D., Tondusson M., Létard J.-F., Freysz E., Chem. Phys. Lett., 2011,
513, 42-47; (f) Zhang W., Alonso-Mori R., Bergmann U., Bressler C., Chollet M., Galler A., Gawelda W.,
Hadt R. G., Hartsock R. W., Kroll T., Kjær K. S., Kubiek K., Lemke H. T., Liang H. W., Meyer D. A., Nielsen M. M., Purser C., Robinson J. S., Solomon E. I., Sun Z., Sokaras D., Van Driel T. B., Vankó G., Weng T. C., Zhu D., Gaffney K. J., Nature, 2014, 509, 345-348; (g) Hong K., Cho H., Schoenlein R. W., Kim T. K., Huse N., Acc. Chem. Res., 2015, 48, 2957-2966; (h) Field R., Liu L. C., Gawelda W., Lu C., Miller R. J. D., Chem. Eur. J., 2016, 22, 5118-5122.
[16] (a) Canton S. E., Zhang X., Lawson Daku L. M., Smeigh A. L., Zhang J., Liu Y., Wallentin C. J., Attenkofer K., Jennings G., Kurtz C. A., Gosztola D., Wärnmark K., Hauser A., Sundström V., J. Phys. Chem. C, 2014,
118, 4536-4545; (b) Vankó G., Bordage A., Pápai M., Haldrup K., Glatzel P., March A. M., Doumy G.,
Britz A., Galler A., Assefa T., Cabaret D., Juhin A., Van Driel T. B., Kjær K. S., Dohn A., Møller K. B., Lemke H. T., Gallo E., Rovezzi M., Németh Z., Rozsályi E., Rozgonyi T., Uhlig J., Sundström V., Nielsen M. M., Young L., Southworth S. H., Bressler C., Gawelda W., J. Phys. Chem. C, 2015, 119, 5888-5902. [17] (a) Hauser A. Coord. Chem. Rev., 1991, 111, 275-290; (b) Hauser A., Enachescu C., Lawson Daku M., Vargas
A., Amstutz N., Coord. Chem. Rev., 2006, 250, 1642-1652.
[18] (a) Bertoni R., Lorenc M., Cailleau H., Tissot A., Laisney J., Boillot M.-L., Stoleriu L., Stancu A., Enachescu C., Collet E., Nat. Mater., 2016, 15, 606-610; (b) Bertoni R., Lorenc M., Graber T., Henning R., Moffat K., Létard J.-F., Collet E., CrystEngComm., 2016, 18, 7269-7275.
[19] Collet E., Guionneau P., C.R. Chimie, 2018, in press. https://doi.org/10.1016/j.crci.2018.02.003
[20] (a) Herber R., Casson L. M., Inorg. Chem. 1986, 25, 847-852; (b) Herber R., Inorg. Chem., 1987, 26, 173-178. [21] Létard J.-F., Guionneau P., Rabardel L., Howard J. A. K., Goeta A. E., Chasseau D., Kahn O., Inorg. Chem.,
1998, 37, 4432-4441.
[22] (a) Létard J.-F., Capes L., Chastanet G., Moliner N., Létard S., Real J. A., Kahn O., Chem. Phys. Lett., 1999,
313, 115-120; (b) Létard J.-F., J. Mater. Chem., 2006, 16, 2550-2559; (c) Létard J.-F., Guionneau P., Nguyen
O., Sanchez Costa J., Marcén S., Chastanet G., Marchivie M., Goux-Capes L., Chem. Eur. J., 2005, 11, 4582-4589; (d) Létard J.-F., Chastanet G., Nguyen O., Marcén S., Marchivie M., Guionneau P., Chasseau D., Gütlich P., in Molecular Magnets Recent Highlights, Eds W. Linert & M. Verdaguer, Springer Wien N.-Y., p 49, 2003; (e) Létard J.-F., Chastanet G., Guionneau P., Desplanches C., in Spin Crossover Materials: Properties
and Applications, Ed. Malcom A. Halcrow, John Wilfreysey & sons, p 475, 2013.
[23] Paradis N., Chastanet G., Palamarciuc T., Rosa P., Varret F., Boukheddaden K., Létard J.-F., J. Phys. Chem.
C, 2015, 119, 20039-20050.
[24] Marchivie M., Guionneau P., Létard J.-F., Chasseau D., Acta Cryst. Sect. B, 2005, 61, 25-28.
[25] (a) Craig G., Roubeau O., Aromi G., Coord. Chem. Rev., 2014, 269, 13-31; (b) Halcrow M. A., Coord. Chem.
Rev., 2009, 253, 2493-2514; (c) Kershaw L. J., Mohammed R., Sherborne G., Roberts T. D., Alvarez S.,
Halcrow M. A., Coord. Chem. Rev., 2015, 289-290, 2-12; (d) Marcen S., Lecren L., Capes L., Goodwin H. A., Létard J.-F., Chem. Phys. Lett. 2002, 358, 87-95.
[26] Guionneau P., Marchivie M., Bravic G., Létard J.-F., Chasseau D., in: Gütlich P., Goodwin H. A. (Eds.)
Chem2, 2018, 2-2
16 [27] (a) Shatruk M., Phan H., Chrisostomo B. A., Suleimenova A., Coord. Chem. Rev., 2015, 289, 62-73; (b) Phan H., Hrudka J. J., Igimbayeva D., Lawson Daku M., Shatruk M., J. Am. Chem. Soc., 2017, 139, 6437-6447; (c) Pfaffeneder T.A., Thallmair S., Bauer W., Weber B., New J. Chem., 2011, 35, 691-700.
[28] (a) Guionneau P., Dalton Trans., 2014, 43, 382-393; (b) Halcrow M. A., Chem. Soc. Rev., 2011, 40, 4119-4142. [29] (a) Sylla M. S., Balde C., Daro N., Desplanches C., Marchivie M., Chastanet G., Eur. J. Inorg. Chem., 2018,
297-304; (b) Hauser A., Chem. Phys. Lett., 1992, 192, 65-70.
[30] (a) Klug C. M., McDaniel A. M., Fiedler S. R., Schulte K. A., Newell B. S., Shores M. M., Dalton Trans. 2012, 41, 12577-12585; (b) Roubeau O., Chem. Eur. J., 2012, 18, 15230-15244.
[31] Among others (a) Hostettler M., Tornroos K. W., Chernyshov D., Vangdal B., Burgi H.-B., Angew. Chem.
Int. Ed., 2004, 43, 4589-4594; (b) Kershaw Cook L. J., Kulmaczewski R., Cespedes O., Halcrow M. A., Chem. Eur. J., 2016, 22, 1789-1799; (c) Bartual-Murgui C., Codina C., Roubeau O., Aromi G., Chem. Eur. J., 2016, 22, 12767-12776; (d) König E., Prog. Inorg. Chem., 1987, 35, 527-622; (e) Gütlich P., Hauser A.,
Spiering H., Angew. Chem. Int. Ed., 1994, 33, 2024-2054; (f) Ohtani R., Hayami S., Chem. Eur. J., 2017, 23, 2236-2248; (g) Ni Z.-P., Liu J.-L., Hoque M. N., Liu W., Li J.-Y., Chen Y.-C., Tong M.-L., Coord. Chem.
Rev., 2017, 335, 28-43.
[32] Buhks E., Navon G., Bixon M., Jortner J., J. Am. Chem. Soc., 1980, 2, 2918-2923.
[33] (a) Wu C.-C., Jung J., Gantzel P. K., Gütlich P., Hendrickson D. N., Inorg. Chem., 1997, 36, 5339-5347; (b) Cecconi F., Di Vaira M., Midollini S., Orlandini A., Sacconi L., Inorg. Chem., 1981, 20, 3423-3430.
[34] Rosa P., Debay A., Capes L., Chastanet G., Bousskesou A., Le Floch P., Létard J.-F., Eur. J. Inorg. Chem., 2004, 3017-3019.
[35] (a) Capes L., Létard J.-F., Kahn O., Chem. Eur. J., 2000, 6, 2246-2255; (b) Hayami S., Gu Z.-Z., Shiro M., Einaga Y., Fujishima A., Sato O., J. Am. Chem. Soc., 2000, 122, 7126-7127.
[36] (a) Paradis N., Le Gac F., Guionneau P., Largeteau A., Yufit D. S., Rosa P., Létard J.-F., Chastanet G.,
Magnetochem., 2016, 2, 15; (b) Garcia Y., Renz F., Gütlich P., Curr. Inorg. Chem., 2016, 6, 4-9; (c) Delgado T.,
Tissot A., Besnard C., Guenee L., Pattison P., Hauser A., Chem. Eur. J,. 2015, 21, 3664-3670; (d) Sylla M. S., Balde C., Daro N., Chastanet G., J. Soc. Ouest-Afr. Chim. 2017, 43, 37-47.
[37] Guionneau P., Le Gac F., Kaiba A., Sanchez-Costa J., Chasseau D., Létard J.-F., Chem. Commun. 2007, 3723-3725.
[38] Alvarez S., J. Am. Chem. Soc., 2003, 125, 6795-6802.
[39] (a) Stock P., Deck E., Hohnstein S., Korzekwa J., Meyer K., Heinemann F. W., Breher F., Hörner G., Inorg.
Chem., 2016, 55, 5254-5265; (b) Renz F., Oshio H., Spiering H., Ksenofotnov V., Waldeck M., Spiering H.,
Gütlich P., Angew. Chem. Int. Ed., 2000, 39, 3699-3700; (c) Oshio H., Spiering H., Ksenofotnov V., Renz F., Gütlich P., Inorg. Chem., 2001, 40, 1143-1150.
[40] (a) Létard J.-F., Chastanet G., Nguyen O., Marcén S., Marchivie M., Guionneau P., Chasseau D., Gütlich P., Monatsh. Chem., Chemical Monthly 2003, 134, 165-182; (b) Buron-Le-Cointe M., Hébert J., Baldé C., Moisan N., Toupet L., Guionneau P., Létard J.-F., Cailleau H., Collet E., Phys. Rev. B., 2012, 85, 064114; (c) Matar S. F., Guionneau P., Chastanet G., Int. J. Mol. Sci., 2015, 16, 4007-4027.
[41] Kulmaczewski R., Trzop E., Kershaw Cook L. J., Collet E., Chastanet G., Halcrow M. A., Chem. Commun. 2017, 53, 13268-13271.
[42] (a) Paradis N., Chastanet G., Létard J.-F., Eur. J. Inorg. Chem., 2012, 3618-3624 (b) Paradis N., Chastanet G., Varret F., Létard J.-F., Eur. J. Inorg. Chem., 2013, 968-974; (c) Varret F., Boukheddaden K., Chastanet G., Paradis N., Létard J.-F., Eur. J. Inorg. Chem., 2013, 763-769.
Chem2, 2018, 2-2
17 [43] (a) Ganguli P., Gütlich P., Müller E. W., Inorg. Chem., 1982, 21, 3429-3433; (b) Haddad M. S., Federer W. D., Lynch M. W., Hendrickson D. N., J. Am. Chem. Soc., 1980, 102, 1468-1470; (c) Haddad M. S., Federer W. D., Lynch M. W., Hendrickson D. N., Inorg. Chem., 1981, 20, 131-139; (d) Varma V., Fernàndes J. R.,
Chem. Phys. Lett., 1990, 167, 367-370; (e) Martin J.-P., Zarembowitch J., Dworkin A., Haasnoot J. G., Varret
F., Inorg. Chem., 1994, 33, 2617-2623; (f) Martin J.-P., Zarembowitch J., Bousseksou A., Dworkin A., Haasnoot J. G., Varret F., Inorg. Chem., 1994, 33, 6325-6333; (g) Tayagaki T., Galet A., Molnar G., Carmen Munoz M., Zwick A., Tanaka K., Real J.-A., Bousseksou A., J. Phys. Chem. B., 2005, 109, 14859-14867. [44] Money V. A., Carbonera C., Elhaïk, J., Halcrow M. A., Howard. J. A. K., Létard J.-F., Chem. Eur. J., 2007,
13, 5503-5514
[45] Baldé C., Desplanches C., Gütlich P., Freysz E., Létard J.-F., Inorg. Chim. Acta., 2008, 361, 3529-3533. [46] Dupouy G., Marchivie M., Triki S., Sala-Pala J., Gómez-García C. J., Pillet S., Lecomte C., Létard J.-F.,
Chem. Commun., 2009, 3404-3406.
[47] Létard J.-F., Asthana S., Shepherd H. J., Guionneau P., Goeta A. E., Suemura N., Ishikawa R., Kaizaki S.,
Chem. Eur. J., 2012, 18, 5924-5934.
[48] Kusz J., Bronisz R., Zubko M., Bednarek G., Chem. Eur. J., 2011, 17, 6807-6820.
[49] Chakraborty P., Enachescu C., Humari A., Egger L., Delgado T., Tissot A., Guenee L., Besnard C., Bronisz R., Hauser A., Dalton. Trans., 2014, 43, 17786-17796
[50] (a) Tokoro H., Ohkoshi S. I., Appl. Phys. Lett., 2008, 93, 021906; (b) Létard J.-F., Chastanet G., Tokoro H., Ohkoshi S.-I., Curr. Inorg. Chem., 2016, 6, 34-39.
[51] Chakraborty P., Bronisz R., Besnard C., Guenee L., Pattison P., Hauser A., J. Am. Chem. Soc., 2012, 134, 4049-4052.
[52] Ndiaye M. M., Pillet S., Bendeif E.-E., Marchivie M., Chastanet G., Boukheddaden K., Triki S., Eur. J.
Inorg. Chem., 2018, 305-313.
[53] (a) Milin E., Patinec V., Triki S., Bendeif E.-E., Pillet S., Marchivie M., Chastanet G., Boukheddaden K.,
Inorg. Chem., 2016, 55, 11652-11661; (b) Paez-Espejo M., Sy M., Boukheddaden K., J. Am. Chem. Soc., 2016, 138, 3202-3210.
[54] Enachescu C., Constant-Machado H., Codjovi E., Linares J., Boukheddaden K, Varret F., J. Phys. Chem.
Solids, 2001, 62, 1409-1422.
[55] (a) Bartual-Murgui C., Natividad E., Roubeau O., J. Mater. Chem. C, 2015, 3, 7916-7924; (b) Gimenez-Marqués M., Garcia-Sanz de Larrea M. L., Coronado E., J. Mater. Chem. C, 2015, 3, 7946-7953; (c) Grosjean A., Daro N., Pechev S., Etrillard C., Chastanet G., Guionneau P., Eur. J. Inorg. Chem., 2018, 429-434; (d) Daro N., Moulet L., Penin N., Paradis N., Létard J.-F., Lebraud E., Buffière S., Chastanet G., Guionneau P., Materials, 2017, 10, 60; (e) Manrique-Juárez M. D., Suleimanov I., Hernández E. M., Salmon L., Molnár G., Bousseksou A., Materials, 2016, 9, 537; (f) Dugay J., Giménez-Marqués M., Kozlova T., Zandbergen H. W., Coronado E., van der Zant H. S., Adv. Mater., 2015, 27, 1288-1293.
[56] (a) Baldé C., Desplanches C., Wattiaux A., Guionneau P., Gütlich P., Létard J.-F., Dalton Trans., 2008, 2702-2707; (b) Baldé C., Desplanches C., Grunert M., Wei Y., Gütlich P., Létard J.-F., Eur. J. Inorg. Chem., 2008, 5382-5389; (c) Baldé C., Desplanches C., Le Gac F., Guionneau P., Létard J.-F., Dalton Trans., 2014, 43, 7820-7829; (d) Baldé C., Desplanches C., Létard J-F., Chastanet G., Polyhedron, 2017, 123, 138-144; (e) Lebedev G., Pillet S., Baldé C., Guionneau P., Desplanches C., Létard J-F., IOP Conf. Ser. Mater. Sci. Eng., 2009, 5, 012025.
![Figure 1. a) T(LIESST) experiment recorded for the mononuclear [Fe(dpp) 2 (NCS) 2 ] complex [23] with (o) the temperature dependence of M T recorded in the cooling and warming modes without irradiation,](https://thumb-eu.123doks.com/thumbv2/123doknet/14317547.496435/4.892.163.764.534.774/figure-experiment-recorded-mononuclear-temperature-dependence-recorded-irradiation.webp)
![Figure 2. Sketch of the LS (blue) and HS (red) potential wells in the isotropic breathing model (left) and in the anisotropic breathing model (right) for polymorphs I (highly distorted) and II (weakly distorted) of the [Fe(PM-BiA) 2 (NCS) 2 ] compound, a](https://thumb-eu.123doks.com/thumbv2/123doknet/14317547.496435/5.892.162.768.311.534/potential-isotropic-breathing-anisotropic-breathing-polymorphs-distorted-distorted.webp)
![Figure 3. The modification of the trigonal distortion [28, 24, 26] from HS to LS, denoted , for iron(II) complexes belonging to the same family [Fe(L) 2 (NCX) 2 ] with L a bidentate ligand and X = S or](https://thumb-eu.123doks.com/thumbv2/123doknet/14317547.496435/7.892.270.653.196.464/figure-modification-trigonal-distortion-denoted-complexes-belonging-bidentate.webp)
![Figure 4. T(LIESST) (●) and hysteresis curves (o) for a series of solid solutions of [Fe x Mn 1- 1-x (dpp) 2 (NCS) 2 ]](https://thumb-eu.123doks.com/thumbv2/123doknet/14317547.496435/8.892.187.758.452.814/figure-liesst-hysteresis-curves-series-solid-solutions-ncs.webp)

![Figure 7. T(LIESST) dependence on the population ratio. (a) experimental curves recorded on [Fe(PM-BiA) 2 (NCS) 2 ] at 0.3 K/min](https://thumb-eu.123doks.com/thumbv2/123doknet/14317547.496435/12.892.168.769.645.822/figure-liesst-dependence-population-ratio-experimental-curves-recorded.webp)
![Figure 8. T(LIESST) value as function of the metal ratio, x, in [Fe x M 1-x (phen) 2 (NCS) 2 ] compound with M = Ni(II), Zn(II) and Cd(II)](https://thumb-eu.123doks.com/thumbv2/123doknet/14317547.496435/13.892.197.725.707.968/figure-liesst-value-function-metal-ratio-phen-compound.webp)
