HAL Id: hal-02340722
https://hal.archives-ouvertes.fr/hal-02340722
Submitted on 12 Nov 2020
HAL is a multi-disciplinary open access
archive for the deposit and dissemination of
sci-entific research documents, whether they are
pub-lished or not. The documents may come from
teaching and research institutions in France or
abroad, or from public or private research centers.
L’archive ouverte pluridisciplinaire HAL, est
destinée au dépôt et à la diffusion de documents
scientifiques de niveau recherche, publiés ou non,
émanant des établissements d’enseignement et de
recherche français ou étrangers, des laboratoires
publics ou privés.
Assessment of the impact of the electrical stress on the
ageing for a HVDC model cable
Julien Cenes, G. Teyssedre, Séverine Le Roy, Laurent Berquez, Virginie
Eriksson, Wendy Loyens, Marc Bailleul, Pierre Hondâa, Christophe Moreau
To cite this version:
Julien Cenes, G. Teyssedre, Séverine Le Roy, Laurent Berquez, Virginie Eriksson, et al.. Assessment
of the impact of the electrical stress on the ageing for a HVDC model cable. 10th International
Conference on Insulated Power Cables, Versailles, France, 23 - 27 June 2019, Jun 2019, Versailles,
France. Paper B7-4, pp 1-6. �hal-02340722�
Assessment of the impact of the electrical stress on the ageing for a HVDC model
cable
Julien CENES, Gilbert TEYSSEDRE, Séverine LE ROY, Laurent BERQUEZ Laplace CNRS, Toulouse, France, cenes@laplace.univ-tlse.fr, teyssedre@laplace.univ-tlse.fr, leroy@laplace.univ-tlse.fr, berquez@laplace.univ-tlse.fr Virginie ERIKSSON, Wendy LOYENS, Marc BAILLEUL, Borealis, Stenungsund, Sweden,
virginie.eriksson@borealisgroup.com, wendy.loyens@borealisgroup.com, marc.bailleul@borealisgroup.com Pierre HONDÂA, RTE, Paris La défense, France, pierre.hondaa@rte-france.com
Christophe MOREAU, EDF R&D, Moret-sur-Loing, France, christophe.moreau@edf.fr
ABSTRACT
The objective of this study is to investigate the impact of thermoelectric stress compared to thermal stress on the properties of HVDC model cables. To do so, electrical and physico-chemical characterizations have been performed as a function of ageing time that extends over several months. Electrical characterizations show that the thermoelectric ageing tends to decrease the conductivity compared to the thermal ageing. The same conclusion holds for space charge, where more charges are observed during characterization for a thermally aged cable, compared to an electro-thermally stressed one.
Physico-chemical characterizations do not show
significant differences between thermoelectric and thermal ageing. Both ageing conditions show an increase of the carbonyl index with ageing time.
KEYWORDS
XLPE; HVDC; Ageing, Space charge; Cables; Conductivity.
INTRODUCTION
In the field of electricity transmission (high voltage underground cables), the challenge lies in the development of increasingly compact, reliable and environmentally friendly systems. In this context, polyethylene, notably XLPE has become a material of choice for HVDC cable insulation. However, with the significant growth of the technology over the last 20 years at increasing voltage levels, the behaviour of XLPE insulation needs to be better known under higher DC stress. Many ageing studies have been performed on XLPE, but over relatively short periods of time, at temperatures well above the melting temperature without electrical stress or with relatively low electrical stress [1]– [3].
The objective of this study is to characterize and compare the electrical and physico-chemical evolutions of a model cable system subjected to thermoelectric or thermal stress for a long period of time. To do so, the applied thermal stress, although above typical operating temperatures of full size cable systems, was kept under the material’s melting temperature, while a significantly higher electrical stress was applied than the typical nominal electric stresses of full size cable systems in operation. Ageing and characterizations are performed on model cables thus taking into account the cylindrical geometry, as well as the presence of semi-conducting layers (SC). Current measurements and space charge measurements for the electrical characterizations, and Infra-Red spectroscopy,
as well as DSC have been performed on unaged and aged samples.
SAMPLES AND METHODS
The sample used for the study is model cable extruded on a laboratory CCV line using HVDC grade materials. The main advantages of this type of sample compared to plaques are the cylindrical geometry as well as the presence of the semi-conductive layers (SC). The model cables consist of a copper core and a three layer insulation system (SC / XLPE / SC). The core radius is r1=0.7mm, the internal SC radius r2=1.5mm, the insulator
radius r3=3mm and the external SC radius r4=3.7mm.
Electrical and physicochemical characterizations were performed on an unaged model cable to provide a reference state of the insulation. These characterizations were also performed on aged model cable to observe the evolution with ageing time. The electrical characterization consists in current measurements, to deduce the conductivity, and space charge measurements using the Pulsed Electro-Acoustic (PEA) method. The physicochemical characterizations were carried out using infrared spectroscopy (FTIR), calorimetric analysis (DSC). Thermogravimetric analysis (TGA) and dynamic mechanical analysis (DMA) were also conducted, but are not presented here as results did not provide any significant information.
Ageing set-up
Two ageing protocols were conducted in parallel in ovens with air circulation for 24 months:
A thermal ageing: 100°C isothermal;
A thermoelectric ageing: The temperature is also 100°C isothermal. A voltage of 90kV is applied at the core of the cable providing an electric field of 87kV/mm at the internal SC/XLPE interface and 43kV/mm at the external XLPE/SC interface. The average electric field over the thickness is 60kV/mm. For each ageing protocol, samples are collected every 6 weeks for electrical and physico-chemical characterizations. The ageing test bench is described elsewhere [4].
Electrical characterization
Current measurements on unaged cable: Current
measurements were performed under 5 temperatures (25-45-70-90-100°C), and 4 fields per temperature (5-10-15-20 kV/mm). For each electric field, a protocol of 4 hours polarization / 4h depolarization is applied. A unique sample is used for all the measurements, in fields and temperature.
Current measurements on aged cables:
Characterization after ageing is performed only under 70°C for the 4 electric fields (5-10-15-20 kV/mm).
Space charge measurements on unaged cable: Space
charge measurements are performed by PEA method directly on model cable. The length of the cable sample for PEA measurement is of 3m. The unaged cable is characterized under three average electric fields (30, 50 and 60 kV/mm) and a thermal gradient of 4.3°C (TSCin=
66.2°C; TSCout= 61.9°C). It is important to note that the
gradient within the PEA test cell is the same (4.3°C) but the internal and external temperature values are lower due to the heat sink effect of the cell (TSC_in= 34.3°C;
TSC_out= 30°C). For each electric field, a protocol of 4
hours polarization / 4h depolarization is applied. A unique sample is used for all the applied electric fields.
Space charge measurements on aged cables: Space
charge measurements after ageing are performed with the same thermal gradient as the unaged cable (4.3°C) but under an average field of 45 kV/mm. The electric field is still applied for 4 hours of polarization and depolarization.
Physico-chemical characterization
For physico-chemical analysis, measuring conditions for unaged cable and aged cable are identical.
FTIR: Measurements are carried out under controlled
atmosphere (air) in transmission mode, on samples of thickness 500 µm that have been sliced directly in the centre of the insulator.
DSC: The degree of crystallinity as well the melting
temperature of XLPE are determined by DSC [5]. The sample mass analyzed is 6 mg, taken from the core of the insulation. The DSC thermogram is obtained under nitrogen for a temperature ramp of 10°C/min
RESULTS ON UNAGED SAMPLES
Current measurements
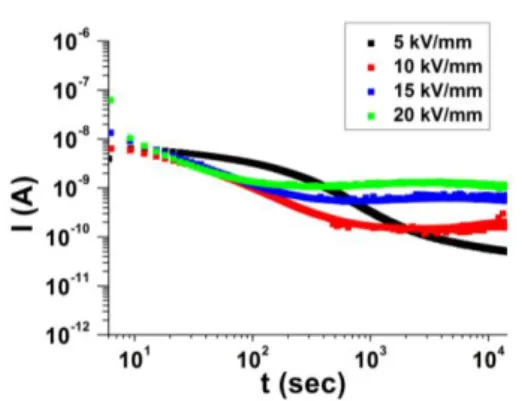
Fig. 2 presents the current as a function of time for the different applied electric fields, at 70°C. The transient current under 5 kV/mm has a special pattern. First a plateau is observed during a short duration (< 200s); then, two declining slopes appear: a steep one for the period between 100 and 3000s, followed by a more moderate one. This trend has been observed for temperatures from 25 to 70°C, but not for higher temperatures for unaged samples. The presence of the plateau could be due to the transport of ions in the sample, driven by the applied electric field. This plateau is shorter in time when the temperature is increased, and is no longer visible at a temperature of 90°C and higher. This could be due to faster transport phenomena at higher temperatures. For higher applied electrical fields, the plateau is not observed, and only the two decreasing slopes are recorded. It is to note that current measurements have been performed consecutively on the same sample: charges (electronic or ionic) can therefore not be totally released during depolarization.
Based on these measurements, the conductivity is determined using equation 1, supposing that it is independent on the field.
Fig. 1: Current function of time on an unaged cable at 70°C for different averaged electric fields
Here Ic represents the mean current over the last minute
after 4h of polarization, is the length of the collecting electrode (≈ 30cm) and U the voltage.
[1] The conductivity follows an Arrhenius law, of the form: [2] where kb is the Boltzmann's constant, Ea the activation
energy and o a pre-exponential factor. Fig. 3 presents
the variation of the conductivity as a function of temperature for 5 and 20 kV/mm. The estimated activation energy, calculated using equation 2, is of 0.82 eV, and does not vary with the electric field over the tested range.
Fig. 2: Conductivity vs. temperature on an unaged cable at 5 and 20 kV/mm
Space charge measurements
Space charge cartographies are shown in Fig. 3 for average electric fields of 30 and 50 kV/mm. Such stress values, which are significantly higher than those observed in industrial applications, are intended to amplify the phenomena. For an average field of 30 kV/mm (Fig. 3a), a small amount of positive charges is present in the insulation. For higher field (Fig. 3b), the formation of a positive space charge from the internal SC and the propagation of this charge throughout the material are clearly observed. The same conclusions also hold for an average applied field of 60 kV/mm (not presented here). Hence, the charge density generated is higher when the electric field increases. Similarly, the propagation speed of the positive charge is higher when the electric field is higher. No negative charges are observed under these conditions. It is important to note also the relaxation of the
100 80 60 40 20 10-16 10-15 10-14 10-13 Ea=0.82 eV c o n d u c ti v it y ( S /m ) T (°C) 5kV/mm 20kV/mm Linear fit at 5kV/mm Linear fit at 20kV/mm
positive charges during the depolarization phase, the
kinetics showing a decrease in the density of these charges in the volume.
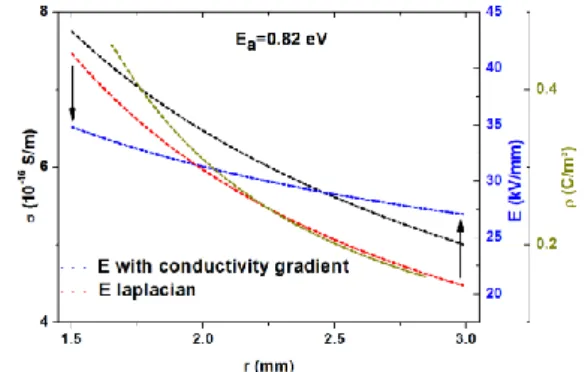
The presence of a thermal and an electric gradient under DC conditions implies a conductivity gradient. This variation of the conductivity within the cable produces a redistribution of the electric field, and the appearance of a charge density, of the form:
[3]
where is the dielectric permittivity and E the electric field. The charge density and electric field distribution have been calculated using the activation energy previously calculated (Ea=0.82eV), with the hypothesis that the
activation energy is the same at 30 kV/mm. Fig. 4 presents the electric field redistribution and the charge density issued from the conductivity gradient at steady state. With an activation energy of 0.82 eV, the charge density is maximum close to the internal electrode (> 0.4 C/m3) and minimum on the external electrode (<0.2 C/m3). The presence of positive charges in the whole insulation layer implies a homocharge zone close to the internal electrode and a heterocharge zone close to the outer electrode. This, in turn, leads to a decrease in the electrical field close to the internal electrode and an increase close to the external electrode, compared to the Laplacian field.
Infrared Spectroscopy (FTIR)
To analyse the FTIR results, we focussed on the carbonyl index, which evolution reflects a modification of the amount of carbonyl groups present in the material and therefore the rate of oxidation. This index is calculated by the ratio of the areas between the carbonyl vibration band (between 1674 cm-1 and 1759 cm-1) and the CH2
deformation band (between 1974 cm-1 and 2098 cm-1)[6] For the unaged material, the carbonyl content is 0.26.
Differential scanning calorimetry (DSC)
Only one peak is observed on the second melting cycle,the maximum of which corresponds to the melting temperature of the material, being Tm= 107.7°C for the
unaged material. On the other hand, the calculated crystallinity, linked to the area under the melting peak, is estimated at 44%.
Fig. 4: Impact of the conductivity gradient on charge density and electric field within the insulation
AGEING RESULTS
Current measurements
Thermoelectric ageingThe evolution of the conductivity as a function of ageing time is presented on Fig. 5, for the different electric fields, at 70°C. The decrease is relatively rapid over the first weeks of ageing (≈30 weeks), and seems to remain stable after that, or increase slightly for the longest ageing times. The conductivity values are one order of magnitude lower than the ones measured for the reference samples. As a first approximation one possible explanation could be that, the aged material under thermoelectric stress would trap more and more charges over the first 60 weeks of ageing. After this threshold, its propensity to trap charges would decrease. This phenomenon could be explained either by the saturation of the traps present thus preventing a trapping of the charges or by a modification of its structure, which will be analysed by physicochemical measurements.
Fig. 5: Conductivity vs. ageing time for different average electric fields after thermoelectric and
thermal ageing
A particular behaviour is observed under 5 kV/mm (Fig. 6 a). Like for the unaged cable, a plateau is present during the first 54 weeks of aging. The value of the current on this plateau decreases with ageing time. At an ageing time of 60 weeks, it totally disappears. This plateau has been associated to the presence of ions for the unaged a)
b)
Fig. 3: Space charge mapping under thermal gradient of T=4.3°C for average fields of a) 30kV/mm, b) 50
kV/mm.
Inner SC Outer SC
Inner SC Outer SC
material. In the case of thermoelectric ageing, it would then mean that during 54 weeks, ions are still present in the insulation, but their density decreases with ageing time. After 60 weeks, there would be no more mobile ions, and the 'plateau' is no more visible. It is to note that the conductivity on Fig. 5 for thermoelectric ageing presents a minimum after 60 weeks, and seems to increase after this time. This should be linked to the change of physical processes at play after this time.
Thermal ageing
The conductivity for thermally aged samples is one decade higher than the one measured for thermoelectric ageing (Fig. 5). The conductivity decreases during 24 weeks and then stabilizes for all electric fields except 5 kV/mm. As for thermoelectric ageing, this behaviour is explained by the shape of the current transient (Fig. 6 b) which presents a kind of plateau throughout the ageing process. Moreover, the value of the current on this plateau, even if it decreases with ageing time, is more than two decades higher than the value for thermoelectric ageing for the same ageing time. This means that during thermal ageing, the ions density is higher and has not been consumed after 84 weeks of ageing. Hence, the thermoelectric stress seems to consume the reservoir of ions present in the model cable.
Space charge results
Thermoelectric ageingSpace charge measurements using the PEA method require a calibration before any measurement. As the model cables are aged and a test sample is cut every 6 weeks, the calibration should take place on an already aged and hence already charged sample. This would lead
to the cancellation of the charge present before any characterization and to erroneous transfer function estimation. In order to account for residual charge, a specific data treatment has been developed, which allow obtaining the charge state of the as received samples, before any DC stressing. Fig. 7 shows the charge density profiles for different thermoelectric ageing times on as received test samples. During the first weeks of ageing, a positive charge, more intense close to the outer electrode, accumulates. This charge density tends to increase with ageing time. For 60 weeks of ageing, this positive charge becomes more distributed across the insulation (in fact it is observed between 54 and 60 weeks but not presented here), and the charge density still increases. This increase is also visible on the image charges at the SC/insulator interfaces at 1.5 and 3 mm.
Fig. 7: Charge profiles of the as received model cable for different ageing times (thermoelectric ageing)
Fig. 8 shows the space charge cartographies during characterization, i.e. under an average electrical field of 45 kV/mm and a temperature gradient of 4.3°C, after different ageing times for thermoelectric ageing. After 6 weeks of ageing (Fig. 8 a), heterocharges are present close to both electrodes, during the 4h of polarization. The charge density seems almost stable over that time. The same conclusions hold for 48 weeks of ageing (Fig. 8 b), with an increase of the positive and negative charge densities. For an ageing time above 48 weeks in the present paper, but between 48 and 60 weeks of ageing when looking at the whole cartographies, a spread of these charges across the insulation thickness in observed (see for example Fig. 8c at 90 ageing weeks). For all characterizations, the charge density remains stable during the 4 hours of polarization. These charges mainly come from the ageing protocol (i.e. 100°C isothermal, 90 kV). If we compare these charge profiles to the simulation of Fig. 4, the measured charge density during ageing is largely higher than what would be expected only with a conductivity gradient. The measured charge density has another origin, not only linked to conductivity gradient. From space charge measurements, it is also possible to calculate the Field Enhancement Factor (FEF),:
[4]
Where Eapp(r) corresponds to the Laplacian field. Results
(not shown) reveal that the maximum of FEF remains relatively stable during ageing (1.5). The FEF is located close to the outer electrode during the first 54 weeks. It then spread in the middle of the insulation, with approximately the same value (1.5) for the rest of thermoelectric ageing.
a)
b)
Fig. 6: Current fonction of time under 5 kV/mm. a) thermoelectric ageing, b) thermal ageing
a)
b)
c) Fig. 8: Charge density mapping for different thermoelectric ageing times. a) 6 weeks ,b) 48 weeks,
c) 90 weeks
Thermal ageing
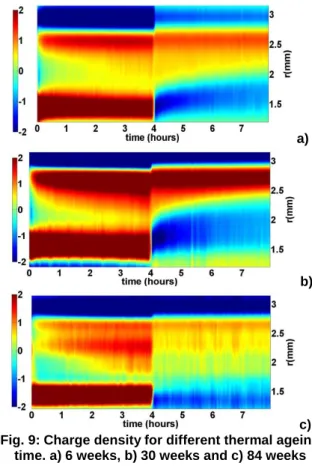
Thermally aged samples were characterized in the same conditions as for thermoelectrically aged samples. In this case, no electric stress is applied, so there is no charge on as received test samples. Fig. 9 presents the evolution of the charge density for different ageing times. After 6 weeks (Fig. 9 a), positive heterocharges appear at the beginning of ageing, close to the outer electrode. The charge density increases with polarization time. During depolarization, there is a decrease of the charge density, and negative charges are also observed close to the inner electrode. After 30 weeks of thermal ageing, the space charge evolution with polarization time is almost the same as the one after 6 weeks, but the charge density is more than twice the one measured after 6 weeks. Positive charges are also released during depolarization. After 84 weeks (Fig. 9 c), the charge density, having the same dynamics, is however lower compared to the one after 30 weeks. It is to note that for each measurement, an injection of negative charges is measured at the beginning of polarization. These charges come from the outer electrode and cross the insulator in around 5min. This crossing time increases slightly for an ageing time of 30 weeks.
For the thermal ageing, the FEF is higher than the one calculated for the thermoelectric ageing, due to the presence of a higher charge density. The maximum of FEF is of the order of 2.6 and is located next to the outer electrode (at 24 weeks) and then it decreases. Hence, in the case of space charge measurements also, it can be concluded that the thermoelectric stress drives charges, leading to a lower amount of charges measured during characterization compared to thermal ageing.
a)
b)
c) Fig. 9: Charge density for different thermal ageing
time. a) 6 weeks, b) 30 weeks and c) 84 weeks
Physico-chemical analyses
Infrared spectroscopy resultsThe FTIR analysis was performed on the 17 test samples taken each 6 week during the two ageing protocols (thermoelectric and thermal). Fig. 10 presents the evolution of the carbonyl index as a function of the ageing time for both protocols. The increase of the carbonyl index is visible for both ageing conditions. The impact of the thermoelectric stress compared to the thermal one is not visible for ageing times shorter than 60 to 80 weeks. After 80 weeks, the carbonyl index increases significantly for samples thermoelectrically aged. As no ageing was carried out after 84 weeks in the case of thermal ageing no comparison can be done. The increase of the carbonyl index can have different origins: some products have been consumed during this time, and are not able to slow down oxidation, or the electrical stress implies an additional oxidation, not visible at 'short' ageing times.
Fig. 10: Carbonyl index vs ageing time
The reason for this change of oxidation rate is yet not totally understood and would require deep analysis on
several, different samples to understand possible causes.
Differential scanning calorimetry results
The crystallinity (Fig. 11 a) and the melting temperature (Fig. 11 b) do not show any significant evolution with ageing time, for both types of ageing. A significant change in the physical structure of the XLPE would result in a significant decrease of the crystallinity and/or melting point [7]. After 102 weeks of thermoelectric ageing or 84 weeks of thermal ageing, we have not reached a significant ageing to observe this tendency, and only small fluctuations around the value for the reference material are detected.
Fig. 11: Evolution of the crystallinity and the melting temperature of XLPE as a function of time, for a
thermoelectric and a thermal ageing
DISCUSSION
Electrical measurements have shown a change in the electric behavior of the material under thermal and thermoelectric ageing, such as a substantial decrease in conductivity until a threshold of 60 weeks for thermoelectric ageing, and an increase in the space charge density. The major fact in these electrical measurements is that the observed behaviors are very different depending on whether thermal or thermoelectric ageing is considered. The first measurement of current after thermoelectric ageing at 5 kV/mm demonstrates a particular behavior. Up to 60 weeks, the plateau linked to the presence of ions is observed at short times. After this threshold in time it disappears. This behavior could be a marker of the presence of ions produced by dissociation or diffusion within the insulator that are slowly consumed with ageing time. On the contrary for thermal ageing, this specific plateau is still observed after 84 weeks. Space charge measurements show also a threshold in time at 60 weeks for thermoelectric ageing. Below this ageing time, a positive heterocharge, close to the outer electrode, is observed, with a charge density that increases with ageing time. Above 60 weeks, there is a spread of these positive charges inside the insulation. It is to note that no movement of charges is observed during the characterization time for this ageing. On the contrary for thermal ageing, space charge measurements show a comparable pattern along ageing time. Positive heterocharges are observed close to the outer electrode, which density increases during polarization time, and also when the ageing time increases, until 30 weeks. Then the charge density decreases with an increase of the ageing time. These electrical measurements show that the thermoelectric stress drives charges (ions and electronic
charges), and apparently decreases the density of ions that are present in the insulation. After the threshold of 60 weeks, other dominant processes are at play that implies a small increase in the conductivity, and a spreading of the charges. All these results have been compared to physico-chemical analyzes to identify if a change in the structure of the material is the cause of the change in behavior. The FTIR measurement shows a relatively low increase of carbonyl index for both ageing for times lower than 80 weeks. After this time, oxidation seems to increase faster for the thermoelectric ageing. The DSC measurement shows no evolution of the crystallinity or the melting temperature with ageing time for the two protocols. The structure of the material does not seem to be affected by different applied stresses.
CONCLUSION
Electrical and physico-chemical characterizations have been performed on thermoelectrically and thermally aged model cables. Electrical stress coupled to thermal stress drives the charges and makes decrease the ion density present in the insulation. This lead to a decrease in the conductivity during ageing, and a conductivity that is one decade lower than for a thermally aged cable. After 60 weeks of thermoelectric ageing, the dielectric behavior of the insulation changes. It is at that time difficult to link this change with any structural modification, as the observed threshold for FTIR measurements seems to appear at longer time, and that no variation was observed on the DSC results. More work needs to be done to fully understand the obtained results.
REFERENCES
[1] V. Eriksson, J. Andersson, V. Englund, P.O. Hagstrand, A. Kontro, 2015, “Long term performance of XLPE insulation materials for HVDC cables,” Proc. jiCable, 537-542.
[2] C.C. Zhang, Y.F. Li, M.Y. Hu, F.L. Ma, H. Zhao, and B.Z. Han, 2018, “Conductivity properties of XLPE insulation used for HVDC cable after accelerated thermal ageing,” Proc. ICPADM, 500–503.
[3] L. Bessissa, L. Boukezzi, D. Mahi, and A. Boubakeur, 2016, “Lifetime estimation and diagnosis of XLPE used in HV insulation cables under thermal ageing: arithmetic sequences optimised by genetic algorithms approach”, IET Gener. Transm. Distrib., vol. 11, 2429–2437.
[4] J. Cenes, G. Teyssedre, S. Le Roy, L. Berquez, V. Eriksson, W. Loyens, P. Hondaa, C. Moreau, 2018, “Assessment of ageing in the insulation of HVDC model cables under thermo-electric stress,” Proc. ICD, 1–4.
[5] A.P. Gray, 1970, “Polymer crystallinity determinations by DSC”, Thermochim. Acta, vol. 1, 563–579. [6] J.V. Gulmine and L. Akcelrud, 2006 “FTIR
characterization of aged XLPE”, Polym. Test., vol. 25, 932–942.
[7] L. Boukezzi, A. Boubakeur, C. Laurent, and M. Lallouani, 2007, “DSC Study of Artificial Thermal Aging of XLPE Insulation Cables”, Proc. ICSD, 146– 149.