HAL Id: hal-02165035
https://hal.archives-ouvertes.fr/hal-02165035
Submitted on 25 Jun 2019
HAL is a multi-disciplinary open access archive for the deposit and dissemination of sci-entific research documents, whether they are pub-lished or not. The documents may come from teaching and research institutions in France or abroad, or from public or private research centers.
L’archive ouverte pluridisciplinaire HAL, est destinée au dépôt et à la diffusion de documents scientifiques de niveau recherche, publiés ou non, émanant des établissements d’enseignement et de recherche français ou étrangers, des laboratoires publics ou privés.
Automatic Discovery of Families of Network Generative
Processes
Telmo Menezes, Camille Roth
To cite this version:
Telmo Menezes, Camille Roth. Automatic Discovery of Families of Network Generative Processes. DOOCN 2017: Dynamics On and Of Complex Networks III, pp.83-111, 2019, 978-3-030-14682-5. �10.1007/978-3-030-14683-2_4�. �hal-02165035�
Automatic Discovery of Families
of Network Generative Processes
Telmo Menezes∗1 and Camille Roth†1
1Centre Marc Bloch Berlin (An-Institut der Humboldt Universit¨at, UMIFRE CNRS-MAE), Computational Social Science
Team, Friedrichstr. 191, 10117 Berlin, Germany
Abstract
Designing plausible network models typically requires scholars to form a priori intuitions on the key drivers of network formation. Oftentimes, these intuitions are supported by the statis-tical estimation of a selection of network evolution processes which will form the basis of the model to be developed. Machine learning techniques have lately been introduced to assist the automatic discovery of generative models. These approaches may more broadly be described as ”symbolic regression”, where fundamental network dynamic functions, rather than just parame-ters, are evolved through genetic programming. This chapter first aims at reviewing the principles, efforts and the emerging literature in this direction, which is very much aligned with the idea of creating artificial scientists. Our contribution then aims more specifically at building upon an ap-proach recently developed by us [Menezes & Roth, 2014] in order to demonstrate the existence of families of networks that may be described by similar generative processes. In other words, symbolic regression may be used to group networks according to their inferred genotype (in terms of generative processes) rather than their observed phenotype (in terms of statistical/topological features). Our empirical case is based on an original data set of 238 anonymized ego-centered networks of Facebook friends, further yielding insights on the formation of sociability networks.
1
Introduction
Networks have become over the last decades a key notion for modeling systems in a wide variety of fields. This is especially so in social sciences where networks are being introduced in an increasing number of contexts. On one hand, they are a type of abstraction that lends itself very naturally to the representation of a great variety of social structures and interactions. On the other hand, the informa-tion technology revoluinforma-tion has been making networks both more explicitly present – for example due to the popularity of online social media – and easy to retrieve by researchers.
Being practitioners in the field of Computational Social Sciences, we have been concerning our-selves for some years with the challenge of deriving explanatory models from such complex empirical data. Networks are typically generated by phenomena that are non-linear in nature. The complex in-teractions between actors and the emergent environment they create – represented by the network itself – make it difficult to employ divide-and-conquer approaches, where the problem can be divided into smaller parts that become tractable for human researchers to reason about. In other words, it is
Figure 1: This unconventional antenna design was generated by NASA using evolutionary computa-tion to optimize its radiacomputa-tion pattern [Hornby et al., 2006]. It was used in the ST5 spacecraft. (Image in the public domain.)
not easy to intuit network formation principles which translate into simple yet successful generative models. Our belief that it makes sense to recruit computational intelligence to overcome this challenge led us to develop a method to automatically propose plausible and understandable network generators – mathematical expressions that describe how new links are formed in the network, using only local variables (e.g., the current degrees of the pair of nodes in a candidate connection). This is akin to a multi-agent system, sufficiently abstract to lend itself to the description of a variety of phenomena. In the article where we proposed the full method for the first time [Menezes and Roth, 2014], we showed that it could be used to discover plausible and simple generators not only for social, but also biological and man-made networks.
In the last years, machine learning has been gaining popularity as a scientific tool among many fields, partly because of the recent successes in deep learning. We use a different approach, coming from the Artificial Intelligence branch usually known as evolutionary computation. More specifically, we use a genetic programming approach, given that we are evolving computer programs. There are two main reasons for this choice: the nature of the problem and the goal of understandability.
Many machine learning approaches, including the training of neural networks through back-propagation, require that an optimization criterion can be represented as a convex function, for which an optimum can be found through some form of gradient descent. The space of possible network generators appears too complex for such a convex function to be defined. In this kind of situation, evolutionary computation provides a stochastic and heuristic-driven approach to find viable solutions. The term “evolutionary” comes from its inspiration in Darwinian evolution. The simple principle of preference for the propagation of the most promising individuals with random mutations unleashes a type of intelligence that, although not human-like, is distinctly creative. To illustrate this, we show in figure 1 an antenna created by NASA, that was designed by an evolutionary computation algorithm, aiming at optimizing its radiation pattern. We were interested in this ability to effectively explore a
complex search space while being able to entertain counter-intuitive solutions.
Another problem with many approaches such as neural networks if that they tend to be black boxes. Even solving the convexity problem, they might produce good results in replicating network morphogenesis, yet they do not lend themselves to creating interpretable processes. We defined our genetic programs in a simple way, and included in our method a preference for simpler programs. As we will see, they can be translated into human-readable mathematical expressions. Our results are thus comparable with classical models of network morphogenesis, for which (human) scientists are however usually in charge of proposing plausible formation processes.
In this chapter we provide a wider view of our work, and also share new results. In the next section we discuss the last decades of research on the modeling of network morphogenesis, while providing a systematization that aims to help situate our work within it. We pay special attention to the recent history of evolutionary models, of which we were not the only pioneers.
In section 3 we provide a synthetic description of our method of symbolic regression of network generators. For all the details, we invite the reader to refer to our original article.
In section 4 we present the results of novel research, aiming at finding families of generators within a dataset of networks of the same nature – in this case, ego-centered friendship networks ex-tracted from Facebook. We were interested in finding if symbolic regression would lead to sets of similar explanations. In other words, while network families are traditionally based on phenotypical resemblance [see e.g., Milo et al., 2004, da Fontoura Costa et al., 2007, Estrada, 2007, Guimer`a et al., 2007, Onnela et al., 2012, Avena-Koenigsberger et al., 2015], we show here that our approach can yield families of generative processes, at the level of genotypal resemblance. We propose a new way to measure generator similarity, allowing us to project all the generators into a two-dimensional em-bedding, where generators with similar behaviors tend to be closer. With the help of this emem-bedding, we were able to identify general patterns that many of the generator expressions conform to. From a sociological perspective, we thus also shed light on a variety of plausible mechanisms of formation of ego-centered friendship networks. More broadly, the existence of generator families further validates the behaviors embedded in the general mathematical expression characterizing a given family since it is able to efficiently reproduce the shape of several empirical networks.
2
Network morphogenesis
To illustrate the complexity of the task of intuiting efficient generative principles, we shall first review the existing efforts in this area. We thereby intend to show better where our approach may fit in and benefit this state of the art. This will enable us to emphasize the interface position occupied by our work, which aims at inferring formation processes from the network while at the same time reconstructing it, using evolutionary modeling to avoid positing prior assumptions on the shape of these processes.
The modeling of network morphogenesis has generated a substantial literature over the last decades, especially after the early 2000s when most real-world networks were shown to exhibit peculiar con-nectivity and modular features. The corresponding state of the art may essentially be organized ac-cording to two key dichotomies: the first one relates to the target of models, the second one to their foundations. More precisely, (i) models aim at reconstructing either network evolution processes or morphology; and to that end, (ii) they rely on assumptions, or input, related either to processes or to morphology. This yields the straightforward double dichotomy shown on Table 1, which includes a few canonical examples. Let us start by reviewing each category of that dichotomy.
2.1 Reconstructing processes
We first focus on the understanding of the generative processes at the lowest level, i.e. the rules governing the appearance or disappearance of nodes, and/or the formation or disruption of links. Using micro-level processes
One of the most straightforward approaches to derive these rules consists in using, precisely, data describing these very dynamics, at the node and link level. In this category, we find simple counting methods aimed at appraising the propensity of links to form preferentially more towards nodes pos-sessing certain properties — this is the archetypal notion of “preferential attachment” (PA). In its most restrictive yet most widespread acceptation, PA relates to the ubiquitous observation that links tend to attach to nodes proportionally to their degree. Following de Solla Price [1976], this acceptation essentially stems from Barab´asi et al. [2002] and Jeong et al. [2003]. Several authors extended this notion beyond degrees to deal with a variety of both structural and non-structural features, including spatial distance [Yook et al., 2002], common acquaintances or topological distance [Kossinets and Watts, 2006], similarity [Menczer, 2004, Roth, 2005, Leskovec and Horvitz, 2008] or a combination thereof [Cointet and Roth, 2010]. A more recent stream of research took this approach the other way around by proposing normative growth process and comparing them with empirical link formation. For one, Papadopoulos et al. [2012] introduced a model of link creation based on a concept of geomet-ric optimization: nodes are placed in a plane and new nodes may connect to a subset of existing nodes by minimizing a geometric quantity. The model thereby reproduces connection probabilities observed in a selection of real networks, rather than observing real data to infer connection probabilities.
Approaches inspired by machine learning have also been proposed to abstract processes by ob-serving processes. They principally aim at predicting the appearance of links by generalizing from past link creation. This stream is rather geared towards prediction success rather than behavior esti-mation, i.e. efficiently guessing which links will appear rather than providing explicit link formation
RECONSTRUCTING PROCESSES STRUCTURE U S I N G P R O C E S S E
S Preferential attachment
estima-tion,
Link prediction, Classifiers, Scoring methods, ...
Preferential attachment-based generative models, Rewiring, Cost optimization, Social Sim-ulation, Agent-Based Models (ABMs), ... S T R U C T U R E
Exponential Random Graph
Models (ERGMs), p1, p∗,
Markov Graphs,
Stochas-tic Actor-Oriented Models (SAOMs), ...
Prescribed structure, Subgraph-based constraints, Kronecker graphs, Edge swaps, ...
Table 1: Double dichotomy of canonical network modeling approaches, which generally aim at re-constructing either evolution processes or network structure, and do so by relying either on evolution processes or network structure.
rules [see Yang et al., 2015, for a discussion of the relative performance of these methods]. Scoring methods are among the simplest of these approaches: Liben-Nowell and Kleinberg [2003] first intro-duced a predictor function based on some dyadic feature (such as the number of common neighbors, Jaccard coefficients, Katz’ distance). This function produces a ranking on non-connected dyads from the observation of an empirical network formed over the learning period[t0,t]. The prediction task
then consists in going through the dyad list in descending order and comparing it with the links that empirically appeared during a test period[t,t0].
A large array of more sophisticated techniques have been used in this field, by involving, inter alia, SVM classifiers [e.g., as proposed by Adar et al., 2004] or more broadly supervised learning methods [Hasan et al., 2006], as well as matrix and tensor factorization [Acar et al., 2009] (see L¨u and Zhou [2011] and Hasan and Zaki [2011] for introductory reviews of this type of endeavors). Some authors divide the network into modules, or blocks, in order to estimate a simple (and local) probability of link formation within and between these modules, e.g., Guimer`a and Sales-Pardo [2009] who define modules through stochastic blockmodeling [Anderson et al., 1992], or Clauset et al. [2008] who use a dendrogram to both build the module partition and compute the inter-module connection probabilities. Overall, there has been an increasing attention to the time-related and spatial variability of the prediction task by considering the local neighborhood of nodes, both in a topological and temporal manner [Sarkar et al., 2014] and in a semantic fashion (e.g., by enriching the set of prediction features with content [Rowe et al., 2012] or so-called sentiment analysis [Yuan et al., 2014]). Also of note is the recent addition of evolutionary algorithms to this toolbox: for instance, Bliss et al. [2014] evolve a weight matrix describing the relative contributions of various similarity measures in predicting new connections.
Using macro-level structure
Link formation principles may also be infered from the observed network topology. The most common approach in this stream comes to econometric techniques aimed at fitting a model whose parameters are associated with specific link formation effects and which takes the whole network as an input.
Exponential Random Graph Models (ERGMs) famously belong to this class. In all generality, they rely on the assumption that the observed network has been randomly drawn from a distribution of graphs. The probability of appearance of a given graph is construed as a parameterization on a choice of typical network formation processes: be they structural (such as transitivity, reciprocity, balance, etc.) or non-structural (such as gender dissimilarity, homophily, etc.). The aim is generally to find parameters maximizing the likelihood of the observed network. Each parameter then describes the likely contribution of the corresponding category of link formation process (e.g., strong transitivity, weak reciprocity). ERGMs have been introduced by Holland and Leinhardt [1981] through the so-called p1model describing the probability of graph G as p1(G)∼ exp(∑iλivi(G)) = Πiexp(λivi(G))
where vi(G) denotes a value related to the i-th process (e.g., transitivity) and the λi are the
above-evoked parameters. p1assumes independence between dyads, which limits the model to simple
dyad-centric observables: principally, degree and reciprocity. It can nonetheless be applied to a partition of the network into subgroups [Fienberg et al., 1985] or stochastic blockmodels [Holland et al., 1983, Anderson et al., 1992], which posits a block structure, i.e. the fact that distinct groups of actors, or “blocks”, exhibit distinct connection behaviors; parameters are thus a function of blocks. Frank and Strauss [1986] later introduced “Markov graphs”, which takes into account dependences between edges and thus triads and simple star structures, and which was subsequently extended as the p∗model [Wasserman and Pattison, 1996, Anderson et al., 1999, Robins et al., 2007]. Further generalizations to more complex graph structures have lately been proposed e.g., for so-called “multi-level networks”
[Wang et al., 2013, Brennecke and Rank, 2016], which are essentially graphs with two types of nodes and three possible types of links (two intra-type and one inter-type).
When longitudinal data is available, network evolution may be construed as a stochastic process. Holland and Leinhardt [1977] then Wasserman [1980] proposed to appraise network dynamics as a (continuous-time) Markov chain. They assumed that the probability of link appearance or disappear-ance depends on a limited set of (static) parameters representing the contribution of various structural effects, such as, again, reciprocity, degree. Networks observed at different points in time are used to fit these parameters. Albeit not directly affiliated with this framework, the approach of Powell et al. [2005] proceeds in a similar fashion to determine the key factors guiding attachment of firms in a biotech sector. Stochastic actor-oriented models (SAOMs) further extend these ideas by introducing an actor-level viewpoint whereby actors establish link to optimize some objective function [Snijders, 2001]. Again, the parameters of this function denote effects deemed important for link formation (or destruction). These models also accommodate for some form of dyadic dependence, and take into ac-count non-structural features (including gender). They may include behavioral observables [Snijders et al., 2007] or rely further on machine learning techniques e.g., by extending SAOMs to a Bayesian inference scheme [Koskinen and Snijders, 2007]. In practice, SAOMs may be used to study non-structural effects linked to gender, racial, socioeconomic or geographical homophily, as demonstrated for instance in an online context on Facebook friendship [Lewis et al., 2012]. ERGMs and SAOMs assuredly share several traits, and it is also possible to develop ERGMs in a longitudinal framework as temporal ERGMs (or TERGMs), where the estimation for a graph at time t depends on the graph at t− 1 [Hanneke et al., 2010]. For a more detailed comparison between SAOMs and ERGMs, see Block et al. [2016, 2018].
On the whole, the advantage of these approaches over the previous process-based methods lies in the joint and concurrent appraisal of a variety of effects (each statistical model may consider an arbitrary number of variables to explain the shape of the observed network), with the drawback of reducing the contribution of each effect to a scalar quantity.
2.2 Reconstructing structure
The second part of the double dichotomy (right-side on Table 1) relates to understanding the morpho-genesis of the network itself. It may again be roughly divided into two broad categories, depending on whether approaches are based on a given growth process or on the topology of the network itself. Using processes
A myriad of models have been proposed to reconstruct network structure from normative assump-tions. This is perhaps the most well-known and natural approach in statistical physics. At the core of these approaches lies generally a master equation or a master process featuring a certain number of key and oftentimes stylized ingredients. These ingredients correspond to an ideally small subset of canonical growth processes, defining the essential rules for adding –and, rarely, removing– nodes, links, and most importantly towards which types of nodes. The goal often consists in reproducing the observed connectivity (such as degree distributions), cohesiveness (such as clustering coefficients) or connectedness (such as component size distributions).
One of the earliest successful attempts at summarizing network morphogenesis with utterly simple processes consisted again in analytically solving simple PA based on node degree [Barab´asi and Al-bert, 1999]. Models based on a general notion of PA have been extended in various directions: taking into account the age of nodes [Dorogovtsev and Mendes, 2000], their Euclidean distance [Yook et al.,
2002, Guimer`a and Amaral, 2004], their intrinsic fitness [Caldarelli et al., 2002], their rank [Fortu-nato et al., 2006] or their activity [Perra et al., 2012]; formalizing a notion of competition between nodes to attract new links [Fabrikant et al., 2002, Berger et al., 2004, D’Souza et al., 2007]; copying links from “prototype” nodes [Kumar et al., 2000] or using random walks [V´azquez, 2003]; introduc-ing preferences for transitive closure [Holme and Kim, 2002] or for specific groups of nodes (based on an a priori taxonomy [Leskovec et al., 2005] or an affiliation network [Zheleva et al., 2009]); or mixing structural PA with semantic PA (e.g., Menczer [2004] who introduces the so-called “degree-similarity” model after observing that connected web pages are rather more similar, or Roth [2006] who mixes group-based PA and semantic PA). Group-based PA may also be found in models which describe the addition of groups rather than dyadic links, such as Guimera et al. [2005]: the network evolves through the iterative addition of teams and thus links between all their members, assuming a certain propensity to introduce newcomers and repeat past interactions.
Another class of models is based on link rewiring. One of the simplest versions was introduced by Watts and Strogatz [1998], who start with a ring lattice of fixed degree and reconnect links with a given probability p. This led to a discussion of the resulting structure in terms of low path length and high clustering coefficient, or “small-world”. Colizza et al. [2004] later reproduced these two statistical features by adopting a distinct approach based on a rewiring process aimed at optimizing a global cost function, in a way inspired by Fabrikant et al. [2002].
Finally, a broad class of network models, especially in the social realm, falls into the category of agent-based modelsas soon as they rely on a relatively rich combination of processes. They generally aim at a specific application field which, in turn, requires detailed assumptions: as such, they typi-cally offer a good combination of realism (they benefit from a stronger sociological grounding) and tractability (their study generally requires to resort to simulation). Examples of sophisticated models have been abundant in the social simulation literature from early on and are now present in a wide array of works at the interface with statistical physics and computational social science. It is way beyond the scope of this paper to attempt an overview of the wide diversity of agent-based network models. Let us nonetheless casually mention Gilbert [1997], who models the heterogeneous distribu-tion of papers authored by scientists in a given field, and further reproduces the clustering of nodes in a semantic space, based on simple copying rules and the notion of quanta of knowledge called ‘kenes’, by analogy with genes; Pujol et al. [2005], who build various social exchange network shapes by combining various agent decision heuristics and cognitive constraints; and Goetz et al. [2009] who re-produce blogger posting behavior and citation networks through a combination of random-walk-based generators and post selection rules.
Using structure
Reproducing graph structure directly from graph structure essentially means showing that some struc-tural constraints entail the presence of other strucstruc-tural features — for instance by demonstrating that a certain number of connected components or a strong proportion of some sort of triads follows from a given degree or subgraph distribution. Early attempts precisely focused on prescribing a power-law degree sequence [Aiello et al., 2000] and, shortly thereafter, any degree sequence [Newman et al., 2001]. Several methods have later been proposed in the case of more sophisticated constraints, such as prescribed degree correlations [Mahadevan et al., 2006], subgraph distributions [Karrer and Newman, 2010], or recursive stuctures [Leskovec et al., 2010].
A typical challenge consists in being able to sample the space of graphs induced by a given set of constraints. Some approaches manage to provide a closed-form expression of several average statistical properties of the induced graph space, as has been done for the typical path length or average
clustering coefficient by Newman et al. [2002]. When this is not possible, an alternative consists in sampling the graph space through iterative exploration: the initial empirical graph is typically transformed by swapping pairs of edges while respecting the original constraint [Rao et al., 1996, Gkantsidis et al., 2003]. This corresponds to a navigation in a meta-graph gathering all graphs of the target space. Beyond simple constraints, exhaustive navigation is usually impossible. Tabourier et al. [2011] practically address this issue with an empirical sampling method denoted as “k-edge switching”, iteratively swapping groups of (k) links in order to cover an increasingly large portion of a given graph space.
2.3 Combining both: evolutionary models
In all four positions of the double dichotomy, the challenge generally consists in proposing one or several processes or constraints which will be key to explain network formation — be it transitivity, centrality, homophily, etc. The importance of such and such mechanism may be either assumed a priori, by looking at its effect on the network evolution, or verified a posteriori, by confirming its existence and appraising its shape during the network evolution. In all cases, intuition plays a key role. Yet, creating these models requires insights that may sometimes be unconventional.
To alleviate this dependence, evolutionary algorithms were recently used to automatically propose sets of mechanisms inferred from the observed structure. It differs from the above-mentioned meth-ods in that it jointly uses the structure to reconstruct processes and the processes to reconstruct the structure. More precisely, network structure is used to devise link formation processes and, in turn and iteratively, these discovered processes are precisely used to reconstruct the structure.
Some of the earlier approaches introduced template models based on sets of possible specific ac-tions (e.g., creating a link, rewire an edge, connecting to a random node, etc.). Acac-tions have been organized in various manners: first as a fixed chart, resembling the typical structure of agent-based models [Menezes, 2011], as a sequential list of variable size [Bailey et al., 2012, 2014, Harrison et al., 2015, 2016] or, very recently, as a matrix whose weights describe the relative contribution of each action [Arora and Ventresca, 2016, 2017]. In all these works, the evolutionary process aims at au-tomatically 1. filling the template model with actions and 2. fitting the corresponding parameters. As is typical in evolutionary programming, it involves a fitness function which evaluates the resem-blance between the empirical network and networks produced by the evolved model. Fitness functions rely on classical structural features (degree distributions, motifs, distance profiles, etc.). Models are iteratively evolved along increasing fitness values.
In parallel, we further proposed an original approach based on genetic programming and aimed at inferring arbitrarily complex combinations of elementary processes, construed as laws [Menezes and Roth, 2013, 2014].1 We first introduced a generic vocabulary making it possible to describe network evolution in a unified framework, as an iterative process based on the likelihood of appearance of a link between two nodes, construed as a function on node properties in the currently evolving network (i.e. a form of generalized preferential attachment) — relying on structural features such as distance, connectivity, as well as non-structural characteristics. Representing these functions as trees enabled us to apply genetic programming techniques to evolve rules which are then used to generate network morphologies increasingly similar to the target, empirical network.
This technique may be denoted as “symbolic regression”, for the goal is to use genetic program-ming to evolve free-form symbolic expressions rather than fitting parameters associated to fixed sym-1In terms of potential applications, this approach has been evoked in the context of human connectome modeling [Betzel
et al., 2016, Adolphs, 2015], as an alternative to conventional social simulation models [Amblard et al., 2015] or to appraise matrimonial preferences from genealogical networks [Menezes et al., 2016].
bolic expressions: we automatically evolve realistic morphogenetic rules from a given instance of an empirical network, thereby symbolically regressing it. This strategy is inspired by the work of Schmidt and Lipson [2009] who extract free-form scientific laws from experimental data. We first applied our method on kinship networks [Menezes and Roth, 2013] which led to the publication of a much more general manuscript [Menezes and Roth, 2014]. One remarkable result consists of the abil-ity to systematically and exactly discover the laws of an Erd˝os-R´enyi or Barab´asi-Albert generative process from a given stochastic instance. Distinct, realistic and compact laws for a variety of social, physical and biological networks could also be found.
We now describe in detail the core of the symbolic regression approach.
3
Symbolic Regression of Network Generators
We construe network generation as a stochastic process where edges are added iteratively, following some probability-based preference. Our approach is embedded in a generalized preferential attach-ment framework centered around the notion of generator which is a scoring function providing a way to prefer some link over the others. A generator thus assigns a score si j to all edges(i, j). At each
step of the network construction, a random sample S of candidate edges is drawn, among which a new edge is stochastically selected with a probability Pi jproportional to si jsuch that:
Pi j = si j
∑
i0, j0∈S si0j0 (1)In practice, we forbid negative values and replace them with 0; in the special case where all weights are zero, they are all set to 1 for mathematical consistency.
In other words, generators implement an (arbitrarily complex) form of PA restricted to a random subset of links. Our core aim thus consists in designing a process able to automatically discover score computation functions s which yield networks comparable to a target empirical network. We construe generators as tree-based computer programs which represent mathematical expressions. Tree nodes are operators while leaves are variables and constants. Operators include classical arithmetic opera-tions{+, −, ∗, /}, general-purpose mathematical functions: {xy, ex, log, abs, min, max}, conditional
expressions:{>,<,=,= 0} and an affinity function (ψ, which we will further describe below). Vari-ables are classical monadic or dyadic network measures which apply to the two nodes participating in the edge(i, j) to be scored: centrality degrees of each vertex (ki and kj), topological distance
be-tween the two vertices (d),2and their sequential identifiers (i and j, whose role we also discuss later on). We limit here the presentation of our approach to undirected networks with a fixed set of nodes, which fits our empirical material of Facebook ego-centered friendship networks. Nonetheless, it can straightforwardly be extended to directed networks (as in our original work) and the regular arrival of nodes.
This simple setting provides a language for describing generators and expressions which model and produce non-linear and non-centralized growth mechanisms. We now need a way to measure the similarity between the target network and generator-produced networks. This will provide the basis for defining the fitness function of our genetic approach. To this end, we first use a combination of distributions related to various topological aspects of the network, such as degree and PageRank 2To compute distances we use on heuristic based on a random walk, for (1) the exact computation is computationally
intensive and, what is more, (2) new connections are also likely guided by a hop-by-hop navigation mechanism instead of an omniscient knowledge of the exact number of hops separating two given nodes.
s
i,j= Ψ(4, i.k, 0)
Ψ * i k 4 best min fitness 2. Randomly select one of thecandidates 3. Mutate tree 4. Generate synthetic network 5. Compute dissimilarity to target network 6. Replace one or both
if improved CURRENT CANDIDATES 1. Random generator 3 4 1 5 2 s4,5 s1,2 s1,3 3 4 1 5 2 3 4 1 5 2 new 4.2. Randomly select one edge
(Pij) 4.1. Select candidate edges (S) and assign scores s(i, j) 0 TREE-BASED REPRESENTATION OF AN EXAMPLE GENERATOR REAL SYNTHETIC program 36 (9, exp(ki), .49) program 153 (4, ki, .67)ki program 56 exp(((i > 0! 2, j) > (kj> ki! i, ki)! d, j)) program 103
((kj< log(d)! 0, j) < .17 ! kj, (min(4, i), exp(kj), d))
program 172
exp((ki> kj! (ki= d! 9, kj), .86))
Pij= Psij
(i0,j0)2S
si0j0
Figure 2: Evolutionary loop including the synthetic network generation process. The outer part of this figure describes evolution at the generator population level, while the framed part on the right describes the evolution of a network for a given generator.
[Brin and Page, 1998] centralities, distance distributions and triadic profiles [Milo et al., 2004]. We then compute dissimilarities between the respective distributions: for centralities, we apply the Earth mover’s distance (EMD) [Ling and Okada, 2007], for the other distributions, we simply compute use
a ratio-based dissimilarity metrics. Of course, other metrics and dissimilarity measures may be used; we made these choices as a simple and intuitive trade-off between tractability and topological realism, which happens to work well.
By minimizing these dissimilarity measures, we get closer to the target network. This corresponds to a multi-objective optimization problem where some dissimilarities have to be minimized to the possible expense of others. We adopt a simple strategy by considering all dissimilarities in regard to the improvement over a random network. In other words, we divide the dissimilarity between the target network and a generated network by the dissimilarity between the target network and the average of 30 Erd˝os-R´enyi (ER) random networks of the same size (same number of nodes and edges as the target). For a given metric, this means that if the dissimilarity between the target network and the ER average is, say, 5 and the distance from the target network to the generated network is 3, the ratio is 3/5. The smaller the ratio, the better the improvement — a ratio of 1 corresponds to no improvement. The evolutionary algorithm then aims at improving generators by minimizing the highest of these ratios. This defines our fitness function: the lower its value, the better the fitness.3
Our framework relies on a further feature: we allow node heterogeneity, i.e. we assume that not all nodes are and thus behave the same, irrespective of their structural position. Some actors of a social network may for example be intrinsically more likely to form ties with a specific class of actors. Here, we simply take heterogeneity into account through the sequential index of the node i∈ {1,..,n}. These indices, considered as identifiers, may be used as a variable by a generator, and may thus introduce a priori distinctions in actor types. As we shall see, this element is key in the case of friendship networks where social circles play an essential structuring role.
Consider for instance the generator s(i, j) =1
i. It induces a probability of edge creation entirely
determined by the identifier of one of its extremities. Nodes have distinct a priori propensities to originate connections, distributed following a hyperbolic curve. While integer identifiers may appear to introduce heterogeneity in very simplistic way, they can be combined with the other building blocks in an infinity of manners — and our results below show that indices were indeed used in sometimes creative ways.
Furthermore, index-based heterogeneity may be leveraged to define generators where certain ver-tices have natural affinity for each other. This brings us to the affinity function ψ, which uses the modulo operation to partition the identifier space into a certain number of groups. It relies on three operands: a constant, g, the number of groups; and two expressions, a and b, which are conditional outputs. If target and origin nodes i and j are equal modulo g, and thus belong to the same group (i.e. in case of “affinity”), the function returns a, and b otherwise:
ψg(i, j, a, b) =
(
a, if (i mod g)≡ ( j mod g)
b, otherwise, (2)
From now on, we consider i and j as implicit variables and denote the function as: ψg(a, b).
Combining all these elements into an evolutionary loop makes it possible to generate plausible models for network generators, as summarized on Fig. 2. Several runs with the same target network may generate different models — although they appear experimentally to converge onto similar be-haviors. This leaves it to practitioners to select among the various options, conceivably by involving domain knowledge. A more objective consideration pertains to a trade-off between simplicity and precision. Since generators are essentially programs, complexity may be simply appraised through 3ER is admittedly a basic null model. Yet, opting for a richer model is likely to induce bias: for instance, a fitness
function based on a comparison with a configuration model would precisely incorporate target network degree distributions, making it impossible to directly approximate them.
program length, an upper bound on the Kolmogorov complexity [Ming and Vit´anyi, 1997]. We thus apply a quantified version of Occam’s Razor: all other things being equal, we choose the model with the lowest program length.
4
Families of Network Generators
This approach provides the equivalent of an artificial scientist proposing plausible network models, replacing the intuition of the modeler. Using a biological analogy, it also makes it possible to discuss networks in terms of their plausible genotype (i.e., generator equations) rather than phenotypes (i.e., a series of topological traits).
Phenotypical traits assuredly provide the basis for appraising the quality of structural reconstruc-tion and, by extension, for defining fitness funcreconstruc-tions attentive to such and such topological property [for an early yet already comprehensive review on the possible properties, see da Fontoura Costa et al., 2007]. They also provide a good foundation for comparing networks with one another: a series of studies has indeed been devoted to defining network families by relying on triadic profiles [Milo et al., 2004], canonical analysis of various measures [da Fontoura Costa et al., 2007, section 19], adjacency matrix spectrum [Estrada, 2007], blockmodeling [Guimer`a et al., 2007], community structure [Onnela et al., 2012], hierarchical structure [Corominas-Murtra et al., 2013], communication efficiency [Go˜ni et al., 2013], graphlets [Yaveroglu et al., 2014]. Note that this last method has been precisely used by Charbey and Prieur [2018] to phenotypically categorize the empirically networks we are dealing with here. Phenotypical traits have also been the target of evolutionary algorithms in M¨artens et al. [2017], who symbolically regress formulas describing the phenotype of the network, e.g. finding an explicit expression for the diameter of various classes of networks as a function of the number of nodes, links, or some eigenvalues of the adjacency matrix.
By contrast, symbolic regression enables the comparison and categorization of networks based on their plausible underlying morphogenesis rules — as such a genotypic categorization. The core of the present contribution consists in applying our approach on a collection of networks of the same nature, unlike Menezes and Roth [2014] which addresses a limited number of networks of different natures — biological, social and man-made, both directed and undirected.
Here, we will exhibit families of generators, both in terms of their function and in terms of their expression. Their existence further suggests that a single mathematical expression and thus explana-tion may apply to a number of distinct empirical networks. In turn, it is thus even likely to correspond to a widespread class of actual generative behaviors.
4.1 Protocol
We use 238 anonymized ego-centered networks of Facebook friends which were randomly sampled from about 10,000 such networks collected in a large-scale online survey organized within a collab-orative project called “Algopol” (consenting participants accepted to give access to their publication and network constitution history). Unlike other social networks such as Twitter, with concepts of “following” and “being followed”, Facebook friend relationships are reciprocal and thus undirected. Furthermore, in ego-networks, ego is by definition connected to every other node, so its presence would likely lead to more complex generators without any added explanatory power. We thus discard ego and all of their links.
For each network, we performed five evolutionary search runs. We then selected the generator discovered by the run that attained the highest fitness. This is a simple strategy to avoid low-quality
local optima.
4.2 A Measure of Generator Dissimilarity
To identify families of generators and to visualize how similar they are in relation to each other, we start by introducing a measure of dissimilarity between pairs of generators. We understand the generator expression as the genotype and the network created using the generator as the phenotype. As in biology, different phenotypes can correspond to the same genotype. In our case, and beyond the intrinsic stochasticity of the generative process, this is trivially true because we can use the same generator to create networks of different sizes – both in numbers of nodes and edges. It is also true that different genotypes can create similar phenotypes. Notions of dissimilarity could be imagined both on the genotype and phenotype sides. On the genotype side, this could be a measure of program dissimilarity, for example something akin to an edit distance. On the phenotype side, it could be a comparison of generated networks. We opted for the latter: we look for collections of generators that produce similar networks, and then check these groups to see if they contain regularities or competing explanations. In the end we propose a qualitative-quantitative analysis of families of generators.
Comparing networks is not a trivial task, and it becomes even harder for networks that do not have the same number of nodes and edges. With our generators, we are in a position to control this latter aspect. We use the generators to create synthetic networks that do not have the varied topologies of the ones they were derived from, but instead have a predetermined number of nodes and edges, facilitating subsequent comparison. We chose to generate networks of 1000 nodes and 10000 edges, deemed to be large and dense enough for comparisons to be meaningful, and yet not so large that the task of comparing all pairs would become computationally intractable.
For the comparison itself, we employ a modified version of the fitness function that was used dur-ing the generator discovery process. The fitness function for undirected networks uses four distribution distance measures: kdfor degree; PRd for PageRank; dd for distance and τd for the triadic profile. In
that case, these measures are used to compare a synthetic network against the target network. Here, we will use them to compare pairs of synthetic networks created by the discovered generators. Being n= 238 the number of generators we consider four n× n matrices of pairwise distances, one for each measure: Dk, DPR, Dd and Dτ. To make these measures directly comparable, we produce normalized
versions of each of these metrics in the following way:
D0i, j= Di, j− mini0(Di0, j) maxi0(Di0, j)− mini0(Di0, j)
(3) The global dissimilarity function δ(i, j) is then simply the sum of the four normalized distances between two generated networks:
δ(i, j) = D0ki, j+ D 0 PRi, j+ D 0 di, j+ D 0 τi, j (4)
Notice that the above normalization process can lead to different estimations of the several dis-tances depending on the direction, because the normalization process is not symmetrical. We therefore finally use a symmetrized dissimilarity function σ0 defined as σ0(i, j) = σ (i, j) + σ ( j, i).
4.3 Two-dimensional Embedding and Families
To produce a visualization of the landscape of generators according to the above dissimilarity measure, we model these dissimilarities as distances in geometric space. We apply a metric Multi-Dimensional
Scaling [Borg and Groenen, 2005] algorithm4 (MDS) to map them into a two-dimensional space. Distances between pairs of points are set to match dissimilarity values as closely as possible.
We present the result of this two-dimensional embedding in figure 3.
We also performed a manual analysis, looking for patterns of similar generators in mathematical terms, i.e. at the level of the explicit formula. We identified 11 such strong patterns, and labeled every generator that conforms to one of them. We refer to sets of generators that conform to such patterns as families (n0= 91). The other ones are described as unclassified (n00= 147).
This manual classification is presented on table 2, along with the actual generators assigned to each family.5
The legend of figure 3 shows names that we gave to each family in table 2, based on their main common primary mathematical features (we detail the meaning of these names below). A first inter-esting observation of this result is that the families are distributed in spatial clusters. Visual inspection makes it quite clear that mathematically close generators appear in similar regions of the 2D plane, some being much more spread than others. Another interesting point is that, although many generators are left unclassified, families are spread across most of the extent of the overall spatial distribution.
In the middle-right region of figure 3 we can find two families that correspond to well-known network models. The first is family ER, of the generators that are defined by some constant value c. They assign the same probability to every potential edge, and thus correspond to Erd˝os-R´enyi random graphs. The second is family PA, of the generators that are defined by the degree variable k. They assign to each potential edge a probability that is proportional to the degree of either the origin or the target, and thus correspond to pure Preferential Attachment networks. It is interesting to observe that these two quintessential network formation explanations show up in our generator set, albeit in a small quantity. Further, they are relatively close to each other in respect to many other, more complex explanations. A third family of very simple generators (family ID), is the one where the probability of a potential edge is proportional to the sequential identifier of either the origin or the target. These generators are defined by the expression i. These are the simplest possible generators that take into account non-topological or exogenous features of nodes. This family is situated between the ER and PA families. Two other families exhibit expressions which roughly appear to be exponential versions of ID and PA. We named them ID’ and PA’: they nonetheless behave very distinctly as the exponential induce a strong winner-takes-all effect on the highest value of the main variable (i or k). They are also situated in parts of the space distinct of their linear counterparts.
Notice that for these simple cases, although many of the generators are exactly the same, their positions do not coincide precisely in the spatial embedding. This is due to the fact that the generative process is stochastic, and some random variation is to be expected.
The first five families are very simple. The other eight have a very strong resemblance with one another: they all use the affinity function, based on some constant number of affinity groups. This means that link dynamics is strongly influenced by the existence of a certain number of classes of nodes which likely matches underlying Social Circles; we denote this family as SC. A simple interpretation for this is indeed that ego networks are a sample of social groups that ego belongs to. For example: school friends, family, work colleagues and so on. It makes sense that these groups are much more densely connected within themselves than between them, as they correspond to separate social
4We used the metric MDS manifold embedding provided by the scikit-learn Python module.
5Given the undirected nature of these networks, we simplify the notation for generators that use only variables from
either the origin side or target side. Suppose we have the generator 3.ki+ d; here, this is equivalent to 3.kj+ d, so we simply
Figure 3: Network generators mapped into a two-dimensional layout according to their pairwise dis-tances. Different colors and shapes indicate families of generators that were manually identified as semantically similar. The legend shows the pattern that identifies each family.
Family List of generator functions and corresponding network numberhIDi
0.08 0.88 0.95 54.6 0.62 6.0
ER h14i h50i h78i h82i h108i h124i
c (max(ki, i) = 0→ 0,0.63) h198i ID i i i h58i h109i ID’ ei ei ei h18i h139i k k k k k k
PA h26i h81i h100i h105i h111i h134i
k k k k
h145i h170i h227i
PA’ kjki (min( j, .66) > ki→ j,ekj)(min(( j=0,kj,ki),e k j))
kikj
kikj h0i h47i h193i
SC-α ψ8(k2j, .62)− ki ψ7(k3, 4) ψg(ks, c) h69i h126i ψ3(2k, .48) ψ9(eki, .49) ψ4(ek, 1.1) ψ5(e max(ki,k j ) ki , ki) ψ5(e k, 1)
SC-β h3i h36i h39i h80i h90i
ψg(ek, >12) ψ4(e
k, 1) ψ
8(ek, d) ψ4(k, .67)k ψ5(ek, 1.7) ψ3(ek, 2) h110i h138i h153i h213i h224i
ψ9(kk, 0) ψ6(3k, 0) ψ4(4· k5, 0) ψ8(kk, 0) ψ3(eki+kj, .05) h23i h31i h41i h57i h97i
SC-γ ψ3(ek, 0) ψ3(2k, 0) ψ6(eψ5(1,k), 0) + .07 ψ7(ek, 0) ψ4(ek, .06)
ψg(kB,∼ 0) h104i h127i h141i h155i h157i
ψ2(ki· ekj, 0) ψ4(ek, 0) ψ5(k7, .01) ψ5(ek, .03) h164i h177i h235i h236i
ψ4(ei, eki) ψ4(ij, kj) ψ2( ji, ki) ψ3(ei, ki) ψ3(ei, e7) ψ3(ei, 1)
SC-δ h6i h89i h92i h121i h137i h148i
ψg(ei,∗) ψ2(9i, 99) ψ3(ei, j) ψ3(ei+ j−d, e5) ψ4(9i, 9)
h181i h184i h196i h202i
9ψ3(iki, 2ki) ψ4(ikj, 6kj) ψ5(iki, ki) ψ9(iki, .1ki) ψ2(iki, ki) ψ7(iki, 7ki)
h9i h24i h25i h37i h75i h91i
SC-ε ψ6(iki, .44ki) ψ4( jki, .38) ψ3( jki, kj) ψ4(i log(ki), 0) ψ3( jki,k4i)
ψg(ik,∗) h106i h107i h115i h165i h166i
(kjki
.66 + d)ψ4( j, .61) ψ3(ikj, 2kj) ψ3(ikj, kj) ψ3(iki, 0) ψ4(iki, 3ki)
h188i h194i h206i h209i h218i
ψ7(i, 0)kj 7dψ4(iki, .48) ψ4(i k j
kj, .18) ψ8(i
ki, 2) ψ
4(iki, 0) ψ4(16iki, d)
SC-ζ h68i h93i h95i h125i h156i h179i
ψg(ik,∗) ψ9(d jki, 0) ψmin(i,4)(iki, 0) ψ5(9 jki, .03)
h185i h195i h219i
ψ5((iki)2, i) ψ5(iki2, 6) ψ4(2980.96k2, 2k) ψ2(ikj2, kj2)
SC-η h16i h128i h132i h163i
ψg(ik2,∗) ψ7(ψi(.5, kj2), 0) h182i
SC-θ ψ4(k, 0)− .99 ψ7(k, 0)− .93
ψg(k, 0)− 1 h8i h83i
Table 2: Generator expressions for each family. c represents a constant value, s a small exponent, B a big exponent and∗ is used as a placeholder for an arbitrary expression.
ERh198i PAh190i IDh109i SC-γ h97i SC-δh181i SC-η h128i
(Real)
(Synthetic)
Table 3: Visual representation of some empirical ego-networks (top row) with their reconstruction (bottom row), for a selection of evoked families. ER, PA and ID are featured; each of the three main subfamilies of SC are also present (generators 97, 181 and 128 are all based on an affinity function of parameters 3, 2 and 5, respectively). Note that three of the empirical networks (109, 128, 181) feature very small disconnected components, gathering no more than a handful of nodes which have not been drawn here for clarity purposes.
spheres. The affinity function provides a very straightforward way of generating this type of linking behavior. The constant number of groups present in the first parameter of affinity functions represents an estimation of the number of social groups that ego belongs to. In our previous work [Menezes and Roth, 2014] we included one Facebook ego network in the diverse set of networks used, and the generator found for it was also based on an affinity function. In fact, under the typology we present here, it would be classified as an SC-ε generator. From the biological, social and technological networks analyzed in that work, the Facebook ego network was the only one based on an affinity function with a constant number of groups. This presents us with additional empirical evidence that this is in fact a characteristic signature of ego-centered social networks.
To illustrate further these families, we provide a few visual examples of network generators on table 3. For each selected generator of a given family, we put along the original empirical network and its reconstruction using the same number of nodes. Spatialization follows a force-directed layout. The number of social circles parameterized on ψ may be seen to be faithful to the original number of clusters in the real network.
SC families differ in the linking behavior for nodes deemed to belong to the same group. Some of them are purely based on topological factors (families α, β , γ and θ ), one only on exogenous factors (family δ ) and some on a combination of both (families ε, ζ and η).
The largest family is ε, which assigns probability of in-group links as a linear combination of current degree (k) and exogenous factors (i). The second largest family by number of generators found is family γ, and it is also the one that is the most spread in the spatial embedding. In this family, the probability of in-group connections is purely driven by topology, as an exponential of the current degree of one of the nodes. We can think of it as a form of super-preferential attachment within social circles – current popularity within the group is highly rewarded. For most cases, the probability of connection between groups is given by a relatively small constant, and for a few it is zero.
Some questions remain. Why are some generators so simple, and why are more than half of the generators so diverse that they cannot be classified into families? In an attempt to attain a better
ER ID PA SC ID PA SC PA SC PA SC PA SC p20 p40 p60 p80 p100 0 20 40 60 80 100
Figure 4: Top panel, and bottom-left: Boxplots of numbers of nodes, edges and densities for the underlying networks of the various families, as well as all, unclassified and classified. Horizontal dashed line indicates overall median. Bottom-right: Stacked plot of family ratio per percentile of network density.
understanding, we created boxplots of the distributions of node and edge counts for the underlying networks per family, as well as for all generators, and for classified and unclassified generators. These plots are presented in figure 4, as well as a stacked plot of family ratio per percentile of network density. Some interesting facts are revealed.
The families of simpler generators (ER, ID, ID’, PA and PA’) have both node and edge counts well below the median. This could indicate that these simple generators correspond to cases where there is not enough data to form a more complex theory. The simplest underlying behavior is captured, corresponding precisely to the simple archetypal explanations of preferential attachment and random behavior. Maybe these networks are small because the corresponding user is not very active, or does not have many social connections, or maybe because they joined recently and the networks are at their initial stages of growth. When the latter case is true, our results seem to indicate that they may be assignable to a more complex family when they develop more. Under this assumption, families SC paint here the more relevant part of the picture of network growth dynamics.
The unclassified set corresponds to networks that are slightly larger than the mean, both in num-bers of nodes and edges. From this observation we formulate two hypotheses. The first one is that the unclassified set really does correspond to a complex variety of behaviors. It could be that, given one or two orders of magnitude more ego networks, more families would be found. The second one is that
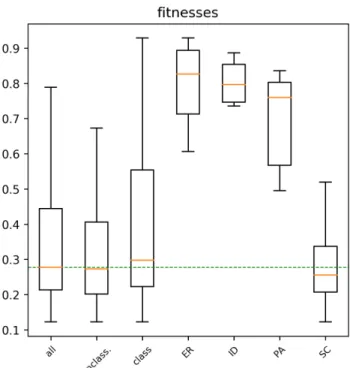
Figure 5: Boxplots of best fitnesses achieved (lower is better) for the underlying networks of the various families, as well as all, unclassified and classified. Horizontal dashed line indicates overall median.
it is more difficult for evolutionary search to find simple generators for these larger networks, but that given more runs, they would emerge.
In an attempt to test the second hypothesis, in figure 5 we plot the best fitnesses achieved for the underlying networks, again per family, all generators, classified and unclassified. Here we find that generators of the SC family attain slightly better fitness (both for the median and worst cases) than generators of unclassified networks. This lends some credence to the second hypothesis. Furthermore, we observed that for the entire SC family, the generator with a simple pattern was only found once, and it always had the best fitness of the five runs. It seems thus likely that, given more evolutionary search runs per generator, at least part of the unclassified networks would fall into a family.
It is not possible to know if the families are exhaustive or the simplest that could be found. In-vesting more computational power on this problem could always yield simpler yet harder to find explanations, both for the classified and unclassified cases. It could also show unclassified networks to belong to a known family, or to a new family. As with many heuristic methods, the best we can do is trust some stability criteria (e.g., stop at a certain number of runs without anything new being found).
5
Final Remarks
We believe that several interesting explorations can stem from the symbolic regression of network generators. After the research work presented in this chapter, we are left encouraged by the potential of a genotype-based approach in describing families of generators. To move to a larger scale, it is necessary to go further in the methods to identify similar generators at the semantic, i.e. mathematical
level. This is a hard but exciting computer science problem.
It would also be interesting to map the space of possible generators, by searching not for gen-erators that target specific networks, but instead that attempt to generate networks as divergent as possible from those already known. Combining this exploration with family identification could lead to insights related to the families of generators found in different scientific fields and types of phe-nomena, as well as to families that do not correspond to networks found in any empirical data. This could reveal potentially interesting network designs, as was the case with the evolved radio antennas. Our current method assumes homogeneous behavior across the network. Hybrid methods com-bining community detection with symbolic regression could lead, in certain cases, to more powerful explanations with different generator expressions per sub-network.
Another important challenge is that of targeting dynamic networks. This will require a fitness function that takes into account different stages of growth of a target network, and that leads to gener-ators that can be validated to not only produce a plausible state of the network at a certain stage, but a plausible growth process overall.
Acknowledgements
We are grateful to the members of our “Algopol” project team (ANR-12-CORD-0018) who orga-nized most of the Facebook survey, including Ir`ene Bastard, Dominique Cardon, Rapha¨el Charbey, Guilhem Fouetillou, Christophe Prieur and St´ephane Raux. We further acknowledge interesting dis-cussions with Jean-Philippe Cointet and David Fourquet regarding generative families, as well as the constructive feedback of our anonymous reviewers. This paper has been partially supported by the “Algodiv” grant (ANR-15-CE38-0001) funded by the ANR (French National Agency of Research).
References
Evrim Acar, Daniel M. Dunlavy, and Tamara G. Kolda. Link prediction on evolving data using matrix and tensor factorizations. In Proc. of ICDMW’09, IEEE International Conference on Data Mining Workshops, pages 262–269, 2009.
Eytan Adar, Li Zhang, Lada A. Adamic, and Rajan M. Lukose. Implicit structure and the dynamics of blogspace. In Workshop on the Weblogging Ecosystem, 13th International World Wide Web Conference, 2004.
Ralph Adolphs. The unsolved problems of neuroscience. Trends in cognitive sciences, 19(4):173–175, 2015.
William Aiello, Fan Chung, and Linyuan Lu. A random graph model for massive graphs. In Proc. ACM 32nd annual ACM symposium on Theory of computing, pages 171–180. ACM, 2000.
Fr´ed´eric Amblard, Audren Bouadjio-Boulic, Carlos Sureda Guti´errez, and Benoit Gaudou. Which models are used in social simulation to generate social networks? a review of 17 years of publica-tions in jasss. In Winter Simulation Conference (WSC), 2015, pages 4021–4032. IEEE, 2015. Carolyn J. Anderson, Stanley Wasserman, and Katherine Faust. Building stochastic blockmodels.
Carolyn J. Anderson, Stanley Wasserman, and Bradley Crouch. A p* primer: logit models for social networks. Social Networks, 21:37–66, 1999.
Viplove Arora and Mario Ventresca. A multi-objective optimization approach for generating complex networks. In Companion Proceedings of GECCO’16 18th Genetic and Evolutionary Computation Conference, pages 15–16, 2016.
Viplove Arora and Mario Ventresca. Action-based modeling of complex networks. Scientific Reports, 7(6673), 2017.
Andrea Avena-Koenigsberger, Joaqu´ın Go˜ni, Ricard Sol´e, and Olaf Sporns. Network morphospace. Journal of The Royal Society Interface, 12(103):20140881, 2015.
A. Bailey, M. Ventresca, and B. Ombuki-Berman. Genetic programming for the automatic inference of graph models for complex networks. IEEE Transactions on Evolutionary Computation, 18(3): 405–419, 2014.
Alexander Bailey, Mario Ventresca, and Beatrice Ombuki-Berman. Automatic generation of graph models for complex networks by genetic programming. In Proc. GECCO’12 14th ACM Annual Conference on Genetic and Evolutionary Computation, pages 711–718. ACM, 2012.
Albert-Laszlo Barab´asi and R´eka Albert. Emergence of scaling in random networks. Science, 286: 509–512, 1999.
Albert-Laszlo Barab´asi, Hawoong Jeong, Erzsebet Ravasz, Zoltan Neda, Tam´as Vicsek, and Andras Schubert. Evolution of the social network of scientific collaborations. Physica A, 311:590–614, 2002.
N. Berger, C. Borgs, J.T. Chayes, R.M. D’Souza, and R.D. Kleinberg. Competition-induced preferen-tial attachment. In Proceedings of the 31st International Colloquium on Automata, Languages and Programming, pages 208–221, 2004.
Richard F Betzel, Andrea Avena-Koenigsberger, Joaqu´ın Go˜ni, Ye He, Marcel A De Reus, Alessandra Griffa, Petra E V´ertes, Bratislav Miˇsic, Jean-Philippe Thiran, Patric Hagmann, et al. Generative models of the human connectome. Neuroimage, 124:1054–1064, 2016.
Catherine A. Bliss, Morgan R. Frank, Christopher M. Danforth, and Peter Sheridan Dodds. An evolu-tionary algorithm approach to link prediction in dynamic social networks. Journal of Computational Science, 5(5):750–764, 2014.
Per Block, Christoph Stadtfeld, and Tom A. B. Snijders. Forms of dependence: Comparing saoms and ergms from basic principles. Sociological Methods & Research, 2016.
Per Block, Johan Koskinen, James Hollway, Christian Steglich, and Christoph Stadtfeld. Change we can believe in: Comparing longitudinal network models on consistency, interpretability and predictive power. Social Networks, 52:180–191, 2018.
Ingwer Borg and Patrick JF Groenen. Modern multidimensional scaling: Theory and applications. Springer Science & Business Media, 2005.
Julia Brennecke and Olaf N. Rank. The interplay between formal project memberships and informal advice seeking in knowledge-intensive firms: A multilevel network approach. Social Networks, 44: 307–318, 2016.
Sergey Brin and Lawrence Page. The anatomy of a large-scale hypertextual web search engine. Com-puter networks and ISDN systems, 30(1-7):107–117, 1998.
Guido Caldarelli, A. Capocci, P. De Los Rios, and M. A. Munoz. Scale-free networks from varying vertex intrinsic fitness. Physical Review Letters, 89(25):258702, 2002.
Rapha¨el Charbey and Christophe Prieur. Graphlet-based characterization of many ego networks. hal-01764253v2, 2018.
Aaron Clauset, Cristopher Moore, and M. E. J. Newman. Hierarchical structure and the prediction of missing links in networks. Nature, 453:98–101, 2008.
Jean-Philippe Cointet and Camille Roth. Local networks, local topics: Structural and semantic prox-imity in blogspace. In Proc. 4th ICWSM AAAI Intl. Conf. on Weblogs and Social Media, pages 223–226. AAAI, 2010.
Vittoria Colizza, Jayanth R. Banavar, Amos Maritan, and Andrea Rinaldo. Network structures from selection principles. Physical Review Letters, 92(19):198701, 2004.
Bernat Corominas-Murtra, Joaqu´ın Go˜ni, Ricard V. Sol´e, and Carlos Rodr´ıguez-Caso. On the origins of hierarchy in complex networks. PNAS, 110(33):13316–13321, 2013.
Luciano da Fontoura Costa, F. A. Rodrigues, G. Travieso, and P. R. Villas Boas. Characterization of complex networks: A survey of measurements. Advances in Physics, 56(1):167–242, 2007. Derek J. de Solla Price. A general theory of bibliometric and other cumulative advantage processes.
Journal of the American Society for Information Science, 27(5–6):292–306, 1976.
Sergey N. Dorogovtsev and Jos´e F. F. Mendes. Evolution of networks with aging of sites. Physical Review E, 62:1842–1845, 2000.
Raissa M. D’Souza, Christian Borgs, Jennifer T. Chayes, Noam Berger, and Robert D. Kleinberg. Emergence of tempered preferential attachment from optimization. PNAS, 104:6112–6117, 2007. Ernesto Estrada. Topological structural classes of complex networks. Physical Review E, 75(1):
016103, 2007.
Alex Fabrikant, Elias Koutsoupias, and Christos H. Papadimitriou. Heuristically optimized trade-offs: A new paradigm for power laws in the internet. In ICALP ’02: Proceedings of the 29th International Colloquium on Automata, Languages and Programming, pages 110–122, London, UK, 2002. Springer-Verlag. ISBN 3-540-43864-5.
Stephen E. Fienberg, Michael M. Meyer, and Stanley S. Wasserman. Statistical analysis of multiple sociometric relations. Journal of the American Statistical Association, 80(389):51–67, 1985. Santo Fortunato, Alessandro Flammini, and Filippo Menczer. Scale-free network growth by ranking.
Physical Review Letters, 96:218701, 2006.
Ove Frank and David Strauss. Markov graphs. Journal of the American Statistical Association, 81 (395):832–842, 1986.
N. Gilbert. A simulation of the structure of academic science. Sociological Research Online, 2(2): 1–15, 1997.
Christos Gkantsidis, Milena Mihail, and Ellen W. Zegura. The markov chain simulation method for generating connected power law random graphs. In Proc. 5th Workshop on Algorithm Engineering and Experiments (ALENEX), 2003.
Michaela Goetz, Jure Leskovec, Mary McGlohon, and Christos Faloutsos. Modeling blog dynamics. In ICWSM 2009 Proc. 3rd International AAAI Conference on Weblogs and Social Media, 2009. Joaqu´ın Go˜ni, Andrea Avena-Koenigsberger, Nieves Velez de Mendizabal, Martijn P. van den Heuvel,
Richard F. Betzel, and Olaf Sporns. Exploring the morphospace of communication efficiency in complex networks. PLoS ONE, 8(3):e58070, 2013.
Roger Guimer`a and L. A. N. Amaral. Modeling the world-wide airport network. European Phys. Journal B, 38:381–385, 2004.
Roger Guimer`a and Marta Sales-Pardo. Missing and spurious interactions and the reconstruction of complex networks. PNAS, 106(52):22073–22078, 2009.
Roger Guimera, Brian Uzzi, Jarrett Spiro, and Luis A. Nunes Amaral. Team assembly mechanisms determine collaboration network structure and team performance. Science, 308:697–702, 2005. Roger Guimer`a, Marta Sales-Pardo, and Lu´ıs A. N. Amaral. Classes of complex networks defined by
role-to-role connectivity profiles. Nature Physics, 3:63–69, 2007.
Steve Hanneke, Wenjie Fu, and Eric P. Xing. Discrete temporal models of social networks. Electronic Journal of Statistics, 4:585–605, 2010.
Kyle Robert Harrison, Mario Ventresca, and Beatrice M. Ombuki-Berman. Investigating fitness mea-sures for the automatic construction of graph models. In A. Mora and G. Squillero, editors, EvoAp-plications 2015 ApEvoAp-plications of Evolutionary Computation, volume 9028 of LNCS, pages 189–200. Springer, 2015.
Kyle Robert Harrison, Mario Ventresca, and Beatrice M. Ombuki-Berman. A meta-analysis of cen-trality measures for comparing and generating complex network models. Journal of computational science, 17:205–215, 2016.
M. Al Hasan, V. Chaoji, S. Salem, and M. Zaki. Link prediction using supervised learning. In SDM: Workshop on Link Analysis, Counter-terrorism and Security, 2006.
Mohammad Al Hasan and Mohammed J. Zaki. A survey of link prediction in social networks. In Charu C. Aggarwal, editor, Social Network Data Analytics, pages 243–275. Springer US, Boston, MA, 2011.
Paul Holland and Samuel Leinhardt. A dynamic model for social networks. Journal of Mathematical Sociology, 5:5–20, 1977.
Paul W. Holland and Samuel Leinhardt. An exponential family of probability distributions for directed graphs. Journal of the American Statistical Association, 76(373):33–65, 1981.
Paul W. Holland, Kathryn Blackmond Laskey, and Samuel Leinhardt. Stochastic blockmodels: First steps. Social Networks, 5:109–137, 1983.
Petter Holme and Beom Jun Kim. Growing scale-free networks with tunable clustering. Physical Review E, 65:026107, 2002.
![Figure 1: This unconventional antenna design was generated by NASA using evolutionary computa- computa-tion to optimize its radiacomputa-tion pattern [Hornby et al., 2006]](https://thumb-eu.123doks.com/thumbv2/123doknet/14304857.494555/3.918.322.583.160.504/figure-unconventional-antenna-generated-evolutionary-computa-optimize-radiacomputa.webp)