Effect of plant aggregates on mechanical properties of earth bricks
1A. Laborel-Préneron1*, J-E. Aubert2, C. Magniont3, P. Maillard4, C. Poirier5 2
3
1 LMDC, INSA/UPS Génie Civil, 135 Avenue de Rangueil, 31077 Toulouse cedex 4
04 France. 5
2 LMDC, INSA/UPS Génie Civil, 135 Avenue de Rangueil, 31077 Toulouse cedex 6
04 France. 7
3 LMDC, INSA/UPS Génie Civil, 135 Avenue de Rangueil, 31077 Toulouse cedex 8
04 France. 9
4 Centre Technique de Matériaux Naturels de Construction (CTMNC), Service 10
Céramique R&D, Ester Technopole, 87069 Limoges Cedex, France 11
5 Centre Technique de Matériaux Naturels de Construction (CTMNC), Service 12
Céramique R&D, Ester Technopole, 87069 Limoges Cedex, France 13 14 alaborel@insa-toulouse.fr 15 aubert@insa-toulouse.fr 16 c_magnio@insa-toulouse.fr 17 p.maillard@ctmnc.fr 18 c.poirier@ctmnc.fr 19 20 21
*Corresponding author: Aurélie Laborel-Préneron 22
Tel. +33 (0)5 61 55 99 26 Fax: 0033 (0)5 61 55 99 49; 23
e-mail: alaborel@insa-toulouse.fr 24
Effect of plant aggregates on the mechanical properties of earth bricks
25 26
ABSTRACT 27
A building material is mainly characterized by its mechanical performance, which 28
provides proof of its quality. However, the measurement of the compressive or 29
flexural strength of an earth-based material with plant aggregates, which is very 30
ductile, is not fully standardised. The objective of this study is to determine the 31
compressive and flexural strengths of a composite made of earth and 0%, 3% or 32
6% of barley straw, hemp shiv or corn cob. Given the manufacturing processes 33
available, cylindrical compressed specimens were studied in compression 34
whereas extruded specimens were studied in flexion. Two protocols were tested 35
for compressive strength measurements: one with direct contact between the 36
specimen and the press, and the other with reduced friction. The test with 37
reduced friction engendered a huge decrease of the stress and a slight decrease 38
of the strain. For both compressive and flexural strengths, the specimens made 39
of earth alone were the most resistant, followed by composites containing straw. 40
The influence of two different treatments applied to the straw is also discussed. 41
42
Keywords: mechanical properties, earth blocks, straw, hemp shiv, corn cob, 43 extrusion 44 45 INTRODUCTION 46
The building sector is currently innovating in order to use more environmentally 47
friendly materials and to ensure the comfort of users. To this end, it is developing 48
new ecological materials (such as lightweight concrete (Chabannes et al., 2014; 49
Magniont, 2010), or concrete using wastes (Palankar et al., 2015)) but it is also 50
looking into older, traditional ways, focusing on materials such as earth, stone or 51
wood. 52
Nowadays, around 30% of the world's population still lives in earth shelters, 53
especially in developing countries (Minke, 2006). Earth is a local resource that is 54
available in abundance and presents many other advantages. This material has 55
low environmental impact because of its recyclability, the little energy needed for 56
the transformation process, the minimal transport required and its energy 57
efficiency. Moreover, it is able to regulate indoor moisture and to improve the 58
comfort of the building’s users (Islam and Iwashita, 2006; Minke, 2006). 59
However, earth material presents some weaknesses, such as low mechanical 60
strength, brittleness, hygroscopic shrinkage and limited durability with respect to 61
water (Aymerich et al., 2012; Islam and Iwashita, 2006). In order to reduce these 62
drawbacks, some authors have studied the effect of adding stabilizers such as 63
hydraulic binders and artificial or natural fibres or aggregates (Danso et al., 64
2015a; Laborel-Préneron et al., 2016). The enhancement of soil blocks by 65
stabilizers was reviewed by Danso et al. (Danso et al., 2015a), especially 66
concerning mechanical and water absorption properties. The interest of adding 67
plant aggregates was also highlighted by Laborel-Préneron et al. (Laborel-68
Préneron et al., 2016). Based on empirical knowledge, the use of natural fibres 69
and excrement has always helped to improve the properties of earth for building 70
(Chazelles et al., 2011; Millogo et al., 2016). Such additions are now being 71
increasingly studied within an earth matrix because of their apparently huge 72
potential to improve thermal insulation (Bal et al., 2013) and ductility (Mostafa 73
and Uddin, 2015) among other properties. 74
The present paper deals only with the mechanical properties of earth blocks 75
containing plant aggregates. These properties are indeed essential if the material 76
under study is to be used for construction purposes. They will determine whether 77
it can be used in a load bearing structure or not. However, the mechanical 78
requirements vary from one standard to another, as do the testing procedures, 79
which makes the characterization of this kind of material difficult. In the literature, 80
many studies focus on the influence of plant fibres or aggregates on compressive 81
strength. Twenty-three references investigating compressive strength on this kind 82
of materials are cited in (Laborel-Préneron et al., 2016). Several studies have 83
observed an increase of compressive strength with increasing proportions of 84
plant aggregates such as tea residue (Demir, 2006), sawdust, tobacco residue or 85
grass (Demir, 2008) or cassava peel (Villamizar et al., 2012). However, others 86
have found a decrease in strength: Algin et al. showed a 71% compressive 87
strength decrease with the addition of 7% of cotton waste (Algin and Turgut, 88
2008), and a decrease was also observed with straw (Mohamed, 2013) or 89
coconut fibres (Khedari et al., 2005). In some cases, the effect of fibre length was 90
studied. According to Millogo et al. (Millogo et al., 2014, 2015), the compressive 91
strength of the earth composite increased by as much as 16% with the addition of 92
short Hibiscus Cannabinus fibres (3 cm) but decreased with long ones (6 cm), 93
except for a content of 0.4%. An influence of the aspect ratio was also observed 94
by Danso et al. (Danso et al., 2015b) for coconut, bagasse and oil palm fibre, but 95
with an increase of compressive strength as the length of the added fibres 96
increased. None of these studies on earth material with plant aggregates deal 97
with the influence of the testing protocol. However, Morel et al. (Morel et al., 98
2007) reviewed the various existing protocols for compressive strength testing of 99
blocks of earth alone. Aubert et al. (Aubert et al., 2013, 2015) have discussed the 100
testing of extruded earth blocks, considering the influence of: aspect ratio, 101
confinement (capping with Teflon or not), anisotropy and the mortar joint between 102
two half blocks, on the compressive strength measurement. 103
Several references focus on the flexural strength of these materials. An increase 104
in flexural strength is observed in most of the studies with an addition of plant 105
aggregates, e.g. Bouhicha et al. (Bouhicha et al., 2005) with barley straw or 106
Aymerich et al. (Aymerich et al., 2012) with wool fibres, but others have observed 107
a decrease, e.g. Villamizar et al. with cassava peels (Villamizar et al., 2012). In all 108
cases, ductility is greatly improved, as the fibre bridging of microcracks prevents 109
them from expanding (Galán-Marín et al., 2010; Mattone, 2005; Mostafa and 110
Uddin, 2015; Segetin et al., 2007). 111
A few, relatively recent, works have investigated the energy absorbed and the 112
mode of failure (Aymerich et al., 2016; Islam and Iwashita, 2006; Lenci et al., 113
2012; Martins et al., 2014). In flexion, failure usually occurs by fibre gradually 114
slipping from the matrix, leading to both pull out and breaking of the fibres 115
(Mostafa and Uddin, 2015). Some authors have treated the fibres in an attempt to 116
improve the adhesion between the fibre and the matrix and thus enhance the 117
flexural or tensile strength. Some encouraging results have been obtained, 118
notably with acetylation, depending on the temperature of the chemical reaction 119
(Hill et al., 1998), or alkaline treatments on sisal fibres (Alvarez and Vázquez, 120
2006) or banana fibres (Mostafa and Uddin, 2015). However, a linseed oil 121
treatment used by Ledhem et al. on wood shavings gave less promising results, 122
with a decrease in strength, especially in traction. 123
The material studied in this paper is a bio-composite composed of earth and 124
three different plant aggregates: barley straw, hemp shiv and corn cob. 125
Composite specimens were manufactured according two processes: 126
compression or extrusion. After characterization of the earth used, the influence 127
of plant aggregate content on compressive strength and flexural strength was 128
analysed. Compressed specimens were tested in compression following two 129
protocols, one with friction and the other using a system to reduce friction. The 130
extruded specimens were tested in flexion. The effects of various treatments on 131
barley straw and the effect of its aspect ratio were investigated with this test. The 132
fracture energy developed during the test was also calculated. 133
134
MATERIALS AND METHODS 135
Raw materials
136
Earth 137
Earth used in this study was composed of quarry fines from aggregate washing 138
processes (FWAS). These fines, smaller than 0.1 mm, were generated by the 139
washing of limestone aggregates produced for the chemical or concrete industry. 140
The sludge created was left to dry in sedimentation basins and was then reduced 141
to powder to be used in different applications. 142
143
Plant aggregates 144
Three types of plant aggregates were used in this study: barley straw (two 145
different lengths), hemp shiv and corn cob. Barley Straw (S) is the part of cereal’s 146
stem rejected during the harvest. Hemp shiv (H) is the by-product of the hemp 147
defibration process and corresponds to the lignin-rich part of the stem. Corn Cob 148
(CC) is the central part of the ear of corn cleared of grain and crushed. The 149
hardest part was studied here. The physical and chemical characteristics of these 150
plant aggregates were determined in (Laborel-Préneron et al., 2017) and are 151
recapitulated in Table 1. However, the previous characterization was done only 152
for the shortest straw (Sshort), of average length 8 mm. In the present study, the 153
longest straw (Slong), of average length 15 mm, was used only for the flexural 154
strength test. 155
Insert Table 1 here
156
Surfactant additives 157
In agriculture, the efficiency of crop protection products can be improved by the 158
addition of surfactants that increase the absorption of the product on the plants. 159
These additives can optimize spreading and reduce negative effects such as drift 160
and run off. In this study, the objective of using these surfactants was to increase 161
the adhesion between the plant aggregates and the earth matrix by reducing the 162
surface tension of the mixing water. Two types of surfactant additives were 163
tested: A1, which was soya lecithin based, and A2, which was latex based. They 164
were both applied to the long straw only. 165
To apply the surfactants to the straw, the particles were immersed for 1 hour in 166
the additive, diluted at the rate recommended by the supplier: 0.5% of the water 167
volume for A1 and 0.1% for A2. The straw was then sieved to remove extra water 168
before being dried at 30°C in an oven. 169
170
Physical, chemical and mineralogical characterization of FWAS
171
Particle size distribution and Atterberg limits 172
The size distribution was determined by sedimentation after wet sieving at 80 µm, 173
according to standard NF P94-057 (AFNOR, 1992). The geotechnical 174
characteristics were evaluated using the Atterberg limits, according to standard 175
NF P 94-051 (AFNOR, 1993). 176
177
Chemical and mineralogical composition 178
X-ray diffraction on a sample crushed to a size of less than 80 µm was carried 179
out with a Siemens D5000 powder X-ray diffractometer equipped with a 180
monochromator having a Ka (λ=1.789Å) cobalt anticathode. Thermal 181
mineralogical characterization was also performed by thermal gravimetric 182
analysis (TGA) of a crushed sample (< 80 µm) heated to 1050°C at a constant 183
rate of 10°C.min-1. Major oxide composition was evaluated on the basis of 184
macroelemental analysis performed by Inductively Coupled Plasma-Atomic 185
Emission Spectrometry (ICP-AES) on crushed samples smaller than 80 µm. The 186
mineral composition was determined from X-ray diffraction results and the 187 chemical composition. 188 189 Manufacturing process 190
Specimens for the different tests were prepared by two manufacturing processes: 191
one using static compression and the other using extrusion. The proportion of 192
plant aggregates was expressed by dry weight content, according to formula (1): 193
(1)
where Ag. content is the plant aggregate content in %, mAg is the dry mass of 194
plant aggregates and mFWAS is the dry mass of earth. 195
196
Compressed specimens 197
Various mixtures were prepared to make the specimens: FWAS only and 198
mixtures containing one of the plant aggregates in a proportion of 3% or 6%. The 199
water contents of the mixtures were determined by the Proctor test, and then 200
rounded up because, according to Minke (Minke, 2006), this is a minimum value 201
for manufacturing compressed earth bricks. 202
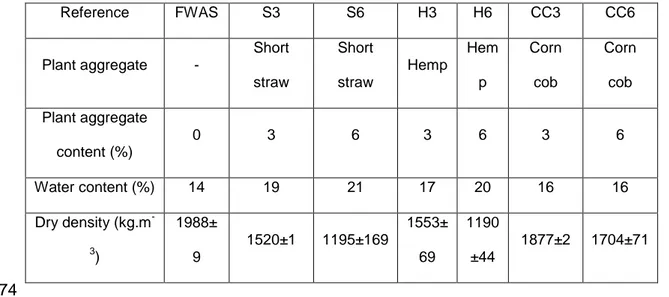
Table 2 recapitulates the different mixture proportions and the dry densities of the 203
specimens obtained (average of six specimens). As expected, the water content 204
of the dry mass needed to make the mixtures increased when the plant 205
aggregate content increased. It was higher for straw than for hemp and corn cob 206
because straw particles have a higher water absorption coefficient than the other 207
two aggregates (414% vs. 380% for hemp and 123% for corn cob) (Laborel-208
Préneron et al., 2017). 209
Insert table 2 here
210 211
To manufacture the specimens, the earth and plant aggregate fractions were 212
poured into a blender and mixed by hand. Then, water was added and the 213
materials were mixed mechanically until a homogeneous mix was obtained. The 214
raw materials were mixed the day before moulding. 215
Cylindrical specimens 5 cm in diameter and 5 cm high (Φ5H5), intended for 216
compressive strength tests, were manufactured by double static compression at 217
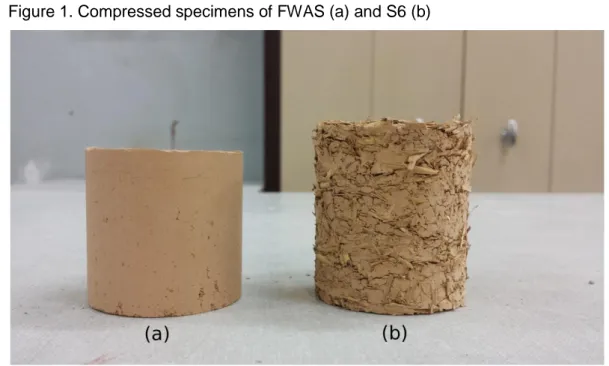
the Proctor density. After demoulding, the height of the specimens containing 218
barley straw and hemp shiv increased significantly due to the high compressibility 219
of the plant aggregates. This increase reached 10% of the height for an addition 220
of 6% of hemp shiv, for example. This expansion led to the formation of 221
distributed cracks, specifically in the case of an addition of 6% of straw (Figure 1). 222
The specimens were first dried at 40°C for 24 hours, then the temperature was 223
increased by 0.1°C/min to 100°C and kept at 100°C until the weight became 224
constant (weight variation less than 0.1% between two weighings 24 hours 225
apart). This rise in temperature was carried out slowly to keep shrinking 226
homogeneous and to avoid mechanical stresses. The specimens were then 227
stored in a room regulated at 20°C and 50% relative humidity (RH) and were 228
tested when they were in equilibrium with the environment (about one week 229
later). 230
Figure 1. Compressed specimens of FWAS (a) and S6 (b)
231
Extruded specimens 232
Six types of specimens were prepared: specimens made with FWAS only (i), and 233
specimens made with 3% of short straw (ii), long straw (iii), hemp shiv (iv), long 234
straw treated with the A1 surfactant (v), or long straw treated with the A2 235
surfactant (vi). Corn cob was not tested in extrusion because of the poor 236
distribution of the particles observed in a preliminary trial and its low strength in 237
compression. To manufacture these specimens, earth and plant aggregate 238
fractions were poured into a blender and were mixed by hand. Then, the 239
materials were mixed mechanically in the blender and water was added 240
progressively until the consistency of the mixture was sufficiently homogeneous 241
and plastic to be extruded. The details of the mixes are recapitulated in 242
Table 3. 244
Insert table 3 here
245 246
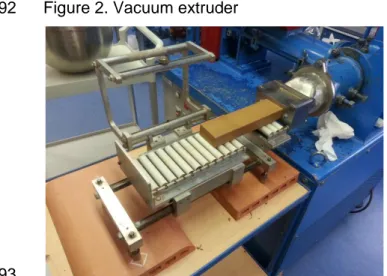
The specimens were manufactured with a medium sized laboratory extruder. The 247
mixture was extruded under vacuum through a 7 cm x 3.5 cm die (Figure 2). The 248
specimens were difficult to cut in the fresh state because of the presence of plant 249
particles. They were therefore air-dried until the weight become constant (weight 250
variation of less than 0.1% between two weighings 24 hours apart) and then cut 251
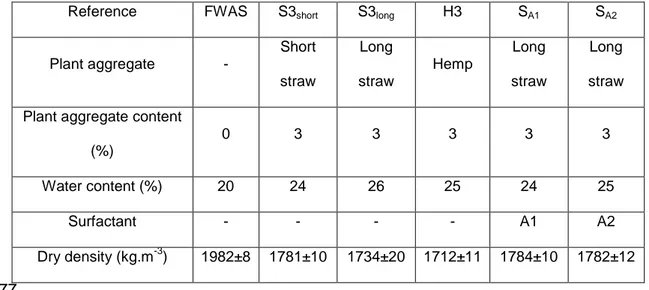
to a length of 18 cm with a circular saw. Treatment of the straw did not modify the 252
dry density of the composites. However, when the two manufacturing processes 253
were compared ( 254
Table 2 and 255
Table 3), an increase of density was observed for the extruded specimens 257
containing plant aggregates. It was due to the extrusion of the material under 258
vacuum, which reduced porosity, and to the extrusion pressure due to the worm 259
screw. 260
Figure 2. Vacuum extruder
261
Compressive strength test
262
The compressive strength tests on the Φ5H5 specimens were performed using a 263
100 kN capacity hydraulic press. The load was applied at a constant deflection 264
rate of 3 mm.min-1. This speed was chosen as an intermediate value between the 265
1.2 mm.min-1 specified in the French standard XP P 13-901 (AFNOR, 2001) 266
(intended for compressed earth blocks) and the 5 mm.min-1 used by Cerezo 267
(Cerezo, 2005) (intended for hemp concrete). Three specimens of each mixture 268
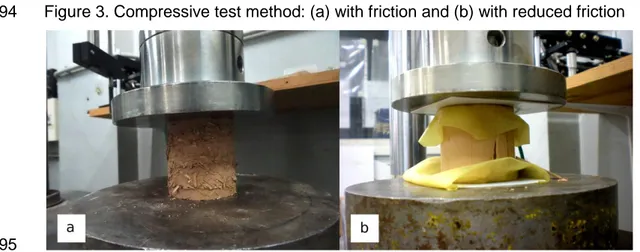
were tested in two different tests: one test with the specimen in direct contact with 269
the steel plates (generating friction) and the other including a system avoiding 270
friction (Figure 3) as described by Olivier et al. (Olivier et al., 1997). In the latter 271
case, a 2-mm-thick piece of Teflon and a thin neoprene sheet - with a drop of oil 272
between the layers - were placed between the earth specimen and the steel 273
(neoprene in contact with the specimen, and Teflon in contact with the steel). 274
Teflon was used because of its low friction coefficient and neoprene because of 275
its high mechanical resistance. Displacements and loads were measured in each 276
case. The Young’s modulus of each specimen was then calculated from the 277
linear part of the stress-strain curve. 278
Figure 3. Compressive test method: (a) with friction and (b) with reduced
279
friction
280
Flexural strength test
281
The flexural strength tests on the extruded specimens were performed using a 282
100 kN capacity hydraulic press with a 10 kN sensor. The load was applied at a 283
constant deflection rate of 1 mm.min-1 as was done by Aymerich et al. (Aymerich 284
et al., 2012). The samples were loaded under three point loading conditions with 285
the lower supports placed 10 cm apart, corresponding to the value given in the 286
French standard NF EN 196-1 intended for cements (AFNOR, 2006). 287
Measurements were made in triplicate. 288
This test was carried out in order to study the effect of the plant aggregate 289
addition on ductility. According to the literature, this kind of addition has a marked 290
effect on ductility (Aymerich et al., 2012; Bouhicha et al., 2005; Galán-Marín et 291
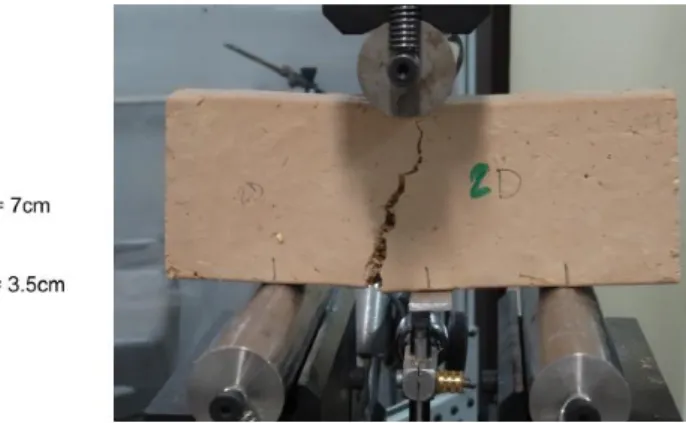
al., 2010; Ghavami et al., 1999). Deflection was measured from bottom to top on 292
an aluminium platelet glued in the middle of the sample, as can be seen on 293
Figure 4. The test was stopped for a deflection close to 3 mm, the limit of the 294
sensor stroke. 295
Figure 4. Flexural test set up
296 297
In order to compare the flexural strength with values reported in the literature or 298
values from standards, the bending stress was calculated only at failure with the 299
beam theory. Considering that classical hypotheses of solid mechanics applied 300
and that the section was not cracked until peak load (elastic part of the curve) 301
(Lenci et al., 2012; Mostafa and Uddin, 2015), the stress σ (MPa) was calculated 302
from the following expression (2): 303
(2)
with F the maximum load at failure (N), L the distance between the supports 304
(mm), b the width (mm) and h the height (mm) of the sample. 305
306
To determine the effect of the plant aggregate on the behaviour at failure and 307
post-peak, the fracture energy (Gf) was calculated. It provided information about 308
the amount of energy absorbed when the specimen was broken into two parts. It 309
was represented by the area under the load-displacement curve divided by the 310
projected fracture area (Guinea et al., 1992). Usually, it is measured on notched 311
samples (Aymerich et al., 2012, 2016; Guinea et al., 1992), so the whole load-312
displacement curve is considered. However, as the samples did not have a 313
notch, the area was taken into account from the failure point and to a deflection 314
of 3 mm. The fracture energy was calculated from the expression (3): 315
(3)
where δf is the deflection at failure (m), F is the load (N) and S is the initial 316
section (m²). 317
The Young’s modulus of each specimen was then calculated from the linear part 318
of the stress-strain curve. 319
320
RESULTS AND DISCUSSION 321
Characterization of earth
322
Particle size distribution and Atterberg limits 323
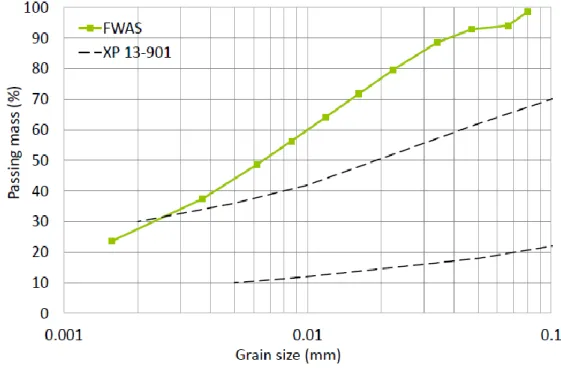
The particle size distribution is presented in Figure 5 and compared with the size 324
distribution recommended for compressed earth blocks (CEB) in the XP 13-901 325
standard (AFNOR, 2001). 326
Figure 5. Comparative grain size distribution curve for earth: FWAS and
327
standard
328
The earth was extremely fine: 99% of the particles were smaller than 80 μm and 329
the average particle size (D50) determined using the pipette analysis was 6.5 330
μm. The curve did not fit the limits recommended by the standard, the passing 331
mass being higher for each grain size. Atterberg limits were equal to 30% for the 332
liquid limit, 21% for the plastic limit and 9% for the plasticity index. The plasticity 333
of this material was not located in the spindle of the diagram recommended by 334
the XP 13-901 standard (AFNOR, 2001). However, even though the size 335
distribution and Atterberg limits did not meet the recommended criteria, it was 336
already shown that it was possible to manufacture CEBs with a huge variety of 337
earths (Aubert et al., 2014; Laborel-Préneron et al., 2016). 338
339
Chemical and mineralogical composition 340
The X-ray diffractogram is presented on Figure 6. This diagram reveals the large 341
presence of calcite (CaCO3) and shows the presence of other minerals in smaller 342
quantities: kaolinite (Al2Si2O5(OH)4), quartz (SiO2), illite (KAl2(AlSi3)O10(OH)2), 343
goethite (FeO(OH)) and dolomite (CaMg(CO3)2). 344
Figure 6. X-ray diffraction pattern of the earth. (c) calcite, (d) dolomite, (g)
345
goethite, (i) illite, (k) kaolinite, (q) quartz
346
To complete its mineralogical characterization, the earth was subjected to 347
thermal gravimetric analysis, the results of which are presented in Figure 7. The 348
loss of mass around 105°C was due to the evaporation of water and that around 349
540°C indicated the removal of the constituting water, which led to the 350
transformation of kaolinite into metakaolinite (Kornmann and Lafaurie, 2005). The 351
greatest loss of weight, of about 25%, occurred around 910°C and was due to the 352
decarbonation of calcite and dolomite. 353
Figure 7. TG and DTG (Derivative Thermo-Gravimetric) curves of the earth
354
The chemical composition of the earth is given in 355
Table 4, where a large amount of calcium is noticeable. Using the chemical 356
composition and the mineral characterization, it is possible to estimate the 357
proportion of each mineral. The fines used were thus composed for 60% of 358
calcite, 11% of kaolinite, 11% of illite, 10% of quartz, 6% of dolomite and 3% of 359
goethite. 360
Insert table 4 here
361 362
Compressive strength measured on compressed specimens
363
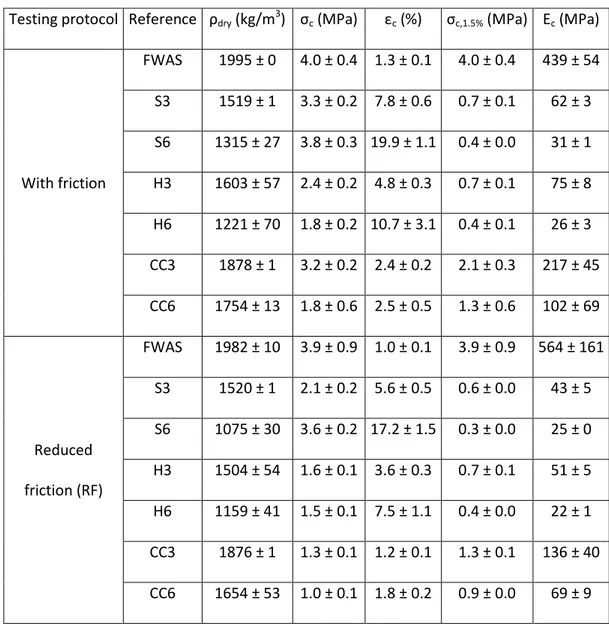
The average over three specimens of dry density, maximum compressive 364
strength and other mechanical properties of each mixture and for each testing 365
protocol are reported in 366
Table 5. The compressive strength value required by the New-Zealand Earth 367
Building standard NZS 4298 (NZS 4298) is 1.3 MPa. This value was reached for 368
all the mixtures of this study, for both protocols, except for CC6 tested with 369
reduced friction (0.9 MPa). 370
Insert table 5 here
371
Influence of plant aggregate type and content on the bulk density 372
A number of authors have shown that bulk density is influenced by the addition of 373
plant aggregates (Algin and Turgut, 2008; Demir, 2008; Khedari et al., 2005). The 374
bulk density of each mixture used here is plotted on Figure 8. As expected, bulk 375
density decreased as the aggregate content increased for the three kinds of plant 376
aggregates. However, some differences between the mixtures with straw or 377
hemp and the mixture with corn cob can be noted. Bulk density was higher for the 378
mixtures with corn cob than for those with straw or hemp. This difference may 379
have been due to the huge variability of the particle bulk densities: 497 kg.m-3 for 380
corn cob against 57 kg.m-3 and 153 kg.m-3 for straw and hemp shiv, respectively 381
(Laborel-Préneron et al., 2017). 382
Figure 8. Bulk density as a function of the plant aggregate content
383
Influence of the testing protocol on compressive strength 384
Usually, only the compressive test with friction is performed ((Galán-Marín et al., 385
2010; Mohamed, 2013; Villamizar et al., 2012)) and follows standards ASTM 386
D2166 (ASTM D 2166, 2004), XP P 13-901 (AFNOR, 2001) or TS EN 772-1 (TS 387
EN 772-1, 2002). However some authors have also measured the strength with 388
lower friction (using a layer of sand and a transparent film on either side of the 389
sample (Piattoni et al., 2011; Quagliarini and Lenci, 2010) or with Teflon (Aubert 390
et al., 2015)) to obtain the "real" compressive strength. Both methods, with 391
friction and with Teflon reducing friction, were carried out to see what difference 392
was actually observed. The results are shown in Figure 9. 393
Figure 9. Compressive strength of the mixtures according to the testing
394
protocol
395
For each composition, the compressive strength measured in the tests with 396
friction was greater than that found in tests with reduced friction because of the 397
confinement (transverse displacements not allowed at the ends of the 398
specimens). In the case of earth alone (FWAS) and S6 specimens, the decrease 399
in strength between the protocols was only about 3 to 5%, whereas it reached 400
between 28% (C6) and 59% (CC3) for the other mixtures. In some cases (FWAS 401
or CC6), standard deviation was quite high. In the case of CC6, for example, this 402
large variability of the results was due to one specimen having significantly higher 403
strength than the other two - probably because of the heterogeneity of the 404
material (Aubert et al., 2015), with a poor distribution of the corn cob granules. 405
The results of H3, H6, CC3 and CC6 measured with reduced friction are very 406
close; it is thus difficult to establish the highest strength with this protocol. 407
Unlike Aubert et al.’s finding (Aubert et al., 2015) that the strength decreased by 408
only 10% with the use of Teflon capping, the choice of the method was observed 409
to significantly affect the strength value measured here. It is thus important to 410
choose the most adequate method. In order to allow comparisons among 411
samples, and with the literature, only the values obtained with friction were kept 412
here. This protocol was also easier to set up and more similar to the behaviour of 413
a brick within a wall, with friction between the bricks. 414
415
Effect of the plant aggregates on compressive strength 416
The compressive strengths of the specimens are summarized in Figure 10 for the 417
different plant aggregate types and contents when the protocol with friction at the 418
interface between the specimen and the press was employed. 419
The compressive strength of the specimen composed of earth alone is higher 420
than that of all the others, which is in accordance with the density values of the 421
various specimens. Its average strength of 4.0 MPa is higher than the typical 422
value for CEBs which is, according to Morel et al. (Morel et al., 2007), between 2 423
and 3 MPa. Furthermore, a decrease in compressive strength is noticeable when 424
hemp shiv and corn cob contents increase. The values are 2.4 and 1.8 MPa for 425
H3 and H6, and 3.2 and 1.8 MPa for CC3 and CC6 specimens. This reduction, 426
linked to the incorporation of particles with low compressive strength and 427
stiffness, can be correlated to the decrease in bulk density observed with the 428
addition of plant aggregate (Al Rim et al., 1999; Ghavami et al., 1999). In the 429
case of barley straw, the average strengths are 3.3 MPa and 3.8 MPa for S3 and 430
S6 respectively. The ultimate compressive strength of S6 specimens is thus 431
higher than that of S3 specimens. This can be explained by a consolidation 432
phenomenon due to the high compressibility of the straw that allows its porosity 433
to decrease as strain increases. This phenomenon is not observed for H6 or CC6 434
specimens because of the lower ductility of hemp and corn aggregates. This 435
difference could also be due to the different shapes of the particles, straw being 436
more elongated than hemp shiv (Laborel-Préneron et al., 2017). This kind of 437
result was also observed by Millogo et al. (Millogo et al., 2014) for the longest 438
fibres but for smaller quantities (less than 1%). This observation was explained 439
by the limitation of crack opening by the fibres. 440
Figure 10. Results for compressive strength test with friction
441
Effect of the plant aggregates on ductility 442
Figure 11 shows the stress-strain curves of all the specimens. It can be noted 443
that FWAS specimens show brittle failure whereas the ultimate strain is high for 444
the specimens containing plant aggregates, especially those with 6%. Their peak 445
strain is, on average, 19.9, 10.7 and 2.5% for S6, H6 and CC6, respectively, 446
whereas it is only 1.3% for FWAS. Although these specimens are weaker than 447
FWAS specimens, they are also more ductile, with a larger zone of plasticity. 448
Ductility of the composite is thus increased by the addition of plant aggregates. 449
However, in calculating building structures, such deformations of the material 450
cannot be tolerated. 451
In order to make comparisons among the materials and to maintain a strain level 452
compatible with the intended use, we chose to limit the strain to 1.5% and to keep 453
the corresponding compressive strength value, as described by Cerezo (Cerezo, 454
2005) for hemp concrete.The maximum compressive strength was kept in cases 455
when the failure occurred before 1.5% strain (which only concerned FWAS 456
specimens). 457
These values are compared with the values at failure in Figure 12. For a given 458
deformation, compressive strength is higher for FWAS specimens. The values 459
are far below the maximum compressive strength and do not reach 1 MPa for the 460
specimens with straw or hemp shiv whereas the compressive strength is above 461
the limit of 1.3 MPa in the case of corn cob. In the cases where the materials do 462
not have the strength required to be used as bearing structures, they can be 463
used as infill material in a wood structure or as a partition wall, for instance. 464
Figure 11. Strain-stress diagram for all the specimens
465
Figure 12. Maximum compressive strength (σc) and compressive strength 466
at 1.5% strain (σc,1.5%) 467
Influence of the testing protocol on Young’s modulus 468
Young’s moduli were obtained from compressive strength tests and are 469
recapitulated in Figure 13, according to the testing protocol. Friction does not 470
seem to have any great influence on the modulus, which is of the same order of 471
magnitude for both situations (with quite large standard deviations). The most 472
striking result visible in the figure is that the Young’s modulus of FWAS 473
specimens is the highest (around 500 MPa). 474
Figure 13. Young’s moduli of the materials for both protocols
475
Effect of the plant aggregates on Young’s modulus 476
The Young’s modulus obtained from the tests with friction is represented 477
according to the plant aggregate content in Figure 14. The Young’s moduli of the 478
specimens containing 3% of barley straw, hemp shiv and corn cob are 479
respectively 62, 75 and 217 MPa. For an addition of 6%, the moduli are 31, 26 480
and 102 MPa respectively for barley straw, hemp shiv and corn cob. Specimens 481
made with straw and with hemp shiv showed very similar stiffness for a given 482
content. With a modulus of 439 MPa, FWAS specimens had the highest stiffness. 483
For an increase of each plant aggregate content, there was a decrease in the 484
Young’s modulus. This result can be explained by the high compressibility of the 485
plant particles (Cerezo, 2005) and is in agreement with various references (Al 486
Rim et al., 1999; Chee-Ming, 2011; Piattoni et al., 2011; Quagliarini and Lenci, 487
2010) stating that the straw addition controls the plastic behaviour of the 488
specimen through a lower homogeneity of the mixture. This decrease of Young’s 489
modulus could be linked with the density of the specimens as shown in Figure 15. 490
An empiric exponential correlation between Young’s modulus and dry density is 491
found: with ρdry in kg.m-3. Such a relation has 492
already been proposed by Al Rim et al. for earth specimens with wood 493
aggregates (Al Rim et al., 1999), but it was with d the density of 494
the dry material relative to the density of water. 495
Figure 14. Young’s modulus from compressive test as a function of the
496
plant aggregate content
497
Figure 15. Young’s modulus as a function of the density
Flexural strength measured on extruded specimens
499
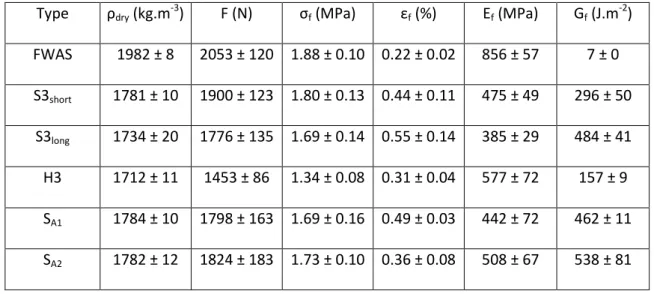
The average of dry density, the maximum flexural strength and other mechanical 500
parameters are reported in 501
Table 6. The minimum flexural tensile stress required by the Masonry Standards 503
Joint Committee (MSJC) (Masonry Standards Joint Committee (MSJC), 2008) 504
(quoted in (Villamizar et al., 2012)) for clay and concrete blocks is 0.21 MPa. 505
Another value, of 0.65 MPa, is required by the British Standard BS 6073 (BS 506
6073, 1981) (quoted in (Algin and Turgut, 2008)) for building materials to be used 507
in structural applications. All the flexural strengths of the specimens tested in this 508
study are above these two minimum requirements, the lowest strength being 1.34 509
MPa, found for H3 specimens. 510
Insert table 6 here
511
Effect of the plant aggregate type on the flexural strength 512
The maximum flexural strengths of the different mixtures are represented in 513
Figure 16 (a). FWAS has the highest flexural strength, followed by S3short, S3long 514
and H3, with values of 2053, 1900, 1776 and 1453 N respectively. This result 515
could be correlated with the respective densities: the lower the density, the lower 516
the flexural strength. 517
It can be seen that the flexural strength is higher for the specimens with short 518
straw than for those with long straw. This result is contrary to the findings of some 519
other authors (Danso et al., 2015b; Mostafa and Uddin, 2015), who stated that an 520
increase of the fibre length increased the embedded length and thus the 521
adhesion area, leading to an improvement in flexural strength. This result could 522
be explained by the fact that, for the same straw content, there are more particles 523
in a mix with short straw than with long straw, engendering a better distribution of 524
the particles in the matrix. Another explanation could be the existence of a length 525
limit, depending on the specimen size, above which the difficulty of dispersion 526
offsets the positive effect of the reinforcement. Moreover, after being extruded 527
under vacuum, the specimens with short straw presented a better visual surface 528
quality than the specimens with long straw. This could lead to a better adhesion 529
between the earth and the straw, explaining the higher resistance. 530
Although most cases in the literature show an increase in flexural strength with 531
an addition of plant aggregate ((Al Rim et al., 1999; Aymerich et al., 2012; 532
Bouhicha et al., 2005; Galán-Marín et al., 2010)), an adverse effect (decrease of 533
flexural strength) was found by Villamizar et al. (Villamizar et al., 2012) with an 534
addition of cassava peels and by Algin and Turgut (Algin and Turgut, 2008) with 535
an addition of cotton wastes. This could be due to the heterogeneity of the 536
material or the weakness of the adhesion between the particles and the matrix 537
(Yetgin et al., 2008). 538
Figure 16. Influence of the plant aggregate on flexural behaviour: (a)
539
Flexural load-carrying capacity, (b) Peak strain (εf), (c) Average fracture 540
energy (Gf) and (d) Young’s modulus
541
Effect of the plant aggregate type on ductility and Young’s modulus 542
At the end of the tests, reinforced specimens were not totally split into two parts 543
(Figure 4) and extra manual force was necessary to separate them, whereas 544
FWAS specimens were divided into two parts. Figure 17 presents typical load-545
deflection curves obtained during the bending test for the different samples. 546
These curves clearly show that the addition of plant aggregates increases the 547
ductility, increasing the deflection at failure and giving some residual strength. 548
Peak strain is represented in Figure 16 (b). As mentioned above, the strain is 549
increased with the addition of plant aggregates, especially for long particles. The 550
strain was 0.44 and 0.55% respectively for short and long straw. The lower value 551
in the case of hemp shiv (0.31%) could be attributed to a morphological effect: 552
the particle is indeed less elongated and so does not have as much surface area 553
in contact with the earth matrix as the straw particle. 554
Figure 16 (c) represents the average fracture energy for each composition. The 555
value is close to 0 J.m-² for the FWAS specimens whereas the fracture energy of 556
the other specimens is higher: 296, 484 and 157 J.m-2 respectively for S3short, 557
S3long and H3. The addition of plant aggregates allows a huge increase in fracture 558
energy. The energy absorbed increases when the length of the fibre increases; it 559
is 39% higher with long than short straw, meaning that its residual strength is 560
greater. This result shows that the fracture response of materials reinforced with 561
plant aggregates or fibres is governed by mechanisms of toughening such as 562
fibre bridging and fibre pull-out (Aymerich et al., 2016). These effects occur only 563
for sufficient crack opening. 564
Figure 17. Typical load-deflection curves
565
The experimental values of Young’s moduli are presented in Figure 16 (d). As for 566
the elastic moduli from the compressive test, they seem to decrease with the 567
addition of plant aggregates. 568
This result is partially correlated with the literature. Although the flexural Young’s 569
modulus of an earth material with wood aggregates increased with between 10 570
and 20% of addition, it decreased above 20% (Al Rim et al., 1999). 571
Effect of the surfactant on the flexural strength, post-peak behaviour and Young’s 572
modulus 573
The behaviour under flexion of the mixtures with untreated and treated long straw 574
is represented on Figure 18. The increase in flexural load capacity between SA2 575
and S3long is only about 3% and the standard deviations are high. The surfactant 576
has no effect on the flexural strength. 577
Peak strain is represented in Figure 18 (b). The strain decreases with the addition 578
of a surfactant, especially the A2 additive. Strain is 0.55, 0.49 and 0.36% for 579
S3long, SA1 and SA2 respectively. 580
Figure 18 (c) represents also the average fracture energy for the untreated and 581
treated compositions. S3long and SA1 present similar values, of 482 and 462 J.m-2, 582
respectively but a small increase of 10% can be noticed for SA2, with a fracture 583
energy of 538 J.m-2. 584
Experimental values of Young’s moduli are presented in the Figure 18 (d). The 585
elastic modulus is higher for the treated specimens, with values of 442 and 508 586
MPa for SA1 and SA2, respectively, whereas it is only 385 MPa for S3long. The A2 587
additive again seems to be the more efficient of the two surfactants tested here, 588
giving an increase in stiffness of about 24%. 589
Even though the flexural strength is not increased by the straw treatment, the 590
stiffness of the material seems to be increased and the adhesion between the 591
straw and the matrix should also be improved. Surfactant A2 seems to have a 592
greater effect than A1. However, this is a preliminary study, which needs to be 593
pursued further, in particular to optimize various parameters such as the dilution 594
ratio, application method and drying temperature. 595
Figure 18. Influence of the surfactants on flexural behaviour: (a) Flexural
596
load-carrying capacity, (b) Peak strain (εf), (c) Average fracture energy (Gf) 597
and (d) Young’s modulus
598 599
CONCLUSION 600
The mechanical properties of compressed and extruded earth-based specimens 601
were tested. These two ways of manufacturing led to different densities for the 602
same formulation. However, compressive and flexural measurements were 603
independent. Several main conclusions can be drawn concerning the influence of 604
the various parameters such as the plant aggregate type, the protocol of the test 605
or possible treatment. Concerning the compressive tests, the measurement with 606
reduced friction gave a lower compressive strength and peak strain. This method 607
gives a more "realistic" resistance, but is still little used in the literature. At 608
rupture, strength was higher in the case of straw addition, followed by hemp shiv 609
and corn cob additions. For both compressive and flexural tests, the addition of 610
plant aggregates decreased the strength but improved the ductility of the 611
material, decreasing the Young’s modulus. Concerning flexural strength, a better 612
resistance was observed for short than for long straw, but a higher strain was 613
noted for the longest straw. Strain at peak was lower when the straw was treated 614
with the A2 additive, but with the flexural strength was the same. 615
Various works have shown the diversity of mechanical tests existing for earth 616
bricks and these should be harmonized by means of more investigation and 617
standardization. However, the testing of bio-based earth materials should not be 618
forgotten as their behaviour is much more ductile and cannot be tested in the 619
same way. Although the treatment with surfactants did not improve the 620
mechanical strength of the composites, it did cause a slight decrease in the strain 621
at rupture. More investigation is thus required to optimize its effect on strength, in 622
particular concerning the treatment process (the dilution rate and details of the 623
straw treatment method). In this work, compressed specimens were used to 624
study the influence of plant aggregates and surfactant additives during 625
compression tests whereas extruded specimens were tested in flexion. However, 626
in further work it would be interesting to determine whether or not the adhesion 627
between earth and fibre differs according to the process used: compression or 628 extrusion. 629 630 ACKNOWLEDGEMENTS 631
The authors wish to thank the French National Research Agency - France (ANR) 632
for funding project BIOTERRA - ANR - 13 - VBDU - 0005 Villes et Bâtiments 633
Durables. 634
635
REFERENCES 636
AFNOR (1992). NF P94-057 - Analyse granulométrique des sols - Méthode par 637
sédimentation. 638
AFNOR (1993). NF P94-051 - Détermination des limites d’Atterberg - Limite de 639
liquidité à la coupelle - Limite de plasticité au rouleau. 640
AFNOR (2001). Blocs de terre comprimée pour murs et cloisons : définitions - 641
spécifications - méthode d’essais - condition de réception. 642
AFNOR (2006). Méthode d’essais des ciments - Détermination des résistances 643
mécaniques. 644
Al Rim, K., Ledhem, A., Douzane, O., Dheilly, R.M., and Queneudec, M. (1999). 645
Influence of the proportion of wood on the thermal and mechanical performances 646
of clay-cement-wood composites. Cem. Concr. Compos. 21, 269–276. 647
Algin, H.M., and Turgut, P. (2008). Cotton and limestone powder wastes as brick 648
material. Constr. Build. Mater. 22, 1074–1080. 649
Alvarez, V.A., and Vázquez, A. (2006). Influence of fiber chemical modification 650
procedure on the mechanical properties and water absorption of MaterBi-Y/sisal 651
fiber composites. Compos. Part Appl. Sci. Manuf. 37, 1672–1680. 652
ASTM D 2166 (2004). Standard test method for unconfined compressive strength 653
of cohesive soil. 654
Aubert, J.E., Fabbri, A., Morel, J.C., and Maillard, P. (2013). An earth block with a 655
compressive strength higher than 45 MPa! Constr. Build. Mater. 47, 366–369. 656
Aubert, J.-E., Marcom, A., Oliva, P., and Segui, P. (2014). Chequered earth 657
construction in south-western France. J. Cult. Herit. 16, 293–298. 658
Aubert, J.E., Maillard, P., Morel, J.C., and Al Rafii, M. (2015). Towards a simple 659
compressive strength test for earth bricks? Mater. Struct. 660
Aymerich, F., Fenu, L., and Meloni, P. (2012). Effect of reinforcing wool fibres on 661
fracture and energy absorption properties of an earthen material. Constr. Build. 662
Mater. 27, 66–72. 663
Aymerich, F., Fenu, L., Francesconi, L., and Meloni, P. (2016). Fracture 664
behaviour of a fibre reinforced earthen material under static and impact flexural 665
loading. Constr. Build. Mater. 109, 109–119. 666
Bal, H., Jannot, Y., Gaye, S., and Demeurie, F. (2013). Measurement and 667
modelisation of the thermal conductivity of a wet composite porous medium: 668
Laterite based bricks with millet waste additive. Constr. Build. Mater. 41, 586– 669
593. 670
Bouhicha, M., Aouissi, F., and Kenai, S. (2005). Performance of composite soil 671
reinforced with barley straw. Cem. Concr. Compos. 27, 617–621. 672
BS 6073 (1981). Part 1: precast concrete masonry units, Specification for precast 673
concrete masonry units. 674
Cerezo, V. (2005). Propriétés mécaniques, thermiques et acoustiques d’un 675
matériau à base de particules végétales: approche expérimentale et modélisation 676
théorique. Institut National des Sciences Appliquées. 677
Chabannes, M., Bénézet, J.-C., Clerc, L., and Garcia-Diaz, E. (2014). Use of raw 678
rice husk as natural aggregate in a lightweight insulating concrete: An innovative 679
application. Constr. Build. Mater. 70, 428–438. 680
Chazelles, C-A de, Klein, A., and Pousthomis, N. (2011). Les cultures 681
constructives de la brique de terre crue - Echanges transdiciplinaires sur les 682
constructions en terre crue - 3 (Espérou). 683
Chee-Ming, C. (2011). Effect of natural fibres inclusion in clay bricks: Physico-684
mechanical properties. Geotech. Geol. Eng. 73, 1–8. 685
Danso, H., Martinson, B., Ali, M., and Mant, C. (2015a). Performance 686
characteristics of enhanced soil blocks: a quantitative review. Build. Res. Inf. 43, 687
253–262. 688
Danso, H., Martinson, D.B., Ali, M., and Williams, J. (2015b). Effect of fibre 689
aspect ratio on mechanical properties of soil building blocks. Constr. Build. Mater. 690
83, 314–319. 691
Demir, I. (2006). An investigation on the production of construction brick with 692
processed waste tea. Build. Environ. 41, 1274–1278. 693
Demir, I. (2008). Effect of organic residues addition on the technological 694
properties of clay bricks. Waste Manag. 28, 622–627. 695
Galán-Marín, C., Rivera-Gómez, C., and Petric, J. (2010). Clay-based composite 696
stabilized with natural polymer and fibre. Constr. Build. Mater. 24, 1462–1468. 697
Ghavami, K., Toledo Filho, R.D., and Barbosa, N.P. (1999). Behaviour of 698
composite soil reinforced with natural fibres. Cem. Concr. Compos. 21, 39–48. 699
Guinea, G.V., Planas, J., and Elices, M. (1992). Measurement of the fracture 700
energy using three-point bend tests: Part 1—Influence of experimental 701
procedures. Mater. Struct. 25, 212–218. 702
Hill, C.A.S., Khalil, H.P.S.A., and Hale, M.D. (1998). A study of the potential of 703
acetylation to improve the properties of plant fibres. Ind. Crops Prod. 8, 53–63. 704
Islam, M.., and Iwashita, K. (2006). Seismic response of fiber-reinforced and 705
stabilized adobe structures. In Proceeding of the Getty seismic adobe project 706
2006 Colloquium, (Los Angeles, USA: Getty Conservation Institute). 707
Khedari, J., Watsanasathaporn, P., and Hirunlabh, J. (2005). Development of 708
fibre-based soil–cement block with low thermal conductivity. Cem. Concr. 709
Compos. 27, 111–116. 710
Kornmann, M., and Lafaurie, P. (2005). Matériaux de construction en terre cuite 711
Fabrication et propriétés (Paris: Ed. Septima). 712
Laborel-Préneron, A., Aubert, J.E., Magniont, C., Tribout, C., and Bertron, A. 713
(2016). Plant aggregates and fibers in earth construction materials: A review. 714
Constr. Build. Mater. 111, 719–734. 715
Laborel-Préneron, A., Magniont, C., and Aubert, J.-E. (2017) Characterization of 716
barley straw, hemp shiv and corn cob as resources for bioaggregate based 717
building materials. Waste Biomass Valorization, doi10.1007/s12649-017-9895-z. 718
Lenci, S., Clementi, F., and Sadowski, T. (2012). Experimental determination of 719
the fracture properties of unfired dry earth. Eng. Fract. Mech. 87, 62–72. 720
Magniont, C. (2010). Contribution à la formulation et à la caractérisation d’un 721
écomatériau de construction à base d’agroressources. PhD thesis in Civil 722
Engineering. Université Toulouse III - Paul Sabatier. 723
Martins, A.P.S., Silva, F.A., and Toledo Filho, R.D. (2014). Mechanical behavior 724
of self-compacting soil-cement-sisal fiber composites. Key Eng. Mater. 634, 421– 725
432. 726
Masonry Standards Joint Committee (MSJC) (2008). Building code requirements 727
and specification for masonry structures. 728
Mattone, R. (2005). Sisal fibre reinforced soil with cement or cactus pulp in 729
bahareque technique. Cem. Concr. Compos. 27, 611–616. 730
Millogo, Y., Morel, J.-C., Aubert, J.-E., and Ghavami, K. (2014). Experimental 731
analysis of pressed adobe blocks reinforced with Hibiscus cannabinus fibers. 732
Constr. Build. Mater. 52, 71–78. 733
Millogo, Y., Aubert, J.-E., Hamard, E., and Morel, J.-C. (2015). How properties of 734
kenaf fibers from Burkina Faso contribute to the reinforcement of earth blocks. 735
Materials 8, 2332–2345. 736
Millogo, Y., Aubert, J.-E., Séré, A.D., Fabbri, A., and Morel, J.-C. (2016). Earth 737
blocks stabilized by cow-dung. Mater. Struct. 49, 4583–4594. 738
Minke, G. (2006). Building with earth: design and technology of a sustainable 739
architecture (Basel, Switzerland). 740
Mohamed, A.E.M.K. (2013). Improvement of swelling clay properties using hay 741
fibers. Constr. Build. Mater. 38, 242–247. 742
Morel, J.-C., Pkla, A., and Walker, P. (2007). Compressive strength testing of 743
compressed earth blocks. Constr. Build. Mater. 21, 303–309. 744
Mostafa, M., and Uddin, N. (2015). Effect of banana fibers on the compressive 745
and flexural strength of compressed earth blocks. Buildings 5, 282–296. 746
NZS 4298 Materials and workmanship for earth buildings. 747
Olivier, M., Mesbah, A., El Gharbi, Z., and Morel, J.C. (1997). Mode opératoire 748
pour la réalisation d’essais de résistance sur blocs de terre comprimée: Test 749
method for strength tests on blocks of compressed earth. Mater. Struct. 30, 515– 750
517. 751
Palankar, N., Ravi Shankar, A.U., and Mithun, B.M. (2015). Studies on eco-752
friendly concrete incorporating industrial waste as aggregates. Int. J. Sustain. 753
Built Environ. 4, 378–390. 754
Piattoni, Q., Quagliarini, E., and Lenci, S. (2011). Experimental analysis and 755
modelling of the mechanical behaviour of earthen bricks. Constr. Build. Mater. 25, 756
2067–2075. 757
Quagliarini, E., and Lenci, S. (2010). The influence of natural stabilizers and 758
natural fibres on the mechanical properties of ancient Roman adobe bricks. J. 759
Cult. Herit. 11, 309–314. 760
Segetin, M., Jayaraman, K., and Xu, X. (2007). Harakeke reinforcement of soil– 761
cement building materials: Manufacturability and properties. Build. Environ. 42, 762
3066–3079. 763
TS EN 772-1 (2002). Methods of test for mortar for masonry units - Part 1: 764
determination of compressive strength. 765
Villamizar, M.C.N., Araque, V.S., Reyes, C.A.R., and Silva, R.S. (2012). Effect of 766
the addition of coal-ash and cassava peels on the engineering properties of 767
compressed earth blocks. Constr. Build. Mater. 36, 276–286. 768
Yetgin, Ş., Çavdar, Ö., and Çavdar, A. (2008). The effects of the fiber contents on 769
the mechanic properties of the adobes. Constr. Build. Mater. 22, 222–227. 770
Table 1. Physicochemical properties of the plant aggregates
771
Material Barley straw Hemp shiv Corn cob
Designation Sshort H CC Bulk density (kg.m-3) 57.4 ± 1.2 153.0 ± 2.4 496.8 ± 14.0 Water absorption (%) 414 ± 4 380 ± 11 123 ± 2 Diameter* (mm) 2.33 ± 1.52 2.02 ± 1.23 2.63 ± 0.43 Thermal conductivity (W.m-1.K-1) 0.046 ± 0.001 0.053 ± 0.002 0.097 ± 0.001 Chemical composition Lignin (%) Cellulose (%) Hemicellulose (%) 5.5 37.7 26.7 17.2 50.3 17.9 6.6 41.4 40.7 * Corresponding to average minor axis by image analysis
Table 2. Mixture proportions and Proctor density of compressed specimens 773 Reference FWAS S3 S6 H3 H6 CC3 CC6 Plant aggregate - Short straw Short straw Hemp Hem p Corn cob Corn cob Plant aggregate content (%) 0 3 6 3 6 3 6 Water content (%) 14 19 21 17 20 16 16 Dry density (kg.m -3 ) 1988± 9 1520±1 1195±169 1553± 69 1190 ±44 1877±2 1704±71 774 775
Table 3. Mixture proportions of extruded specimens
776
Reference FWAS S3short S3long H3 SA1 SA2
Plant aggregate - Short straw Long straw Hemp Long straw Long straw Plant aggregate content
(%) 0 3 3 3 3 3 Water content (%) 20 24 26 25 24 25 Surfactant - - - - A1 A2 Dry density (kg.m-3) 1982±8 1781±10 1734±20 1712±11 1784±10 1782±12 777
Table 4. Chemical composition of the earth (LOI: Loss on Ignition)
778
Oxides SiO2 Al2O3 Fe2O3 MnO MgO CaO Na2O K2O TiO2 P2O5 LOI
% 18.73 7.47 2.39 0.03 1.27 35.27 0.09 0.90 0.39 0.09 31.92
Table 5. Measured mechanical properties of the materials: dry density (ρdry) average compressive
780
strength (σc), average ultimate strain (εc), average compressive strength at 1.5% strain (σc,1.5%) and
781
average experimental Young’s modulus (Ec)
782
Testing protocol Reference ρdry (kg/m3) σc (MPa) εc (%) σc,1.5% (MPa) Ec (MPa)
With friction FWAS 1995 ± 0 4.0 ± 0.4 1.3 ± 0.1 4.0 ± 0.4 439 ± 54 S3 1519 ± 1 3.3 ± 0.2 7.8 ± 0.6 0.7 ± 0.1 62 ± 3 S6 1315 ± 27 3.8 ± 0.3 19.9 ± 1.1 0.4 ± 0.0 31 ± 1 H3 1603 ± 57 2.4 ± 0.2 4.8 ± 0.3 0.7 ± 0.1 75 ± 8 H6 1221 ± 70 1.8 ± 0.2 10.7 ± 3.1 0.4 ± 0.1 26 ± 3 CC3 1878 ± 1 3.2 ± 0.2 2.4 ± 0.2 2.1 ± 0.3 217 ± 45 CC6 1754 ± 13 1.8 ± 0.6 2.5 ± 0.5 1.3 ± 0.6 102 ± 69 Reduced friction (RF) FWAS 1982 ± 10 3.9 ± 0.9 1.0 ± 0.1 3.9 ± 0.9 564 ± 161 S3 1520 ± 1 2.1 ± 0.2 5.6 ± 0.5 0.6 ± 0.0 43 ± 5 S6 1075 ± 30 3.6 ± 0.2 17.2 ± 1.5 0.3 ± 0.0 25 ± 0 H3 1504 ± 54 1.6 ± 0.1 3.6 ± 0.3 0.7 ± 0.1 51 ± 5 H6 1159 ± 41 1.5 ± 0.1 7.5 ± 1.1 0.4 ± 0.0 22 ± 1 CC3 1876 ± 1 1.3 ± 0.1 1.2 ± 0.1 1.3 ± 0.1 136 ± 40 CC6 1654 ± 53 1.0 ± 0.1 1.8 ± 0.2 0.9 ± 0.0 69 ± 9 783 784
Table 6. Average experimental mechanical properties: dry density (ρdry), flexural strength (σf),
785
ultimate strain (εf), experimental Young’s modulus (Ef) and fracture energy (Gf)
786
Type ρdry (kg.m-3) F (N) σf (MPa) εf (%) Ef (MPa) Gf (J.m-2) FWAS 1982 ± 8 2053 ± 120 1.88 ± 0.10 0.22 ± 0.02 856 ± 57 7 ± 0 S3short 1781 ± 10 1900 ± 123 1.80 ± 0.13 0.44 ± 0.11 475 ± 49 296 ± 50 S3long 1734 ± 20 1776 ± 135 1.69 ± 0.14 0.55 ± 0.14 385 ± 29 484 ± 41 H3 1712 ± 11 1453 ± 86 1.34 ± 0.08 0.31 ± 0.04 577 ± 72 157 ± 9 SA1 1784 ± 10 1798 ± 163 1.69 ± 0.16 0.49 ± 0.03 442 ± 72 462 ± 11 SA2 1782 ± 12 1824 ± 183 1.73 ± 0.10 0.36 ± 0.08 508 ± 67 538 ± 81 787 788
Figure 1. Compressed specimens of FWAS (a) and S6 (b) 789
790 791
Figure 2. Vacuum extruder 792
Figure 3. Compressive test method: (a) with friction and (b) with reduced friction 794
Figure 4. Flexural test set up 796
797 798
Figure 5. Comparative grain size distribution curve for earth: FWAS and standard 799
800 801
Figure 6. X-ray diffraction pattern of the earth. 802
803 804
Figure 7. TG and DTG (Derivative Thermo-Gravimetric) curves of the earth 805
806 807
Figure 8. Bulk density as a function of the plant aggregate content 808
809 810
Figure 9. Compressive strength of the mixtures according to the testing protocol 811
812 813
Figure 10. Results for compressive strength test with friction 814
815 816
Figure 11. Strain-stress diagram for all the specimens 817
818 819
Figure 12. Maximum compressive strength (σc) and compressive strength at 820 1.5% strain (σc,1.5%) 821 822 823
Figure 13. Young’s moduli of the materials for both protocols 824
825 826
Figure 14. Young’s modulus from compressive test as a function of the plant 827 aggregate content 828 829 830
Figure 15. Young’s modulus as a function of the density 831
832 833
Figure 16. Influence of the plant aggregate on flexural behavior: (a) Flexural load-834
carrying capacity, (b) Peak strain (εf), (c) Average fracture energy (Gf) and (d) 835
Young’s modulus 836
837 838
Figure 17. Typical load-deflection curves 839
840 841
Figure 18. Influence of the surfactants on flexural behavior: (a) Flexural load-842
carrying capacity, (b) Peak strain (εf), (c) Average fracture energy (Gf) and (d) 843
Young’s modulus 844