Publisher’s version / Version de l'éditeur:
Journal of the Acoustical Society of America, 63, 5, pp. 1444-1450, 1978-05
READ THESE TERMS AND CONDITIONS CAREFULLY BEFORE USING THIS WEBSITE. https://nrc-publications.canada.ca/eng/copyright
Vous avez des questions? Nous pouvons vous aider. Pour communiquer directement avec un auteur, consultez la première page de la revue dans laquelle son article a été publié afin de trouver ses coordonnées. Si vous n’arrivez pas à les repérer, communiquez avec nous à [email protected].
Questions? Contact the NRC Publications Archive team at
[email protected]. If you wish to email the authors directly, please see the first page of the publication for their contact information.
NRC Publications Archive
Archives des publications du CNRC
This publication could be one of several versions: author’s original, accepted manuscript or the publisher’s version. / La version de cette publication peut être l’une des suivantes : la version prépublication de l’auteur, la version acceptée du manuscrit ou la version de l’éditeur.
Access and use of this website and the material on it are subject to the Terms and Conditions set forth at
Comparison of reverberation measurements using Schroeder's impulse
method and decay-curve averaging method
Chu, W. T.
https://publications-cnrc.canada.ca/fra/droits
L’accès à ce site Web et l’utilisation de son contenu sont assujettis aux conditions présentées dans le site
LISEZ CES CONDITIONS ATTENTIVEMENT AVANT D’UTILISER CE SITE WEB.
NRC Publications Record / Notice d'Archives des publications de CNRC:
https://nrc-publications.canada.ca/eng/view/object/?id=35a62e95-3db6-4704-abed-b9cd6a2ce11e https://publications-cnrc.canada.ca/fra/voir/objet/?id=35a62e95-3db6-4704-abed-b9cd6a2ce11er J 2 1 d
National Research
Conseil national
I'
1
+
Council Canada
c.
2de recherche Canada
COMPARISON OF REVERBERATION
MEASUREMENTS
USING
SCHROEDER'S IMPULSE METHOD
AND
DECAY-CURVE AVERAGING METHOD
by
W.T.
Chu
Reprinted from .,,,..
Journal of the Acoustical Society of America
BU1LDING
RESEARCH
Vol.
63,
No.5,
M a y 1978I--
-
L I P M R Y
-
p.
1444
-
1450
I
iDBR Paper No. 792
Division of Building Research
SOMMAIRE
l'aide d'un r6seau num6rique de saisie des donnEes et d'un
mini-ordinateur, on a Etudi6 2 fond deux mEthodes pour la
dgtermination des pEriodes de r6verbCration du point de vue des
essais effectuEs dans des salles de r6verbGration. La premiere
mgthode est la "mEthode d'impulsions int6gr6est' de Schroeder; on a prSt6 une attention particulisre au caractsre rEp6titif et
5 l'influence du rapport signal
-
bruit sur le succss de la mise en application de la m6thode. La deuxisme mEthode inclut le calcul de la moyenne d'un grand nombre de courbes de d6composi- tion logarithmiques. On a remarquE que, mgme dans le cas de ddcompositions non uniformes, les courbes moyennes de ddcomposi- tion obtenues selon la deuxisme mEthode correspondent de prssration
Cc
of reverbel
Imeasurements using Sch~
'--pulse metnod and decay-curve averaging methda)
I INT I A b. rev1 the I - - mar cay dur
W. T. Chu
Division of Building Researclr, I v u r w r r u r Research Council of CC...~,, VL.Y~~,Canada K I A OR6
(Received 17 June 1977; revised 8 November 1977)
Utilizing a digital acquisition system and minicomputer, two promising techniques for ac determination of reverberation times have been studied in detail from the viewpoint of s reverberation room tests. The first is Schroeder's "integrated impulse method," and special atten given to the question of repeatability and the influence of signal-to-noise ratio on the sl application of the method. The second technique involves taking an ensemble average of a large logarithmic decay curves. It was found that, even for nonuniform decays, the average deca obtained by the second method compared well with those determined by the Integrated Impulse PACS RODUCl numbers: 43.55.Mc, 43.55.Br .n accurat tant f o r b chamber
:e determination of reverberation decay i s im- loth absorption measurements in reverbera- 'sand the evaluationof concert hall acoustics. rief review of some of the more important methods of erberation measurement, developed and utilized since time of Sabine, has been given by Broach and Jensen.
'
I he most common method in use i s to excite the room with filtered random noise for a few seconds and then observe the decay of the sound field a s plotted on a level recorder. This will be referred to a s the "individual decay method. " Its limited application to room acous-tics has long been recognized because the true nature of the decay i s often obscured by random fluctuations in the decay curves. F o r absorption measurements in re- verberation chambers, a technique frequently used to minimize the effect of these fluctuations on the measured reverberation-time values i s to repeat the experiment ly times and average the results from the individual de-
tio on was 1ccessful number of
.,
J 1",.,.",- ' ,Y .. Method. Jusof ie' s -_.___,_ _--- l ._
approac -__ __
L_.__Based on Kuttruff and i r :h, a
commerical unit, the Reverueratiu11 rr u c e s s o r Lype 4422, has been produced by Briiel & Kjaer f o r this technique.
The method has not been adopted for standard absorp- tion measurements. Recently, a comparison of the ad- vantages of this method over those of the individual de- cay method for purposes of absorption measurement has been carried out by Behar, but the conclusions seem to be debatable.
The following will describe experiences a t DBR/NRC in implementing Schroeder's "integrated impulse meth- od" by means of a minicomputer and compare the re- sults obtained with those obtained by another proposed method, the "decay-curve averaging method. "
I. SCHROEDER'S INTEGRATED IMPULSE METHOD (IIM)
A. Theory and experimental method
curves. To overcome this time-consuming proce- It can be shown analytically5 that the ensemble aver- e, many laboratories have developed apparatuses for
age ( s Z ( t ) ) of the squared decaying sound pressure at a
more automatic evaluation, mostly by means of a com-
receiving point in a room excited by filtered white noise puter. somezp3 involve computation of reverberation times
i s equal to a certain integral over the squared impulse from the slopes of the decay curves. o t h e r s 4 a r e just
response y 2 ( r ) for the room. Here the response in- modern computerized versions of the chronograph method.
cludes effects associated with the transducers and any
lore than a decade Schr0eder5 proposed new filters f o r shaping the spectrum of the noise. Mathe-
which, in a measurement, yields a de- matically the relation can be written a s follows: . curve that is identical to the average over infinitely
many decay curves that would be obtained from exciting the enclosure with bandpass-filtered noise. " This i s true only f o r aparticular room, source, and receiver arrangement. Use of this method may result in excep- tionally smooth reverberation decay curves from which accurate determination of the initial slopes i s possible. Thus it offers a great advantage in the evaluation of au- ditorium and concert-hall acoustics. In cases of sound- absorption measurement where additional spatial aver- ages a r e required, however, it becomes l e s s attractive in view of the stringent requirement of instrumentation.
his paper was presented at the 93rd meeting of the Acousti-
cal Society of America [J. Acoust. Soc. Am. 61, S33(A) (1977)l.
where N is proportional to the power- spectral density of the noise in the frequency range measured.
The function r ( r ) can be considered a s the response of the room excited by a signal corresponding to the im- pulse response of the bandpass filter used, where the impulse response of the filter may be viewed a s a modi- fied tone burst with a spectrum identical to the spec- trum of the filtered white-noise signal. This is true if the duration of the pusle used to excite the filter i s much shorter than the period of the center frequency of the bandpass filter. Thus an identity exists between the en- semble average of the squared decaying sound pressure and an integrated squared tone-burst response.
1445 W. T. Chu: Comparison of RT rneasurernene by two N
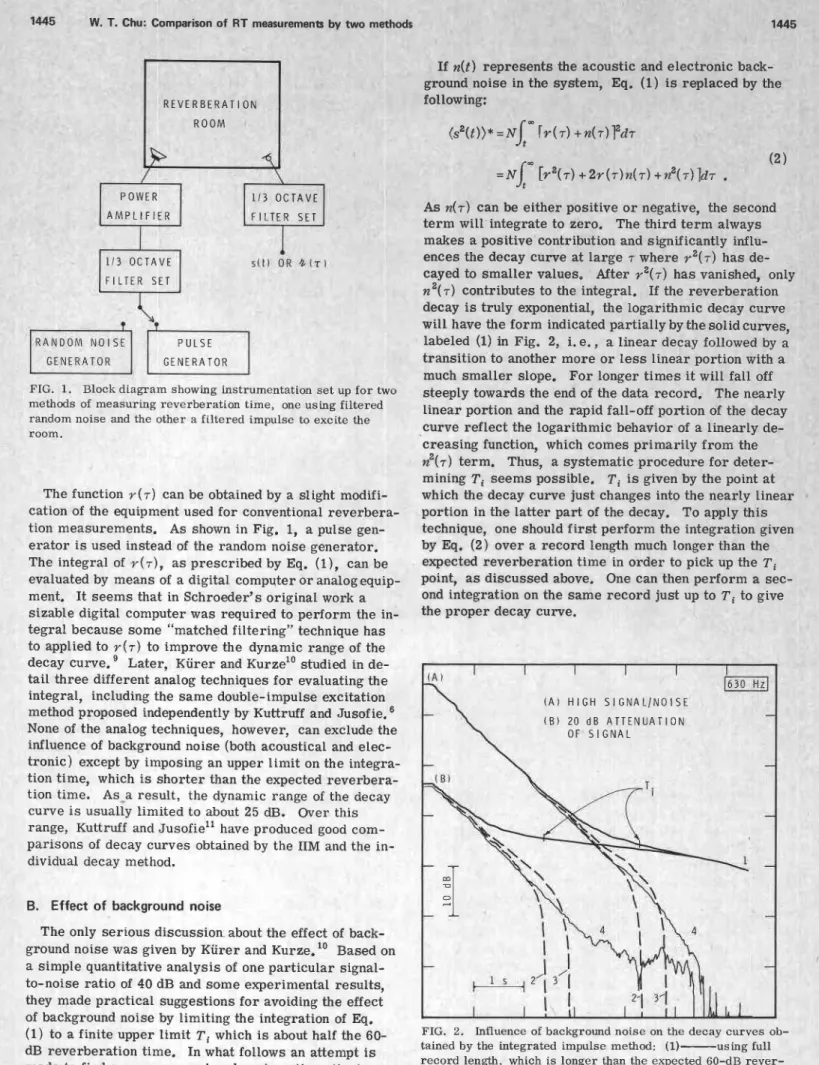
If n(t) represents the acoi ground noise in the system, following: ustic and Eq. (1) electronic back- is replaced by the R E V E R B E R A T I O N R O O M h ' 3 O C T A V E
As n(7) can be either positive o r negative, the secona ? r m will integrate to zero. The third t e r m :
lakes a positive contribution and significant1 nces the decay curve a t large T where r 2 ( r )
bayed to smaller values. After r2(7) has vanished, 01 n 2 ( r ) contributes to the integral. If the reverberation decay i s truly exponential, the logarithmic decay curv will have the form indicated partially by the solid curve ibeled (1) in Fig. 2, i. e., a linear decay followed by ?ansition to another more o r l e s s linear portion with luch smaller slope. F o r longer times it will fall off steeply towards the end of the data record. The near1 linear portion and the rapid fall-off portion of the dec: curve reflect the logarithmic behavior of a linearly de creasing function, which comes primarily from the n2(T) term. Thus, a systematic procedure f o r deter- mining T i seems possible, T i i s given by the point a t
which the decay curve just changes into the nearly lint portion in the latter part of the decay. To apply this technique, one should f i r s t perform the integration g i ~ by Eq. (2) over a record length much longer than the expected reverberation time in order to pick up the T i
point, a s discussed above. One can then perform a sf ond integration on the same record just up to T i to giv
the proper decay curve.
always y influ- has de- s l f l O R 4lrl S E T
]
F I L T E R t N O I S E-.
.
? . RANUQM G E N E R Fr
G E N E R It i . 1. HOCK alagram snowing instrumentation set up for two
methods of measuring reverberation time, one using filtered random noise and the other a filtered impulse to excite the room.
The function r ( r ) can be obtained by a slight modifi- cation of the equipment used for conventional reverbera- tion measurements. As shown in Fig. 1, a pulse gen- erator is used instead of the random noise generator. The integral of Y ( T ) , a s prescribed by Eq. ( I ) , can be evaluated by means of a digital computer o r analog equip- ment. It seems that in Schroeder's original work a sizable digital computer was required to perform the in- tegral because some "matched filtering" technique has to applied to r ( r ) to improve the dynamic range of the decay curve. Later, Kiirer and ~ u r z e " studied in de- tail three different analog techniques for evaluating the integral, including the same double-impulse excitation method proposed independently by Kuttruff and Jusofie.' None of the analog techniques, however, can exclude the influence of background noise (both acoustical and elec- tronic) except by imposing an upper limit on the integra- tion time, which i s shorter than the expected reverbera- tion time. As-a result, the dynamic range of the decay curve i s usually limited to about 25 dB. Over this range, Kuttruff and ~ u s o f i e " have produced good com- parisons of decay curves obtained by the IIM and the in- dividual decay method.
ren
-
in r-
1630 H z 1 ( A ) H I G H S I G N A L / N O I S E ( B ) 20 d B A T T E N U A T I O N O F S I G N A L-
B. Effect of background noise
The only serious discussion, about the effect of back- ground noise was given by Kiirer and Kurze.1° Based on a simple quantitative analysis of one particular signal- to-noise ratio of 40 dB and some experimental results, they made practical suggestions for avoiding the effect of background noise by limiting the integration of Eq. (1) to a finite upper limit T i which is about half the 60-
dB reverberation time. In what follows an attempt i s made to find a more general and systematic criterion for choosing Ti. An alternative method of handling the
background noise is also proposed.
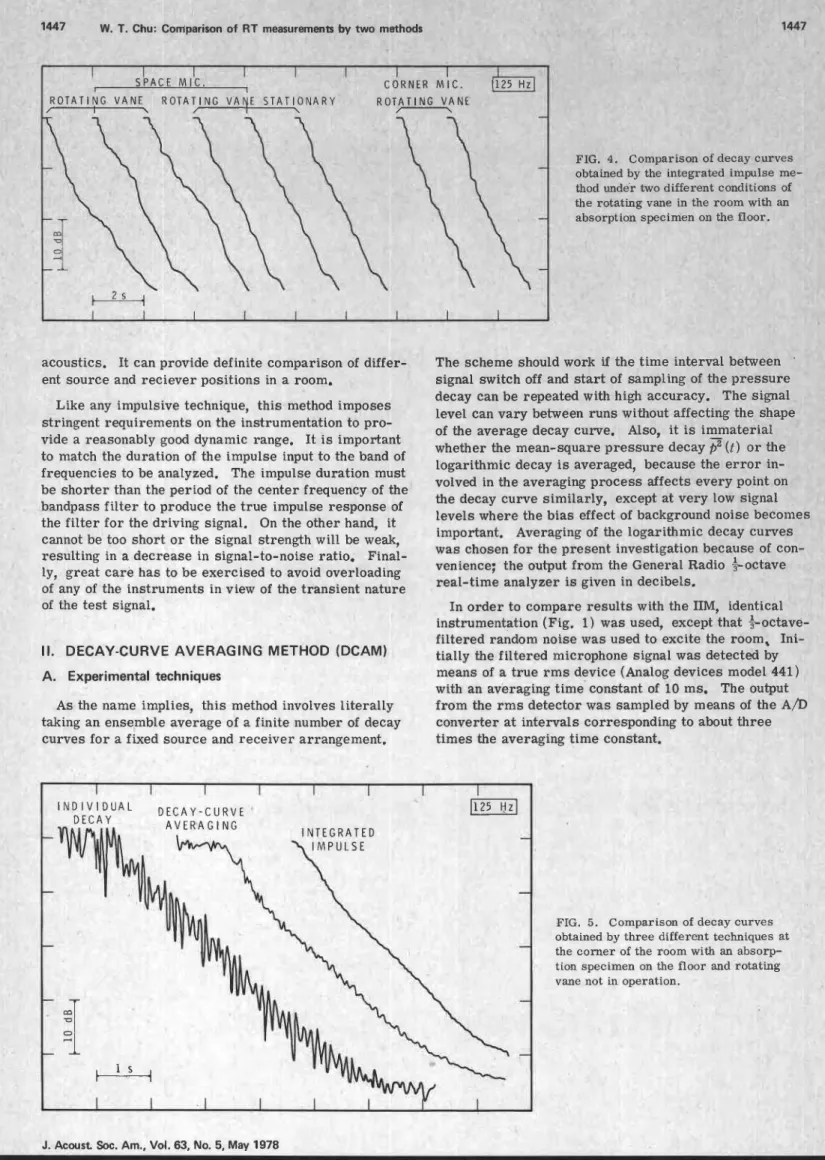
FIG. 2. Influence of background noise on the decay curves ob- tained by the integrated impulse method: (1)-using full record length, which is longer than the expected 60-dB rever- beration time, (2)
- -
-using record length= T i , (3)- - -using record length slightly longer than T i , and (4)-using full record length with subtraction of background noise.T. Chu: Comparison 01 n B IIIeaaurelrlcIIm UY two methods (a) H I G H S I G N A L I N O I S E 15 d B A T T E N U A T I O N O F S I G N A L A -A. by tl leng time m0C.c
.
3. Influence of background..,,,,
,,, b u l ~ ~ a U U L ~ U L C ~he integrated impulse method: (1)- using full record th, which is longer than the expected 60-dB reverberation
!, (2)-
-
-using record length= T i , and (4)-using fullLGrdrd length with subtraction of background noise.
Another scheme f o r handling the background noise i s to subtract its mean-square value from the original squared signal before perfroming the integration. Long
after the response ~ ( 7 ) h a s vanished, a temporal aver-
age v a l u e 2 of the background noise can be obtained, using identical settings of the instruments. The contri-
bution of the residual background noise (n2
-2)
will besmall. Effectively, the process i s presented by
This scheme completely eliminates any uncertainty in choosing the finite upper limit of integration.
To test the proposed schemes, the IIM was imple-
mented by means of a minicomputer with 32K memory, the Nova 820. The experiment was performed in a r e - verberation chamber equipped with both fixed diffusers and a rotating vane; volume of the room i s 255 m3. A detailed description of the facility i s given in Ref. 12. The instrumentation setup i s similar to that given in
Fig. 1. A single microphone was used at the corner of
the room, and the filtered microphone signal was digi-
tized by a 12-bit
AD
converter and then processed bythe Nova 820 minicomputer. With the necessary pro-
gram written in BASIC, a total of 8000 points could be
used.
A proper sampling frequency has to be chosen, de- pending on reverberation time. As was pointed out by
Atal et al., the sampling rate for this application can
be slower than that given by the Nyquist criterion. F o r some high-frequency c a s e s the sampling frequency had to be slightly lower than the Nyquist sampling condition because of the 8000 points and the reverberation-time limit. l e result! .n Fig. 2 C. Repeatability rate t h e s ~ hn..rl c. s shown i
uUU techniques for the 630-Hz , - u b L a ~ ~ ua,,u. UCL 1-1
corresponds to a relatively large signal-to-noise ratio. Comparison of the peak of the measured response func-
tion ~ ( 7 ) with the r m s value of the background noise in-
dicates a signal-to-noise ratio of about 50 dB. F o r Set (B) the microphone signal was attenuated by 20 dB be- fore filtering and digitizing to enhance the effect of elec- tronic noise. In both s e t s the thick solid curves [la-
beled (1) ] represent the logarithm of the decay function
(s2(t))* given by Eq. (2), from which Ti can be deter- mined. Dotted curves labeled (2) and (3) represent in- tegration of Eq. (2) up to Ti and slightly greater than
Ti, respectively. Light solid curves labeled (4) depict
the logarithm of the decay function (s2(t))** given by Eq. (3). Another s e t of results for the 125-Hz band i s presented in Fig. 3. Here the signal-to-noise ratio i s about 47 dB. F o r the f i r s t method to work, an accurate determination of Ti is required (Fig. 2). In this re- spect the scheme with background-noise subtraction i s definitely superior and will be adopted for all subsequent investigations. Using this method, a dynamic range of
30-40 dB has been achieved foi r the decr ay curves.
e vari-
n+ I A \
As the decay curve obtained by the
IIM
represents theensemble average over an infinite number of measure- ments, there i s no doubt that the method will produce
identical decay curves if repeated for a fixed room,
source, and receiver arrangement. This has been con- firmed experimentally by several detailed investiga- tions. 1 .'O,l'
In many of the laboratories for sound-absorption mea- surement in North America, rotating diffusers a r e com- monly employed to increase the diffusion of their test chambers. One would not expect that repeatable curves would be obtained for a fixed source and receiver a r - rangement in these rooms because conditions a r e con- tinuously changed by the rotating diffuser. This i s con- clusively demonstrated in Fig. 4. The experiment was performed with an absorption specimen placed on the floor to create a nonlinear logarithmic decay. With the rotating vane stationary, even the minute details of the decay curve a r e reproduced in successive records. De- cay curves show the expected variation a s the vane ro- tates. It was noted that the variation was greater with the microphone placed away from the room boundaries rather than in the corner. Presumably, the microphone in the corner interacts with more modes than does the microphone located elsewhere in the room.
D. Advantages and disadvantages
The main advantage of the IIM is that a single mea-
surement i s sufficient to produce an ensemble average of the decay curves that would be obtained with band- pass-filtered noise a s an excitation signal. The result- ing smooth decay curve improves the accuracy of rever- beration-time measurement and provides a means of detecting nonexponential decays. Thus the method i s particularly suited to the evaluation of concert-hall
W. T. Chi I: Coniparis ion of RT r tts by two I methods -1 C O R N E R I
I
R O T A T I N G V A N E R O T A T I N G V A Y E S T A T l O N A l:T
nd
\
*
I 1 L A C E M I C .FIG. 4. Comparison of decay curvc obtained by the integrated impulse r thod under two different conditions (
the rotating vane in the room with a ..L..-- l i o n speci :s ne- 3f n imen on th .e floor.
acoustics. It can provide definite comparison of dif ent source and reciever positions in a room.
The schei d work if interval between signal SWl~cn ULI and s t a r t UI b a r ~ ~ ~ ~ i n g of the p r e s s u r
decay can be repeated with high accuracy. The signa level can vary between runs without affecting the shal of the average decay curve. Also, it i s immaterial whether the mean-square p r e s s u r e decay
2
( t )
o r the logarithmic decay i s averaged, because the e r r o r in- volved in the averaging process affects every point 01the decay curve similarly, except at very low signal levels where the bias effect of background noise beco important. Averaging of the logarithmic decay curve was chosen for the present investigation because of c venience; the output from the General Radio
real-time analyzer i s given in decibels. the time
- - I .
fer- Like any impulsive technique, this method imposes stringent requirements on the instrumentation to pro- vide a reasonably good dynamic range. I t i s important to match the duration of the impulse input to the band of frequencies to be analyzed. The impulse duration must be shorter than the period of the center frequency of the bandpass filter to produce the true impulse response of the filter for the driving signal. On the other hand, it cannot be too short o r the signal strength will be weak, resulting in a decrease in signal-to-noise ratio. Final- ly, great c a r e has to be exercised to avoid overloading of any of the instruments in view of the transient nature
of the test signal. In o r d e r to compare results with the IIM, laentlcal instrumentation (Fig. 1) was used, except that
sect;
filtered random noise was used to excite the room, I tially the filtered microphone signal was detected by means of a true r m s device (Analog devices model 441with an averaging time constant of 10 ms. The output from the r m s detector was sampled by means of the
AD
converter a t intervals corresponding to about three times the averaging time constant.we-
hi-
ll. DECAY-CURVE AVERAGING METHOD (DCAM) A. Experimental techniques
As the name implies, this method involves literally taking an ensemble average of a finite number of decay curves f o r a fixed source and receiver arrangement.
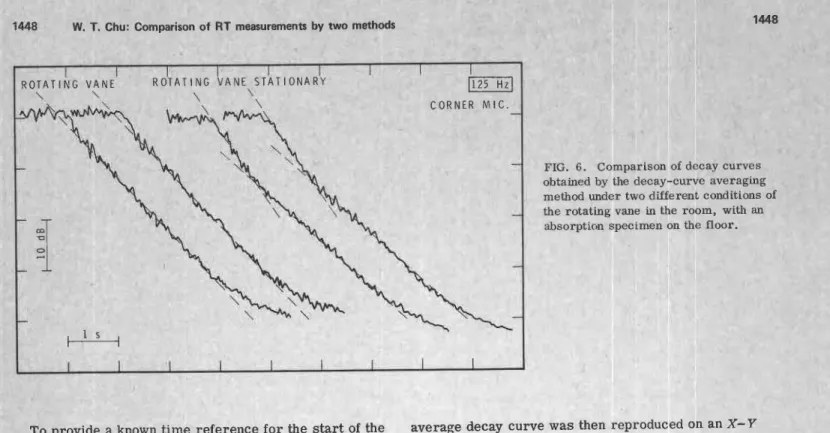
FIG. 5. Comparison of decay curves obtained by three different techniques a the corner of the room with an absorp- tion specimen on the floor and rotating vane not in operation.
'.
Chu: Con nparison of rements by two metho I I V A N E S T , \ IRNER M I C .-
-
-
k
-
"\'-?,
--
IFIG. 6 . Comparison of decay curves obtained by the decay-curve averaging method under two different conditions of the rotating vane in the room, w'+'.
--
absorptic~n s n the f l o o ~average decay curve w plotter.
a s then r
TI ! a known
decay process, switching OII OK m e ranaom nolse source
must be controlled by the computer. In the present set- up a control signal was given by the computer to a pulse
wenerator, which held the noise source on for 9 s, then
led it off. Slightly before the end of this interval the
I converter was initiated to sample the r m s detector
but a t a rate of 30 samples per second. A logarithmic
decay curve was computed and stored in the computer. The next decay curve was then added to the stored one
point by point to generate an intermediate average
se. The process continued until a predetermined irves were averaged. To determine the
I 2peated runs Pequired, the successive av-
;a ~ u r vcs were displayed on a cathode-ray-tube dis-
play unit a s the averaging process continued. Even a t the 125-Hz band a total of 30 repeated runs was found to be adequate. The number required becomes pro- gressively smaller for higher-frequency bands, although for convenience 30 runs a r e normally used. The final
o provide . time ref
8 . *.- 'erence fc ,- 3 . - ,r the sts -,--- - 2 - ~ r t of the . - . - - - I of the dc :hniques r
...
...nth,., res ob-Figure 5 shows a co. ?cay cur\
tained by the three diff ~ n d e r the
conditions. The indiviuua~ u c L a y I L ~ G U I U ~ gave a s~..~.,
logarithmic decay similar to that which would be ob- tained by a level recorder. I t can hardly show the non- linear nature of the decay. A comparison of the curves produced by the DCAM and the IIM confirms belief that present-day electronics can give very precise timing control to make the proposed scheme possible. The DCAM can average out the random fluctuations without affecting the general characteristics of a decay curve.
mparison 'erent tec a..-1 an", same c a i n m l n turn
AD
0utF cur1 num num e r a $ B. RepeatabilityAs the DCAM uses a true averaging technique, any time-varying influence due to the rotatingvane can alsobe
averaged out. Figures 6 and 7 compare the average de-
cay curves (over 30 decays) obtained from repeated
I I I I I I I I SPACE M I C .
-
-
-
-*
II
I I I II
I IFIG. 7. Comparison of decay curves obtained by the decay-curve averaging method under two different conditions of the rotating vane in the room, with an absorption specimen on the floor.
iu: Compar measurements by two methods l N T E G R A T E D I M P U L S E M E T H O D T N 0 . 5 4 . 6 7 1 4 . 6 1 2 4 . 6 2 7 4 . 6 3 8 4 . 6 9
-
I I E T H O D IDI
\ two diffei ...
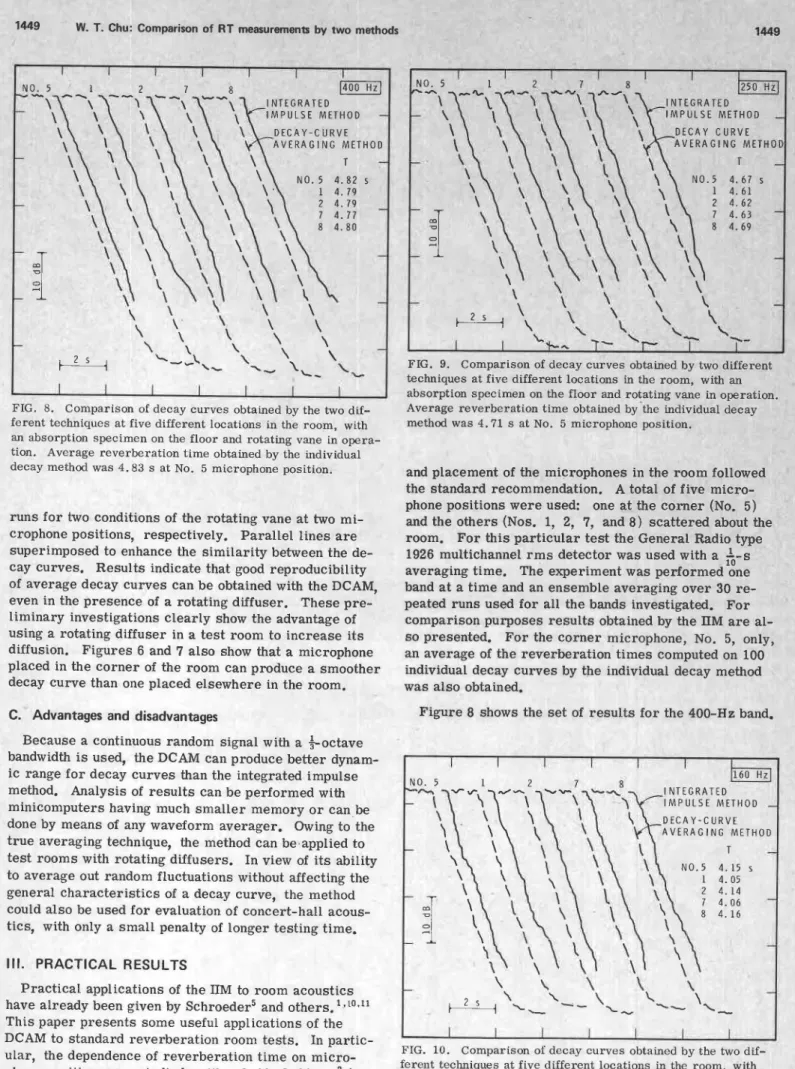
FIG. 9. Comparison of decay curves obtained bytechniques at five different locations in the room, witn an absorption specimen on the floor and rotating vane in opera Average reverberation time obtained b y t h e individual deca: method was 4.71 s at No. 5 microphone position.
FIG. 8. Comparison of decay curves obtained by the two dif- ferent techniques a t five different locations in the room, with an absorption specimen on the floor and rotating vane in opera- tion. Average reverberation time obtained by the individual
decay method was 4 . 8 3 s at No. 5 microphone position. and placement of the microphones in the room follow^
the standard recommendation. A total of five micro- phone positions were used: one a t the corner (No. 5) and the others (Nos. 1, 2, 7, and 8 ) scattered about the room. F o r this particular test the General Radio type 1926 multichannel r m s detector was used with a k-s averaging time. The experiment was performed one band a t a time and an ensemble averaging over 30 re- peated runs used for all the bands investigated. F o r comparison purposes results obtained by the IIM a r e al- s o presented. For the corner microphone, No. 5, only, an average of the reverberation times computed on 100 individual decay curves by the individual decay method was also obtained.
runs for two conditions of the rotating vane a t two mi- crophone positions, respectively. Parallel lines a r e superimposed to enhance the similarity between the de- cay curves. Results indicate that good reproducibility of average decay curves can be obtained with the DCAM, even in the presence of a rotating diffuser. These pre- liminary investigations clearly show the advantage of using a rotating diffuser in a test room to increase i t s diffusion. Figures 6 and 7 also show that a microphone placed in the corner of the room can produce a smoother decay curve than one placed elsewhere in the room.
Figure 8 shows the s e t of results for the 400-Hz band. C. Advantages and disadvantages
Because a continuous random signal with a +octave bandwidth i s used, the DCAM can produce better dynam- ic range f o r decay curves than the integrated impulse method. Analysis of results can be performed with minicomputers having much smaller memory o r can-be done by means of any waveform averager. Owing to the t r u e averaging technique, the method can be,applied to test rooms with rotating diffusers. In view of i t s ability to average out random fluctuations without affecting the general characteristics of a decay curve, the method could also be used for evaluation of concert-hall acous- tics, with only a small penalty of longer testing time.
Ill. PRACTICAL RESULTS
Practical applications of the IIM to room acoustics have already been given by Schroeder5 and others.'.lO." This paper presents some useful applications of the DCAM to standard reverberation room tests. In partic- ular, the dependence of reverberation time on micro- phone positions was studied, with a 2.44
x
2.44-
m2 (8 x 8 f p ) absorption specimen placed in the room. As in all standard tests, the rotating vane was in operationFIG. 10. Comparison of decay curves obtained by the two d ferent techniques at five different locations in the room, wit1 an absorption specimen on the floor and rotating vane in ope tion. Average reverberation time obtained by the individual decay method was 4.15 s at No. 5 microphone position.
W. T. Chu: Comp IT measurements by t u NO methods FIG. I ferent o n qho 11. Comp technique fir-+inn cr arison of I s a t five d . n n i m o m n r The best s u ..A*- ! space-a I'he f i r s t riations i
two methods a r e complementary. ' i s ~ i t e d for investigations of spatial va in a
luulll, with the object of proceeding a s directly a s
sible to the ensemble average for each position; th ond method i s better for standard room t e s t s where ting diffusers a r e often employed to improve diffus and the object i s to determine the verage rever- beration time for the whole room
yvu-
e sec- rota- ion Preliminary results also indicate Lne usefulness of the
second method for investigating t lveness of the rotating vane in improving the dii test rooms.
he effecti 'fusion of ACKNOWLEDGMENT It is E decay ~ - - . # .
lpparent that a t this rather high-frequency band the curves obtained by the IIM a t different microphone poslrions showed noticeable variations because of the ro- tating vane effect. Those obtained by the DCAM, how- ever, show very little difference. Similar plots for a few other frequency bands a r e shown in Figs. 9-11. To give an unbiased estimate of the reverberation time, a straight line was fitted to the linear portion of each de- cay curve obtained by the DCAM, starting 5 dB below the maximum level, by means of the least-squares tech- nique. The resulting reverberation times a r e tabulated in the individual figures. Values f o r the No. 5 micro- phone position agree well with the average values ob- tained by the individual decay method. Except for the 125-Hz case, results indicate that reverberation-time measurements do not depend on microphone position in the test room. I t i s thus reasonable to c o n c l ~ d e ' ~ that for frequencies higher than 125 Hz, which corresponds to a model overlap of about 1, sufficient diffusion has been achieved by means of stationary and rotating dif- fusers, and that a single microphone-position measure- ment a t the corner i s adequate. At 125 Hz, spatial av- erage using a number of microphone positions i s still necessary.
IV. CONCLUSIONS
An extensive investigation of Schroeder's integrated impulse method together with a proposed decay-curve averaging method has been performed for reverberation measurements. Results show beyond any doubt that both methods a r e accurate and superior to the individual de- cay method.
:hank T. I
s and A. C
The author wishes to t 1. Northwood for his suggestions and remarks
:.
C. Warnock f o r his assistance in programming. This paper is a contribu-iecay curves obtained by the two dif- tion from the Division of Building Research, National ifferent locations in the room, with Research Council of Canada, and i s published with the
-.
au,uL,bL,. b,,L,L..., "11 the floor and rotating vane in opera- approval of the Director of the Division.tion. Average reverberation time obtained by the individual decay method was 5.38 s at No. 5 microphone position.
'J. T. Broch and V. N. Jensen, "On the measurement of reverberation," Briiel & Kjaer Tech. Rev. No. 4 (1966).
2 ~ F . . Spring, "Automatic reverberation time measurement with the aid of a computer," Proc. 7th Int. Congr. Acoust. Paper 24-A2 (1971).
3 ~W. Bartel and P. A. Schade, "Digital processing of decay .
rates for reverberant sound fields," Inter-Noise 74 Proc., 61-64 (1974).
4 ~ Baker, "An automatic reverberation time measuring sys- .
tem," Appl. Acoust. 7, 271-280 (1974).
'M. R. Schroeder, "New method of measuring reverberation time," J. Acoust. Soc. Am. 37, 409-412 (1965).
6 ~ Kuttruff and M. . J. Jusofie, "Nachhall messungen nach dem verfahren der integrierten imputsantwort," Acustica 19, 56- 58 (1967/1968).
'A. Behar, "Comparison of RT-measurements using the IS0 and the Schroeder-Kuttruff measurement methods, " Acustica
34, 46-47 (1975).
'H. Kuttruff, "Comments to 'Comparison of reverberation measurements using the IS0 and the Schroeder-Kuttruff method, ' " Acoustics 34, 48 (1975).
'B. S. Atal, M. R. Schroeder, G. M. Sessler, and J. E . West, "Evaluation of acoustic properties of enclosures by means of digital computers," J. Acoust. Soc. Am. 40, 428- 433 (1966).
'OR. Kiirer and U . Kurze, "Integrationsverfahren zur Nachhal- lanswertung, " Acustica 19, 313-322 (1967/1968).
'IH. Kuttruff and M. J. Jusofie, "Messungen des Nachhallver- laufs in mehreren RPumen, ausgefiihrt nach dem Verfahren der integrierten Impulsantwort, " Acustica 21, 1-9 (1969).
I2w. T. Chu, "Precision of sound pressure level measurements in a reverberation room," Natl. Res. Coun. Can., D h . Build. Res., BR Note 101 (1975).
1 3C 423-77, "Standard Method of Test for Sound Absorp- ~ ~ ~ ~
tion of Acoustical Materials in Reverberation Rooms, " para- graph 5.5.