HAL Id: hal-01580875
https://hal.archives-ouvertes.fr/hal-01580875
Submitted on 4 Sep 2017
HAL is a multi-disciplinary open access
archive for the deposit and dissemination of
sci-entific research documents, whether they are
pub-lished or not. The documents may come from
teaching and research institutions in France or
abroad, or from public or private research centers.
L’archive ouverte pluridisciplinaire HAL, est
destinée au dépôt et à la diffusion de documents
scientifiques de niveau recherche, publiés ou non,
émanant des établissements d’enseignement et de
recherche français ou étrangers, des laboratoires
publics ou privés.
Inter-speaker variability: speaker normalisation and
quantitative estimation of articulatory invariants in
speech production for French
Antoine Serrurier, Pierre Badin, Louis-Jean Boë, Laurent Lamalle, Christiane
Neuschaefer-Rube
To cite this version:
Antoine Serrurier, Pierre Badin, Louis-Jean Boë, Laurent Lamalle, Christiane Neuschaefer-Rube.
Inter-speaker variability: speaker normalisation and quantitative estimation of articulatory
invari-ants in speech production for French.
Interspeech 2017 - 18th Annual Conference of the
In-ternational Speech Communication Association, Aug 2017, Stockholm, Sweden.
pp.2272-2276,
Inter-speaker variability: speaker normalisation and quantitative estimation of
articulatory invariants in speech production for French
Antoine Serrurier
1, Pierre Badin
2, Louis-Jean Boë
2, Laurent Lamalle
3, Christiane Neuschaefer-Rube
11
Clinic for Phoniatrics, Pedaudiology & Com. Disorders, Uniklinik RWTH Aachen, Germany
2
GIPSA-Lab, Univ. Grenoble Alpes & CNRS, F-38000 Grenoble, France
3
Inserm US 17 - CNRS UMS 3552 - Univ. Grenoble Alpes & CHU Grenoble, UMS IRMaGe, France
ASerrurier@ukaachen.de, pierre.badin@gipsa-lab.grenoble-inp.fr
Abstract
Speech production can be analysed in terms of universal articulatory-acoustic phonemic units shared between speakers. However, morphological differences between speakers and idiosyncratic articulatory strategies lead to large inter-speaker articulatory variability. Relationships between strategy and morphology have already been pinpointed in the literature. This study aims thus at generalising existing results on a larger database for the entire vocal tract (VT) and at quantifying phoneme-specific inter-speaker articulatory invariants. Midsagittal MRI of 11 French speakers for 62 vowels and consonants were recorded and VT contours manually edited. A procedure of normalisation of VT contours between speakers, based on the use of mean VT contours, led to an overall reduction of inter-speaker VT contours variance of 88%. On the opposite, the sagittal function (i.e. the transverse sagittal distance along the VT midline), which is the main determinant of the acoustic output, had an overall amplitude variance decrease of only 37%, suggesting that the speakers adapt their strategy to their morphology to achieve proper acoustic goals. Moreover, articulatory invariants were identified on the sagittal variance distribution along the VT as the regions with lower variability. These regions correspond to the classical places of articulation and are associated with higher acoustic sensitivity function levels.
Index Terms: MRI, vocal tract morphology, articulatory
strategy, sagittal function, acoustic sensitivity function
1.
Introduction
Speech production can be analysed in terms of articulatory-acoustic phonemic units shared by all speakers within a specific language. More than a century of phonetics studies has provided extended knowledge of the articulatory characteristics of the sounds of the world’s languages (e.g. [1], [2]), and it is widely acknowledged that phonemes may be described in terms of universal articulatory and/or acoustic features (e.g. [3] for articulatory features, or [4] for acoustic features). However, numerous studies have revealed the existence of inter-speaker articulatory variability related to morphological differences between speakers and idiosyncratic articulatory strategies ([5], [6]). It has been demonstrated that the inter-speaker variability partly corresponds to an adaptation to the morphology ([7–13]). Other studies have also emphasised the relationships between speaker’s strategy and morphology by means of articulatory normalisation ([14], [15]), multi-speaker modelling aiming to uncover the common articulatory features ([5], [16–25]), or sensitivity analysis of area function models [26]. Most of these studies however
suffer from limitations related to the small number of flesh-points measured by electro-magnetic articulography, to the absence of consonants in most cases or to the small number of speakers. The present study aims first at generalising these results, based on a larger database of entire vocal tract (VT) contours obtained for articulations produced by French speakers. We propose for this purpose an alternative normalisation method that aims at subtracting speaker-specific articulatory variability. Then, the articulatory variability along the VT is quantified and compared with acoustic sensitivity functions [27], that associate formant variations with local area function variations, to determine phoneme-specific articulatory invariants. Specifically, we expect that the inter-speaker variability would be reduced at places of articulation (in the sense of the International Phonetic Alphabet chart [28]), while it would be much larger in other regions. The data, the speaker normalisation approach and the method for the quantification of articulatory variability along the VT are presented in section 2; the results regarding articulatory variability and its distribution along the VT are detailed in section 3, before the discussion and concluding remarks of section 4.
2.
Material and method
2.1. Speakers, corpus and MRI data
In order to get the most detailed articulatory data, static MRI was used to acquire midsagittal images of speakers. Eleven French speakers (six males and five females) have been instructed to utter a corpus of 62 articulations known to be fairly representative of the French articulatory repertoire (isolated vowels [i e ε a y ø œ u o ɔ ã ɔ̃] and consonants [p t k f s ʃ m n ʁ l] in 5 symmetric vowel contexts [i e ε a u]). They have been recorded at the Grenoble MRI facility IRMaGe with Gyroscan 1.5T or Achieva 3.0T TX scanners (Philips Healthcare, Best, The Netherlands), except for one speaker recorded with a Marconi Eclipse 1.5 T scanner at ATR, Kyoto, Japan. The speakers, in supine position, were asked to sustain each articulation for several seconds (between 8 and 24 seconds, depending on the MRI scanner) without movement. During this time, at least one midsagittal MRI image covering the whole VT was acquired. More details can be found in [24].
2.2. Articulatory contours manual segmentation
Rigid structures (hard palate, jaw and hyoid bone) were edited once for each speaker and then manually aligned on each image. The contours of deformable articulators (lower and upper lips, tongue, epiglottis, velum, and naso-oropharyngeal posterior wall) were manually edited as spline curves. All
INTERSPEECH 2017
contours are visible as yellow lines on Figure 1. In addition, landmarks corresponding to anatomical and/or contour characteristic points were also manually located on each image (Figure 1, green points) to delimit the articulators. For the study, only contour sections actually contributing to the VT outline were considered (Figure 1, red dashed lines). In the following, the separate contours – either rigid or deformable – are referred to as articulatory contours and form all together the VT contours. For each speaker, the 62 sets of contours have been aligned by rototranslation on the common hard palate shape. Then, all rototranslated contours have been further aligned by another rototranslation so that the line between the Anterior and Posterior Nasal Spine landmarks (Figure 1, cyan), attached to the hard palate, is horizontal, and the lower point of the upper incisors is set at the same location for all speakers. The left panel of Figure 2 illustrates the superposition of the 11 sets of contours for phoneme /a/ after applying this alignment. Finally, the contours of each phoneme were averaged over the 11 speakers to form a new set of 62 contours, which correspond to the mean speaker.
2.3. Midsagittal articulatory contours normalisation
In the context of this study, we call speaker normalisation the process that aims to identify and remove information related to morphology and head orientation in order to retain more universal features only. Various speaker normalisation methods have been proposed in the literature ([14], [15]). We propose in this study an alternative method able to normalise speakers regarding both morphology and head orientation.
Morphology and articulatory strategies are inherently related, as speakers must adopt strategies complying with their own morphology to reach the required phonemic target articulations. We assume that a way to disentangle phoneme-specific strategies from speaker’s morphological characteristics is to rely on contours averaged over the whole set of a representative corpus for each speaker. Indeed, as the set of 62 articulations mentioned above is well balanced by design and large enough, it may be considered that average contours are free from the possible idiosyncratic articulatory strategies implemented by the speaker to achieve specific articulations, and thus reflect his/her morphology and head orientation. In this approach, the difference for each speaker between his/her mean contours and the mean contours of the mean speaker represents the marginal morphology and head orientation specific to the speaker.
The normalisation proposed in this study consists therefore in subtracting, for each speaker, this difference from all his/her contours. The residual contours may then be considered free from the contribution of the speaker’s
morphology and position. The right side panel of Figure 2 illustrates the associated strongly reduced inter-speaker variability for phoneme /a/. The normalisation will be evaluated in terms of variance reduction in the following (sections 3.1 and 3.2).
In order to characterise the main morphology and head orientation variations between speakers, removed from all contours by the normalisation presented in the previous paragraph, Principal Component Analysis (PCA) was applied to the 11 sets of the average VT contours coordinates. The first two components M1 and M2 explain respectively 64% and 24% of the variance; corresponding nomograms are illustrated in Figure 3. We observe that M1 mainly reflects horizontal and vertical scaling factors, partly related to male-female differences, as well as a palate depth factor. M2 mostly represents a rotation around the lower edge of the upper incisors much related to the head tilt [29]. The contributions of these components for each speaker have already been removed from its contours as part of the normalisation process detailed in the previous paragraph.
2.4. Sagittal function variability
Formants, that are a main acoustic characteristic of the VT, cannot be determined in a straightforward way from the VT midsagittal contours. Formants up to 5 kHz can be computed, assuming plane wave acoustic propagation, from the VT Area Function (AF), i.e. the sampling of the variations of the cross-sectional area along the VT midline in terms of elementary tube sections ([30], [31]). In turn, the AF can be determined from the Sagittal Function (SF), (i.e. the transverse sagittal distance between the upper and lower VT contours along the midline) using various versions of Heinz & Stevens’ [32] model ([33–36]). This section presents the calculation of the SF from VT contours as well as an evaluation of its inter-speaker variability.
2.4.1. Sagittal function determination
Sagittal distances are automatically estimated at equally spaced locations along the VT midline, once potential side branches (sublingual cavity, velopharyngeal port, epiglottic vallecula) have been closed in order to simplify the process (see Figure 4, top). The SF (Figure 4, bottom) is then estimated, and remaining peaks are smoothed out with a Chebyshev low-pass filter (Figure 4, bottom) to provide the SFs used in the rest of the study.
2.4.2. Sagittal function length rescaling
In order to measure the inter-speaker variability of the SF for a phoneme, the 11 SFs of this phoneme need to have the same
Figure 1: MR image of
articulation [kε] for one speaker superimposed with the contours and
landmarks.
Figure 2: VT contours for the 11 speakers
before (left) and after (right) normalisation for phoneme /a/.
Figure 3: Nomograms of the average speaker VT
contours PCA components M1-M2 with predictors varying at regular steps between the minimal and
maximal values found in the data. Contours with negative (resp. positive) predictor values are plotted
in green (resp. red).
overall length. For each phoneme, the length of the VT midline of the average speaker is thus chosen as a reference for rescaling the 11 SFs.
First, for each articulation, two anatomically remarkable anchor points are defined by their abscissas L1 and L2 along the VT midline. L1 is aligned with the junction of the tongue root and epiglottis contours, while L2 is aligned with the mean location of upper teeth and lower incisors (Figure 4, top). Then, the abscissas of the SFs of the 11 speakers are piecewise linearly rescaled (using the three sections delineated by L1 and L2) to be aligned with the corresponding sections on the SF of the average speaker. This ensures that the 11 SFs of a phoneme have all the same length, and that the rescaling approximately respects anatomical correspondences between speakers. Figure 5 illustrates results for phoneme /u/.
Figure 4: Mean contour (top) of phoneme [u]
superposed with the transverse sections of the SF and the midline; corresponding SF (bottom) before (blue) and after (red) low-pass filtering; the bold back lines
correspond to L2 and L1 (see text).
Figure 5: SF of phoneme [u] for the 11 and the mean
speakers before (top) and after (bottom) rescaling. The vertical lines correspond to L2 and L1 (see text).
Figure 6: Standard deviation of the SF before (blue)
and after (red) normalization for phoneme /u/.
2.4.3. Phoneme-specific variability distribution
For each phoneme, the inter-speaker articulatory variability is characterised by the distribution along the VT of the standard deviation (STD) calculated over the 11 rescaled SFs from glottis to lips. This variability is assessed for the 62 phonemes of the corpus, before and after the normalisation process presented in section 2.3. Figure 6 illustrates the result for one phoneme.
2.5. Acoustic sensitivity
As mentioned in the introduction, we expect the distribution of articulatory variability to be inversely related to the acoustic sensitivity, and in particular to observe lower variability at places of articulation (which are supposed to have higher acoustic sensitivity). To test this hypothesis, the acoustic sensitivities of formants F1, F2 and F3 have been calculated for each phoneme of the average speaker. For this purpose, AFs have been derived from the SFs before normalisation, using the α-β model proposed by [36]. Acoustic transfer function and formants have then been estimated, assuming plane wave propagation in the VT [37]. Note that cross-sectional areas have been limited to a minimum of 0.1 cm² in order to be able to compute wave propagation. In a second step, the formant frequency variations induced by a 10% increase of the area of each AF section have been determined. The acoustic sensitivity function of a formant is finally defined as the distribution of the absolute value of the ratio of the relative formant frequency variation over the relative area variation along the VT (see further examples in Figure 7).
3.
Results
3.1. Articulatory contour variability
As illustrated in Figure 2 for phoneme /a/, the normalisation process decreases the inter-speaker variability of the VT articulatory contours for each phoneme. The overall variance reduction of the contour coordinates ranges from 45% for the lower lip to 96% for the pharyngeal wall (and 100% for the palate by construction), with an overall reduction of 80% for the lower VT contours (lower lip, jaw, tongue and epiglottis), of 94% for the upper VT contours (upper lip, palate, velum, pharyngeal wall and back of the larynx) and of 88% all together. Besides, the standard deviation of the length of the VT midline averaged over the 62 phonemes is reduced from 1.36 cm to 0.67 cm, corresponding to a reduction of 74% of its variance. These results show that a substantial amount of the articulatory variability can be ascribed to the morphology and head position differences.
3.2. Sagittal Function amplitude variability
The standard deviation of the SF amplitude averaged over both VT and phonemes is reduced from 0.32 cm to 0.26 cm by the normalisation process, corresponding to a variance reduction of 37%. Note however that these global figures conceal a large disparity between phonemes and VT regions. Figure 6 illustrates the reduction of the standard deviation of the SF for phoneme /u/.
These global figures demonstrate that articulatory normalisation leads to a much smaller reduction of the SF variability than of the midsagittal articulatory contours variability. This means that the large amount of variability ascribed to the morphology and head position observed in the
upper and lower VT contours is compensated in order to generate acoustically relevant AFs. This suggests that speakers tend to adapt their strategy to their morphology and head orientation in order to achieve proper articulatory-acoustic goals. This is in general agreement with the results found in the literature for the palate and the front of the tongue ([8], [10], [11], [14], [15]).
3.3. Variability along the VT and articulatory invariants
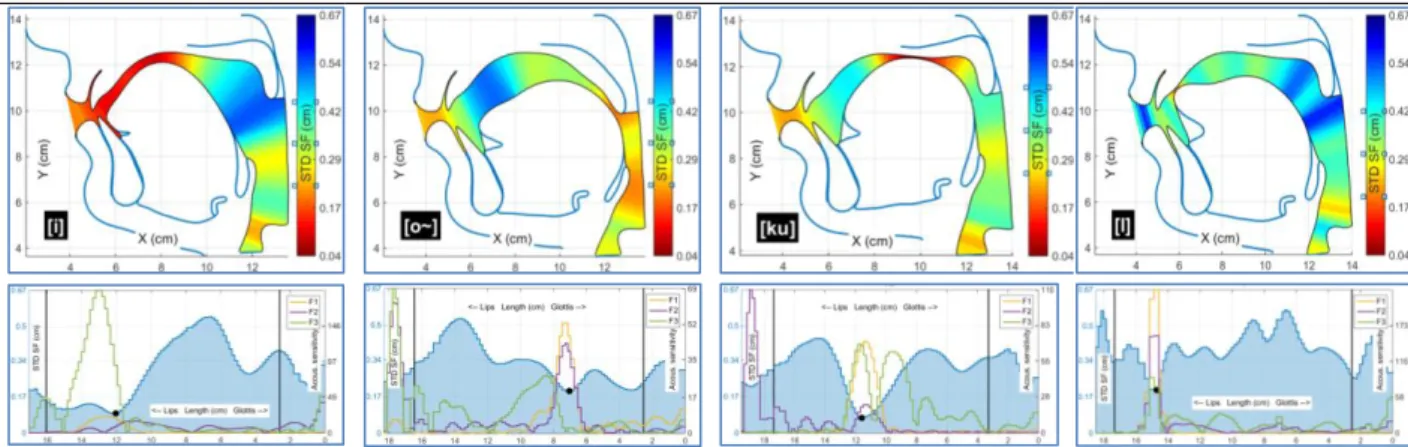
The variability along the VT represented by the standard deviation of the SF has been determined for each vowel and consonant of the corpus before normalisation (see examples in the first three columns if Figure 7). The same procedure has been extended to the case of consonants without specific context by calculating the standard deviation of the SF for the set of consonants in the 5 vowel contexts of the 11 speakers using the method described in section 2.4.3. Figure 7 (last column) illustrates results for consonant /l/. The regions with relatively low inter-speaker variability exemplified on Figure 7 are very likely critical for the realisation of speech articulatory-acoustic goals, and indeed correspond to the classical places of articulation described in the International Phonetic Alphabet chart [28]. Figure 7 (top) emphasises these locations by red colour levels inside the VT contours for a few phonemes. Interestingly, the maximal sensitivities of one or several formants are mostly associated with these regions (Figure 7, bottom), which is in agreement with [26]. These phoneme-specific regions that have emerged from the data can be considered as articulatory invariants for French.
In the Figure 7, the low variability region of articulation [i] covers most of the VT front region as measured by the rather low standard deviations (around 0.1 cm) whereas the low variability region of [ɔ̃] has higher standard deviations (around 0.2 cm) and the low variability region of [ku] appears rather narrow. Despite varying vowel contexts, the low variability region of consonant [l] appears also very localised.
4.
Discussion and conclusion
Based on complete VT midsagittal articulatory contours extracted from MRI data recorded on a set of 11 French speakers uttering a complete corpus of 62 French vowels and consonants, we have been able to measure and characterize phoneme-specific inter-speaker articulatory variability. A speaker normalisation procedure aiming at removing speaker-specific morphological features and head orientation, based on
subtraction of mean VT contours, has allowed an overall reduction of inter-speaker VT contours variance of 88%, as well as an overall VT length variance reduction of 74%. This result demonstrates that a large part of the inter-speaker variability is related to morphological and head position features and that it could be retrieved from the mean VT contour, assuming that this contour is free from the idiosyncratic strategies. Interestingly, this normalisation captures also the male/female differences; the normalised contours can therefore be considered as gender neutral. Oppositely, the SF, which is the main determinant of the acoustic output, underwent an overall amplitude variance reduction due to normalisation of 37% only, suggesting that speakers adapt their strategy to their own morphology in order to achieve acoustically relevant VT geometry and thus proper acoustic goals.
Regions corresponding to classical places of articulation can be identified through the detailed analysis of the sagittal variance distribution along the VT. They are characterised by low sagittal variability and high acoustic sensitivity, and constitute phoneme-specific articulatory invariants.
Note that the simplifications used to obtain these results (discarding side cavities, smoothing individual SFs) might have led to slightly inaccurate results. This approach should be refined. Besides, for a few phonemes, the SF variability distribution was not fully consistent with the acoustic sensitivity function, especially for consonant /ʁ/ where the velum shape can vary significantly between speakers [24]. Additional research will be necessary to improve the determination of the articulatory invariants and further analyse these inconsistencies. Future lines of follow-up research include increasing the number of speakers to strengthen the validity of the study, refining the normalisation procedure, and developing models of articulatory models in order to be able to process new speakers for whom scarce articulatory information only is available.
5.
Acknowledgements
We thank all our kind and patient speakers. We also sincerely thank J.-A. Valdés Vargas and G. Ananthakrishnan for performing the majority of the initial tracings. This work has been partially funded by the French ANR (grants ANR-08-EMER-001-02 “ARTIS”, and ANR-11-INBS-0006 “Infrastructure d’avenir en Biologie Santé”).
Figure 7: Midsagittal contours averaged over speakers (top) and standard deviations of the SF together with acoustic sensitivities
for formants F1 to F3 (bottom) for 4 phonemes (labelled in SAMPA alphabet); color inside the VT represents the amplitude of the STD of the SF; the vertical solid lines correspond to L2 and L1 and the black point to the minimum amplitude.
6.
References
[1] P. Ladefoged and I. Maddieson, The Sounds of the World’s Languages. Oxford, UK: Blackwell Publishers, 1996.
[2] I. Maddieson, Patterns of Sounds. Cambridge: Cambridge University Press, 1984.
[3] N. Chomsky and M. Halle, The sound pattern of English. New-York: Harper & Row, 1968.
[4] K. N. Stevens, Acoustic Phonetics. Cambridge, USA, London, England: The MIT Press, 1998.
[5] K. Johnson, P. Ladefoged, and M. Lindau, “Individual differences in vowel production,” The Journal of the Acoustical
Society of America, vol. 94, no. 2, pp. 701–714, 1993.
[6] P. Ladefoged and D. E. Broadbent, “Information conveyed by vowels,” The Journal of the Acoustical Society of America, vol. 29, no. 1, pp. 98–104, 1957.
[7] K. Honda, S. Maeda, M. Hashi, J. Dembowski, and J. R. Westbury, “Human palate and related structures: their articulatory consequences,” in 4th International Conference on
Spoken Language Processing, October, Philadelphia, USA, Proceedings, 1996.
[8] J. Brunner, S. Fuchs, and P. Perrier, “On the relationship between palate shape and articulatory behavior,” The Journal of
the Acoustical Society of America, vol. 125, no. 6, pp. 3936–
3949, 2009.
[9] S. Fuchs, R. Winkler, and P. Perrier, “Do Speakers’ Vocal tract geometries shape their articulatory vowel space?,” in ISSP –8th
International Seminar on Speech Production, Proceedings,
2008, pp. 333–336.
[10] K. Rudy and Y. Yunusova, “The effect of anatomic factors on tongue position variability during consonants,” Journal of
Speech, Language, and Hearing Research, vol. 56, no. 1, pp.
137–149, 2013.
[11] M. Weirich and S. Fuchs, “Palatal morphology can influence speaker-specific realizations of phonemic contrasts,” Journal of
Speech, Language, and Hearing Research, vol. 56, no. 6, pp.
S1894–S1908, 2013.
[12] M. Weirich, L. Lancia, and J. Brunner, “Inter-speaker articulatory variability during vowel-consonant-vowel sequences in twins and unrelated speakers,” The Journal of the Acoustical
Society of America, vol. 134, no. 5, pp. 3766–3780, 2013.
[13] Y. Yunusova, J. S. Rosenthal, K. Rudy, M. Baljko, and J. Daskalogiannakis, “Positional targets for lingual consonants defined using electromagnetic articulography,” The Journal of
the Acoustical Society of America, vol. 132, no. 2, pp. 1027–
1038, 2012.
[14] C. Geng and C. Mooshammer, “How to stretch and shrink vowel systems: Results from a vowel normalization procedure,” The
Journal of the Acoustical Society of America, vol. 125, no. 5, pp.
3278–3288, 2009.
[15] M. Hashi, J. R. Westbury, and K. Honda, “Vowel posture normalization,” The Journal of the Acoustical Society of
America, vol. 104, no. 4, pp. 2426–2437, 1998.
[16] G. Ananthakrishnan, P. Badin, J. A. V. Vargas, and O. Engwall, “Predicting unseen articulations from multi-speaker articulatory models,” in INTERSPEECH 2012 – 13th Annual Conference of
the International Speech Communication Association, September, Portland, USA, Proceedings, 2012.
[17] C. Geng and C. Mooshammer, “Modeling the German stress distinction,” in 5th Seminar on Speech Production: Models and
Data & CREST Workshop on Models of Speech Production: Motor Planning and Articulatory Modelling, Proceedings, 2000,
pp. 161–164.
[18] R. Harshman, P. Ladefoged, and L. Goldstein, “Factor analysis of tongue shapes,” The Journal of the Acoustical Society of
America, vol. 62, no. 3, pp. 693–707, 1977.
[19] P. Hoole, “On the lingual organization of the German vowel system,” The Journal of the Acoustical Society of America, vol. 106, no. 2, pp. 1020–1032, 1999.
[20] F. Hu, “On the lingual articulation in vowel production: case study from Ningbo Chinese,” in ISSP –7th International Seminar
on Speech Production, Proceedings, 2006.
[21] M. T. T. Jackson, “Analysis of tongue positions: language-specific and cross-linguistic models,” The Journal of the
Acoustical Society of America, vol. 84, no. 1, pp. 124–143, 1988.
[22] D. A. Nix, G. Papcun, J. Hogden, and I. Zlokarnik, “Two cross-linguistic factors underlying tongue shapes for vowels,” The
Journal of the Acoustical Society of America, vol. 99, no. 6, pp.
3707–3717, 1996.
[23] J. A. Valdés Vargas, P. Badin, and L. Lamalle, “Articulatory speaker normalisation based on MRI-data using three-way linear decomposition methods,” in INTERSPEECH 2012 – 13th Annual
Conference of the International Speech Communication Association, September, Portland, USA, Proceedings, 2012, p.
Thu.O9c.03.
[24] J. A. Valdes Vargas, “Adaptation of orofacial clones to the morphology and control strategies of target speakers for speech articulation,” Unpublished PhD report, Université Grenoble Alpes, 2013.
[25] Y. Zheng, M. Hasegawa-Johnson, and S. Pizza, “Analysis of the three-dimensional tongue shape using a three-index factor analysis model,” The Journal of the Acoustical Society of
America, vol. 113, no. 1, pp. 478–486, 2003.
[26] T. Kaburagi, “Morphological and acoustic analysis of the vocal tract using a multi-speaker volumetric MRI dataset,” in
INTERSPEECH 2015 – 16th Annual Conference of the
International Speech Communication Association, September, Dresden, Germany, Proceedings, 2015, pp. 379–383.
[27] G. Fant and S. Pauli, “Spatial characteristics of vocal tract resonance modes,” in Speech Communication Seminar,
Proceedings, 1974.
[28] Handbook of the International Phonetic Association: A Guide To
The Use Of The International Phonetic Alphabet. Cambridge
University Press, 1999.
[29] A. Serrurier and P. Badin, “A three-dimensional articulatory model of the velum and nasopharyngeal wall based on MRI and CT data,” The Journal of the Acoustical Society of America, vol. 123, no. 4, pp. 2335–2355, 2008.
[30] G. Fant, Acoustic Theory of Speech Production. The Hague: Mouton, 1960.
[31] J. L. Flanagan, Speech Analysis Synthesis and Perception. Springer-Verlag, Berlin, Heidelberg, New-York, 1972. [32] J. M. Heinz and K. N. Stevens, “On the relations between lateral
cineradiographs area functions, and acoustic spectra of speech,” in 5th International Congress on Acoustics, Proceedings, 1965,
p. A44.
[33] D. Beautemps, P. Badin, and R. Laboissière, “Deriving vocal-tract area functions from midsagittal profiles and formant frequencies: A new model for vowels and fricative consonants based on experimental data,” Speech Communication, vol. 16, no. 1, pp. 27–47, 1995.
[34] P. H. Milenkovic, S. Yaddanapudi, H. K. Vorperian, and R. D. Kent, “Effects of a curved vocal tract with grid-generated tongue profile on low-order formants,” The Journal of the Acoustical
Society of America, vol. 127, no. 2, pp. 1002–1013, 2010.
[35] P. Perrier, L.-J. Boë, and R. Sock, “Vocal tract area function estimation from midsagittal dimensions with CT scans and a vocal tract cast: modeling the transition with two sets of coefficient,” Journal of Speech and Hearing Research, vol. 35, no. 1, pp. 53–67, 1992.
[36] A. Soquet, V. Lecuit, T. Metens, and D. Demolin, “Mid-sagittal cut to area function transformations: Direct measurements of mid-sagittal distance and area with MRI,” Speech
Communication, vol. 36, no. 3–4, pp. 169–180, 2002.
[37] P. Badin and G. Fant, “Notes on vocal tract computation,”
Speech Transmission Laboratory - Quarterly Progress and Status Report - Stockholm, Sweden, vol. 25, no. 2–3, pp. 53–108,
![Figure 1: MR image of articulation [k ε ] for one](https://thumb-eu.123doks.com/thumbv2/123doknet/14345584.499952/3.892.74.804.890.1118/figure-mr-image-articulation-k-ε.webp)
![Figure 4: Mean contour (top) of phoneme [u]](https://thumb-eu.123doks.com/thumbv2/123doknet/14345584.499952/4.892.140.371.343.567/figure-mean-contour-phoneme-u.webp)