HAL Id: hal-02087987
https://hal.archives-ouvertes.fr/hal-02087987v2
Submitted on 9 May 2019
HAL is a multi-disciplinary open access
archive for the deposit and dissemination of
sci-entific research documents, whether they are
pub-lished or not. The documents may come from
teaching and research institutions in France or
abroad, or from public or private research centers.
L’archive ouverte pluridisciplinaire HAL, est
destinée au dépôt et à la diffusion de documents
scientifiques de niveau recherche, publiés ou non,
émanant des établissements d’enseignement et de
recherche français ou étrangers, des laboratoires
publics ou privés.
Mapping the structural diversity of C60 carbon clusters
and their infrared response
Clement Dubosq, Cyril Falvo, Florent Calvo, M. Rapacioli, Pascal Parneix,
Thomas Pino, Aude Simon
To cite this version:
Clement Dubosq, Cyril Falvo, Florent Calvo, M. Rapacioli, Pascal Parneix, et al.. Mapping the
structural diversity of C60 carbon clusters and their infrared response. Astronomy and Astrophysics
- A&A, EDP Sciences, 2019, 625, pp.L11. �10.1051/0004-6361/201834943�. �hal-02087987v2�
May 7, 2019
Letter to the Editor
Mapping the structural diversity of C
60
carbon clusters and their
infrared spectra
C. Dubosq,
1C. Falvo,
2, 3F. Calvo,
3M. Rapacioli,
1P. Parneix,
2T. Pino,
2A. Simon
?11
Laboratoire de Chimie et Physique Quantiques LCPQ/IRSAMC, Université de Toulouse and CNRS, UT3-Paul Sabatier, 118 Route de Narbonne, F-31062 Toulouse, France
2
Institut des Sciences Moléculaires d’Orsay (ISMO), CNRS, Univ. Paris Sud, Université Paris-Saclay, 91405 Orsay, France
3 Univ. Grenoble Alpes, CNRS, LIPhy, 38000 Grenoble, France
Received ?; accepted ?
ABSTRACT
The current debate about the nature of the carbonaceous material carrying the infrared (IR) emission spectra of plan-etary and proto-planplan-etary nebulae, including the broad plateaus, calls for further studies on the interplay between structure and spectroscopy of carbon-based compounds of astrophysical interest. The recent observation of C60
buck-minsterfullerene in space suggests that carbon clusters of similar size may also be relevant. In the present work, broad statistical samples of C60isomers were computationally determined without any bias using a reactive force field, their
IR spectra being subsequently obtained following local optimization with the density-functional-based tight-binding theory. Structural analysis reveals four main structural families identified as cages, planar polycyclic aromatics, pret-zels, and branched. Comparison with available astronomical spectra indicates that only the cage family could contribute to the plateau observed in the 6–9 µm region. The present framework shows great promise to explore and relate struc-tural and spectroscopic features in more diverse and possibly hydrogenated carbonaceous compounds, in relation with astronomical observations.
Key words. Astrochemistry — ISM: dust — ISM: lines and bands — Infrared:ISM — Molecular processes
1. Introduction
Buckminsterfullerene (C60) has recently been identified in
space (Cami et al. 2010; Sellgren et al. 2010). Although recent observational studies suggest that fullerenes could be produced by photochemical dehydrogenation and iso-merization of amorphous carbon grains (García-Hernández et al. 2010, 2011b,a, 2012), the composition of these grains is still debated. Infrared (IR) spectroscopic obser-vations of fullerene-rich planetary nebulae (PNe) found a broad plateau with substructure at 6–9 µm range (García-Hernández et al. 2010, 2011b,a, 2012; Bernard-Salas et al. 2012). The origin of this plateau remains elusive and var-ious hypotheses have been formulated about its possible carriers, including hydrogenated amorphous carbon (HAC) compounds (Bernard-Salas et al. 2012), very small grains, or polycyclic aromatic hydrocarbon (PAH) clusters (Tielens 2008; Buss et al. 1993; Rapacioli et al. 2005). Similarly, the 8 and 12 µm plateau features of some proto-planetary neb-ulae (PPNe) were assigned to the vibrations of alkanes or alkyle side groups pertaining to large carbonaceous parti-cles (Kwok et al. 2001; Hrivnak et al. 2000), whose details also remain unclear.
These observations and their various interpretations have motivated further studies to unravel the molecular na-ture of the carriers of these spectral feana-tures. The present
Send offprint requests to:
e-mail: aude.simon@irsamc.ups-tlse.fr
letter describes a purely computational framework designed to systematically and extensively explore the structural di-versity of C60 isomers in a statistically unbiased way and
to relate the various isomers obtained to their IR spectral features. Sorting these isomers using appropriate order pa-rameters, our mapping provides unprecedented correlations between structure and spectroscopy in astrochemically rel-evant compounds. This study also brings indirect insight into the possible precursors of stable fullerenes under as-trophysical environments, whose formation in circumstel-lar environments of carbon-rich evolved stars is somewhat puzzling (Bernard-Salas et al. 2012). Two main routes to-wards such highly organized molecules have been proposed in the literature, consisting of either the successive growth from smaller carbon chain building blocks, known as the closed network growth mechanism (Dunk et al. 2012), or alternatively the decay and rearrangement of larger carbon grains or dehydrogenated PAHs (Berné et al. 2015) under the action of ultraviolet photons (Zhen et al. 2014) or by collisions with energetic particles (Omont 2016). These so-called bottom-up and top-down mechanisms are expected to prevail in the hot, dense envelopes of evolved stars and in low-density environments such as interstellar clouds, re-spectively (Berné & Tielens 2012).
The letter is organized as follows. In Section 2, we briefly describe the computational approach. In Section 3 we an-alyze the structural diversity of C60, the classification into
four main families of isomers, and the relation with IR
A&A proofs: manuscript no. 34943corr
tures. In Section 4 we discuss the possible contribution of these families to some features of astronomical spectra for selected PNe and PPNe. Finally, we make some concluding remarks in Section 5.
2. Computational details
Following the simulation protocol recently described in Bonnin et al. (2019), a systematic and unbiased search for isomers of C60 was computationally undertaken using the
efficient but realistic reactive empirical bond order (REBO) force field (Brenner et al. 2002). Replica-exchange molecu-lar dynamics (REMD) simulations were performed in the 2500–6500 K temperature range using 16 trajectories, the temperatures being allocated in a 12-member geometric se-ries with four extra temperatures around the C60 melting
temperature (Kim & Tománek 1994). All replicas were ini-tiated from the buckminsterfullerene global minimum. The use of high temperatures and the REMD framework en-sures that the sample is not biased towards this starting point. The trajectories were integrated over 100 ns using a time step of 0.1 fs, and configurations were periodically saved and locally reoptimized. Spherical boundary condi-tions were used and the density was varied over four differ-ent simulations with ρ = 0.025, 0.15, 0.4, and 1.7 g.cm−3. Dissociated structures corresponding to a threshold dis-tance greater than 1.85 Å were excluded. This unbiased sampling stage produced 656 438 nonequivalent isomers.
While REBO provides a reasonable description of in-tramolecular forces in carbon nanostructures, it lacks electrostatics and cannot provide vibrational spectra. In-stead we used the self-consistent charge (SCC) density-functional-based tight-binding (DFTB) method employing the mio set of parameters (Elstner et al. 1998) with ad-ditional dispersion corrections (Rapacioli et al. 2009). Al-though significantly more expensive than REBO, the SCC-DFTB approach remains computationally efficient owing to approximations and pre-computed pair integrals. It was previously employed successfully to determine structural (Zheng et al. 2005; Yen & Lai 2015; Witek et al. 2006; Mal-olepsza et al. 2007), spectroscopic (Joalland et al. 2010; Si-mon et al. 2017a, 2012; SiSi-mon & Spiegelman 2013b,a), and fragmentation (Simon et al. 2017b, 2018; Rapacioli et al. 2018) properties of PAH molecules and oligomers of astro-physical interest under various charge and energy states, at and away from equilibrium. The formation of PAHs or carbon clusters (Saha et al. 2009, 2010) and their hydrogen uptake capability (Dominguez-Gutierrez et al. 2018) were also scrutinized.
Reoptimization of the REBO isomers produced 309 168 independent structures at the SCC-DFTB level of theory, for which the IR absorption spectra were computed in the double harmonic approximation. The raw vibrational fre-quencies obtained with SCC-DFTB were scaled to match the best reference data (see Appendix A). Owing to this dependence of the scaling factors on the frequency domain, a discontinuity arises near 6.0 µm, preventing an accurate analysis of the [5.8-6.2 µm] domain.
All REBO simulations were performed using the LAMMPS software package (Plimpton 1995); the SCC-DFTB calculations were carried out with the deMonNano software package (Heine et al. 2009).
3. Structural partitioning
The structural properties of our sample of isomers were re-vealed by employing a reduced number of parameters that characterize features at different scales. In addition to the SCC-DFTB energy, we considered the shape of the individ-ual isomers through the radius of gyration rgand the
Hill-Wheeler asphericity parameter β (Hill & Hill-Wheeler 1953). The radius of gyration rgmeasures the spatial extension of
the isomer, while β < 1 measures deviations to the perfect sphere for which β = 0. As is shown below, the Hill-Wheeler parameters, previously used to characterize the shape of metallic clusters (Calvo et al. 2000), appear to be quite sensitive for carbon compounds as well.
Local ordering in the carbon clusters was examined from their hybridization level. From the SCC-DFTB electronic density matrix, Mayer’s bond orders (Mayer 1983) were computed and bonds placed accordingly when the bond or-der was higher than 0.8. A carbon atom with a coordination number of n + 1 is attributed to a spn hybridization level. For a given isomer, the fraction of sp2atoms averaged over
all atoms was assigned as the main local order parameter to measure the extent of sp2 hybridization.
A last discriminatory parameter, which can be seen as a semi-local or semi-global index, is the number of 6-member rings within each isomer. This quantity is related to the ex-tent of connectivity within the structure, and can also dif-ferentiate isomers with large aromatic domains from those exhibiting topological defects. Figure 1 shows how the var-ious order parameters are distributed among the 3 × 10⁵
isomers. Among the five parameters considered, the frac-tion of sp2 atoms and the asphericity β are found to best
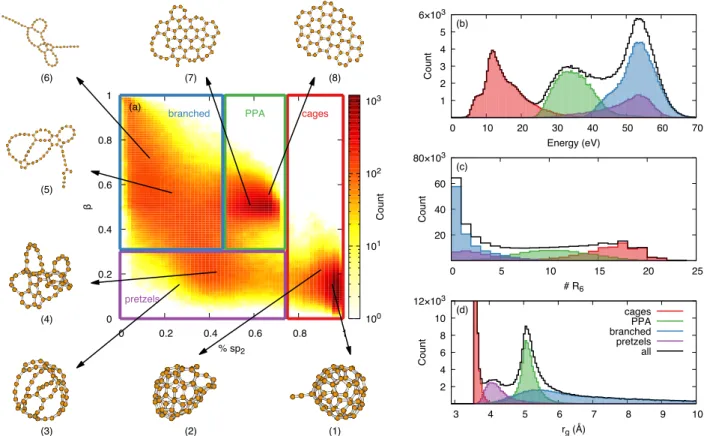
classify the various isomers into structural families. Four such families are identified, all fitting into rectangular boxes in Fig. 1(a). Each family has generally clear signatures as well-defined peaks in the one-dimensional distributions of Figs. 1(b-d) as a function of energy, number of 6-member cycles, and gyration radius, respectively.
The first family, which is thermodynamically the most stable (lowest energies), is defined by isomers with the high-est fraction of sp2atoms (above 75%). They generally show a high spherical character (low β). These isomers also have the highest number of 6-member rings but the lowest gy-ration radius (3.7 Å), indicating a rather compact shape. These 8.2×10⁴ isomers, known as cages, include
buckmin-sterfullerene as their most remarkable member, as well as defective fullerenes such as structure (2) in Fig. 1 (a).
In order of increasing energy, the second family con-sists of intermediate fractions of sp2 atoms between 45%
and 75%, and an asphericity parameter β higher than 0.3. These isomers exhibit clear peaks in the energy and gyra-tion radius distribugyra-tions, and once resolved they also show intermediate values in the number of 6-member rings. This family, classified as flakes or PPAs, contains 7.7×10⁴ mem-bers.
One minor peak in the gyration radius distribution near 4 Å points at a specific family with rather compact struc-tures, correlated with low asphericity but a more arbitrary sp2 fraction (still lower than 75%). This third family is
de-fined in the two-dimensional distribution from β < 0.3, and includes rather spherical but fairly open structures with many carbon chains. Following Kim & Tománek (1994) we classify the 3.8×10⁴ members of this family as pretzels.
0 0.2 0.4 0.6 0.8 1 % sp2 0 0.2 0.4 0.6 0.8 1 β 100 101 102 103 Count (a) cages PPA pretzels branched 1 2 3 4 5 6×10³ 0 10 20 30 40 50 60 70 (b) Count Energy (eV) 20 40 60 80×103 0 5 10 15 20 25 (c) Count # R6 2 4 6 8 10 12×103 3 4 5 6 7 8 9 10 (d) Count rg (Å) cages PPA branched pretzels all (1) (2) (3) (4) (5) (6) (7) (8)
Fig. 1: Distributions of the samples of isomers based on specific order parameters. (a) Two-dimensional distribution as a function of the sp2 fraction and asphericity β. Panels (b), (c), and (d) show the one-dimensional distributions as a function of isomer energy, number of 6-member cycles, and gyration radius, respectively. In panel (a) the boxes classify the four structural families, cage, planar polycyclic aromatic (PPA), pretzel, and branched; the same colors are used in panels (b-d). Two example structures (numbered 1-8) are shown for each family.
Finally, all the remaining isomers lie in the range of
β > 0.3 and with a sp2 fraction lower than 45%. They are
associated with the highest energies, the lowest number of 6-member rings, but the highest gyration radius, whose dis-tribution is particularly broad. They usually contain multi-ple linear chains connected at a limited subset of atoms. This family is broadly referred to as made of branched structures, which are found in numbers of 1.1×10⁵.
Selected isomers are depicted in Fig. 1 to further illus-trate the terminology employed above. For each family, the statistically averaged values of all five energetic or struc-tural parameters was determined, and the Euclidean dis-tance of each member of the family to this five-dimensional point calculated. The member having the lowest distance was identified as a most representative isomer of the fam-ily, without any bias from human judgment. The structures numbered (1), (4), (5), and (7) in Fig. 1 are the statistically most representative isomers. For each family another iso-mer was chosen to further illustrate the structural diversity within the families. These isomers are numbered (2), (3), (6), and (8).
The structural diversity found by exploring the poten-tial energy surface of C60 suggests an equally diverse set
of rearrangement pathways towards fullerenes. In addition to amorphous (Sinitsa et al. 2017) and PPA (Berné et al. 2015) intermediates, linear carbon chains, as already iden-tified in circumstellar environments (Bernath et al. 1989; Hinkle et al. 1988), could also play a role by forming pretzel or branched structures also identified here at higher
ener-gies. In view of their possible spectroscopic detection, it is important to now determine their infrared signature.
4. IR spectra in comparison with astronomical data
In the absence of clear information about the underlying thermodynamics under PNe and PPNe conditions, uniform populations were chosen to reconstruct the typical IR spec-tra of the four structural families from the individual con-tributions of each member. Such uniform discon-tributions are an oversimplification of the energetics, although Fig. 1 in-dicates that cages, PPAs, and branched structures poorly overlap with each other in this respect. By summing over thousands of individual topologically distinct conformers, the spectra are necessarily broad and cannot account for sharp bands, which originate from very abundant specific structures and that must be assigned using more traditional approaches. For comparison with astronomical data, the IR absorption intensities were further convoluted by a Planck blackbody radiation law at 400 K, as proposed earlier by Draine and Li (Draine & Li 2001). The four spectra thus determined for the four families are shown in the bottom part of Fig. 2.
All families exhibit features below 6 µm, although sig-nificantly attenuated by the convolution with the Planck law for the cages population. These lines involve sp1
car-bons found in surface (cages) or edge (PPA) defects, and long loops and linear chains (pretzels and branched). The terminating chains, in particular, display a strong absorp-tion near 4.7 µm. While such isomers exist among the cage
A&A proofs: manuscript no. 34943corr 0 2 4 6 8 10 12 14 5 10 15 20 2500 2000 1500 1000 750 500 Fν (arb. units) Wavelength (µm) Wavenumber (cm-1) Tc 1 SMC 16 SMC 24 cages PPA pretzels branched
Fig. 2: Spitzer astronomical data observed for the Tc 1 and SMP SMC 16 (García-Hernández et al. 2010) and SMP SMC 24 (García-Hernández et al. 2011a) planetary nebulae (black curves) and IR spectra calculated for the cages, PPAs, pretzels, and branched structures families (red, green, purple, and blue curves, respectively). The four vertical lines mark the IR active lines of buckminster-fullerene (Krätschmer et al. 1990)
[see, e.g., Fig. 1(1)] and PPA [see, e.g., Fig. 1(7)] popula-tions, they are far more numerous in more open structures such as the pretzel and the branched families, for which this peak is even more intense and doubled with another feature at 5.1 µm.
Above 6 µm the spectral features are due to the CC stretching of sp2 carbons involved in multiple 5-, 6-, or 7-member rings. The corresponding active spectral region is broad and overlaps with the range where CCC in-plane bending modes are found near 10.5–12.5 µm. These features are most prominent for cages, for which the averaged spec-trum exhibits a broad band between 6.2 and 11.6 µm with a sharp blue tail, a smooth red tail, and a sharper maximum near 6.6–7.9 µm. Smaller peaks near 8.9 and 10.3 µm are caused by CC stretchings, while the band near 12.5 µm is assigned to in-plane CCC bending modes leading to some rotation of the rings. Bands located above 14 µm
corre-spond to softer deformations of the carbon skeleton with a more collective character. The accuracy of these lines is dis-putable at the present level of theory (see Appendix A.2, Table A.1), and the narrow intense band appearing near 15.7 µm should actually be shifted by +1.2 µm.
The IR spectrum obtained for the PPA family shows a very broad band extending from 6.4 to 13.3 µm, with max-ima at 7.4, 9.5, and 10.8 µm. These features are the signa-ture of CC stretching modes that also increasingly combine with CCC bending modes as the wavelength increases. Two bands near 16.4 and 21.9 µm are assigned to in-plane and out-of-plane deformation modes, respectively.
Compared with cages and PPA isomers, the spectrum of the pretzel isomers above 6 µm displays fewer bands except broad maxima near 7.3 and 15.3 µm that we assign to CC stretchings and in-plane bendings, respectively. The much greater structural diversity among this population explains why these modes are associated with broader bands.
Finally, the spectrum of the branched family exhibits an active region in the 6.4–9.6 µm range, but hardly any feature above this range. The maxima at 7.3 and 8.6 µm are assigned to CC stretches coupled to in-plane CCC bending modes involving sp2 carbons that pertain both to small
rings and long loops or linear chains.
These spectra can now be compared to astronomical ob-servations recorded in C-rich and H-rich PNes of the Small Magellanic Cloud (SMC), where fullerenes and PAHs have both been detected (García-Hernández et al. 2010) and where plateaus in the spectra have remained unassigned. The emission features in SMP SMC 16 found in the 6-9 µm and 15-20 µm ranges possibly match those found for the cage population, given that the band calculated at 15.7 µm should be shifted by about +1.2 µm. However, the contri-bution of cages to the 10-13 µm plateau is questionable, as is the presence of PPA structures, whose spectral fea-ture near 6-10 µm is much broader than the observed data, with no remarkable feature in the 10-13 µm range either. Similarly, pretzel isomers cannot explain the astronomical data for this PNe. In contrast, we find some similarities in the spectrum of the branched family near 6-9 µm, and es-pecially its peak at 8.6 µm. However, the branched family spectrum shows no feature above 10-13 µm, in contradiction with observations.
Comparing now the calculated spectra with the astro-nomical observations of the Tc 1 PNe where C60 and C70
were detected (Cami et al. 2010), the most stable cage pop-ulation may also contribute to the same regions as for SMP-SMC 16, but cannot account for the very intense 10–13 µm plateau. The contribution of the other families must proba-bly be excluded as they are too dissimilar with astronomical data for this PNe.
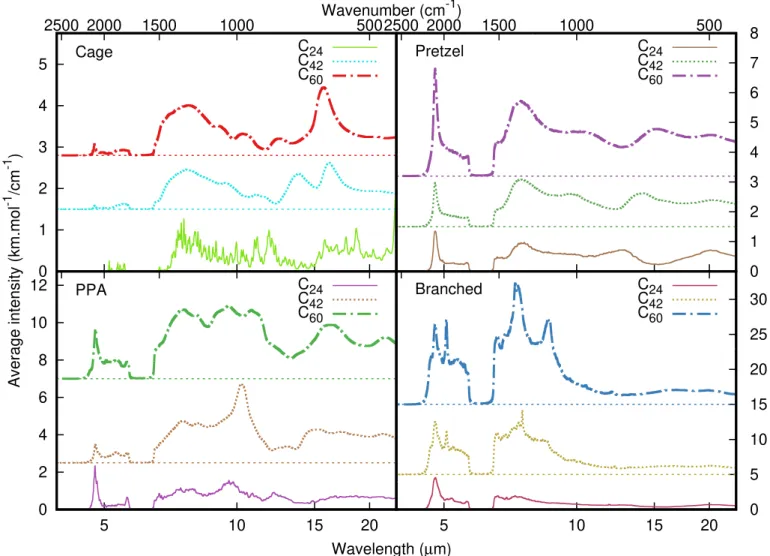
Comparison can also be made for the spectrum of SMP SMC 24, which was suggested as being due to a com-plex mixture of aliphatic and aromatic compounds such as HACs, PAH clusters, fullerenes, and small dehydrogenated carbon clusters (García-Hernández et al. 2011a). As was the case for SMP-SMC 16, only the cage family is compatible as a potential contributor to the features near 6–9 µm and 15– 20 µm. The spectra obtained for the cationic case of C+60 show essentially no change relative to the neutral system (see Appendix B, Fig. B.1). None of the studied families can account for the 10–13 µm feature. However, additional calculations on smaller carbon clusters C24 and C42 show
that their corresponding cage families possess more intense
features in the 10-15 µm domain than C60, relative to the
6-9 µm region (see Appendix C, Fig. C.1 top left panel). Two bands are observed in the spectrum of C24 in the
10-13 µm range (11.1 µm and 11.8 µm) plus a weaker feature near 12.7-13.3 µm. The spectrum of C42 presents a weak
band in the 10.7-12.2 µm range plus a wide intense band centered at 13.7 µm. These smaller cages could then also be considered as potential contributors to the 10–15 µm astro-nomical features. The C24size is all the more interesting as
it possesses features in the 15–20 µm range (15.8, 16.8, 17.6, and 18.6 µm at our level of calculation) that are observed in SMC 16 and 24. The present theoretical study provid-ing the IR signature of cage populations for 24, 42, and 60 carbon atoms thus complements recent density-functional-theory (DFT) investigations suggesting the possible indi-vidual contribution of closed cage fullerenes smaller than C60to the IR spectra of fullerene-PNe (Adjizian et al. 2016;
Candian et al. 2019).
Finally, emission spectra of proto-planetary nebulae that represent the short evolutionary phase between AGB stars and PNe are also worth considering in our comparison, and here we take the example of the PPN IRAS 22272+5435 whose spectrum can be found in Fig. 3 of Kwok et al. (2001). Interestingly, no intense band is observed at 4.7 µm, which discards compounds with long carbon chains such as pret-zels or members of the branched family. The features near 8 and 12 µm that were assigned to the vibrations of alkanes or alkyle side groups pertaining to large carbonaceous par-ticles (Kwok et al. 2001) have no direct counterpart on our spectra. However, the shape of the 5-8 µm feature reported by Kwok et al. (2001) is consistent with the spectrum ob-tained here for the cages population. Moreover, other fea-tures such as the intense band near 17 µm are not observed in PPNe. As was the case for PNe, it is plausible that for such PPNe the hydrogenation state plays an important role in these IR features.
5. Conclusions
Fullerenes identified in space necessarily originate from complex chemical rearrangements that proceed either by growing smaller scale species, or by reducing larger com-pounds until these aromatic cages with enhanced stability are formed. To unravel the possible intermediates in these rearrangements through their vibrational IR response, and without assuming any specific formation mechanism, we have attempted to systematically sample the possible iso-mers that a connected set of 60 carbon atoms can exhibit. The conformational landscape could be efficiently explored by combining REMD simulations employing the REBO po-tential, followed by systematic reoptimization and IR char-acterization using the more accurate SCC-DFTB method.
Different energetic, structural and electronic parameters allowed the 3 × 10⁵ structures obtained to be partitioned into four main families called cages, planar polycyclic aro-matics, pretzels, and branched. The IR spectra of these fam-ilies exhibit significant differences from each other, which in turn could be exploited to get insight into their potential presence in planetary and proto-planetary nebulae. Com-parison between calculated and astronomical spectra gen-erally indicates that neutral or cationic cage isomers could account for the 6–9 µm plateau, possibly suggestive of defec-tive fullerenes in these environments. Smaller cage carbon clusters could also contribute. In contrast, more disordered
structures containing long carbon loops or a greater number of linear chains are less likely, all the more as the intense IR feature found for these pretzel and branched families near 4.7 µm has not been observed in PNe and PPNe.
The main limitation of our model is that only a sin-gle cluster size and stoichiometry were considered, with-out thermodynamical consideration within the isomer pop-ulations. Such important extensions are relatively straight-forward to carry out using the present methodology, pro-vided that the potential energy surfaces and IR spectra can be determined at a similar, reasonable computational cost. However, the large amount of associated data might require more robust analysis tools. In future developments, the con-tributions of hydrogen or other heteroatoms, different sizes and charge states, as well as anharmonicities, will be ex-plored in order to help identify the structural patterns re-sponsible for the as-yet-unexplained astronomical spectral features of PNe, notably in the 9-13 µm region. This work and its future developments will be of great importance to interpreting the IR spectra of carbon-rich PPNe and PNe soon to be observed by the James Webb Space Telescope.
Acknowledgements. The authors gratefully acknowledge financial
support by the Agence Nationale de la Recherche (ANR) Grant No. ANR-16-CE29-0025, and the GDR EMIE 3533. The authors also ac-knowledge the computing mesocenter CALMIP (UMS CNRS 3667) for the generous allocation of computer resources (p0059) and Dr. D.A. García Hernández for discussions related to the astrophysical relevance of this work.
References
Adjizian, J.-J., Vlandas, A., Rio, J., Charlier, J.-C., & Ewels, C. P. 2016, Phil. Trans. R. Soc. A, 374, 20150323
Bernard-Salas, J., Cami, J., Peeters, E., et al. 2012, ApJ, 757, 41 Bernath, P. F., Hinkle, K. H., & Keady, J. J. 1989, Science, 244, 562 Berné, O., Montillaud, J., & Joblin, C. 2015, A&A, 577, A133 Berné, O. & Tielens, A. G. G. M. 2012, Proc. Natl. Acad. Sci. U.S.A.,
109, 401
Bonnin, M. A., Falvo, C., Calvo, F., Pino, T., & Parneix, P. 2019, Phys. Rev. A, in press
Brenner, D. W., Shenderova, O. A., Harrison, J. A., et al. 2002, J. Phys. Cond. Matt., 14, 783
Buss, R. H., J., Tielens, A. G. G. M., Cohen, M., et al. 1993, ApJ, 415, 250
Calvo, F., Tran, S., Blundell, S. A., Guet, C., & Spiegelman, F. 2000, Phys. Rev. B, 62, 10394
Cami, J., Bernard-Salas, J., Peeters, E., & Malek, S. E. 2010, Science, 329, 1180
Candian, A., Gomes Rachid, M., MacIsaac, H., et al. 2019, MNRAS, 485, 1137
Dominguez-Gutierrez, F. J., Krstic, P. S., Irle, S., & Cabrera-Trujillo, R. 2018, Carbon, 134, 189
Draine, B. T. & Li, A. 2001, ApJ, 551, 807
Dunk, P. W., Kaiser, N. K., Hendrickson, C. L., et al. 2012, Nature Comm., 3, 855
Elstner, M., Porezag, D., Jungnickel, G., et al. 1998, Phys. Rev. B, 58, 7260
Frisch, M. J., Trucks, G. W., Schlegel, H. B., et al. 2009, Gaussian09 Revision A.1, Gaussian Inc. Wallingford CT 2009
García-Hernández, D. A., Iglesias-Groth, S., Acosta-Pulido, J. A., et al. 2011a, ApJ, 737, L30
García-Hernández, D. A., Kameswara Rao, N., & Lambert, D. L. 2011b, ApJ, 729, 126
García-Hernández, D. A., Manchado, A., García-Lario, P., et al. 2010, ApJ, 724, L39
García-Hernández, D. A., Villaver, E., García-Lario, P., et al. 2012, ApJ, 760, 107
Heine, T., Rapacioli, M., Patchkovskii, S., et al. 2009, deMonNano, http://demon-nano.ups-tlse.fr/
Hill, D. L. & Wheeler, J. A. 1953, Phys. Rev., 89, 1102
Hinkle, K. W., Keady, J. J., & Bernath, P. F. 1988, Science, 241, 1319 Hrivnak, B., Volk, K., & Kwok, S. 2000, ApJ, 535, 275
A&A proofs: manuscript no. 34943corr Jensen, F. 2001, J. Chem. Phys., 115, 9113
Joalland, B., Rapacioli, M., Simon, A., et al. 2010, J. Phys. Chem. A, 114, 5846
Kim, S. G. & Tománek, D. 1994, Phys. Rev. Lett., 72, 2418
Krätschmer, W., Lamb, L. D., Fostiropoulos, K., & Huffman, D. R. 1990, Nature, 347, 354
Kwok, S., Volk, K., & Bernath, P. 2001, ApJ, 554, L87
Laury, M. L., Carlson, M. J., & Wilson, A. K. 2012, J. Comput. Chem., 33, 2380
Malolepsza, E., Witek, H. A., & Irle, S. 2007, J. Phys. Chem. A, 111, 6649
Mayer, I. 1983, Chem. Phys. Lett., 97, 270 Omont, A. 2016, A&A, 590, A52
Plimpton, S. 1995, J. Comp. Phys., 117, 1
Rapacioli, M., Cazaux, S., Foley, N., et al. 2018, Phys. Chem. Chem. Phys., 20, 22427
Rapacioli, M., Joblin, C., & Boissel, P. 2005, A&A, 429, 193 Rapacioli, M., Spiegelman, F., Talbi, D., et al. 2009, J. Chem. Phys.,
130, 244304
Saha, B., Irle, S., & Morokuma, K. 2010, J. Chem. Phys., 132, 224303 Saha, B., Shindo, S., Irle, S., & Morokuma, K. 2009, ACS Nano, 3,
2241
Sellgren, K., Werner, M. W., Ingalls, J. G., et al. 2010, ApJ, 722, L54 Simon, A., Champeaux, J. P., Rapacioli, M., et al. 2018, Theo. Chem.
Acc., 137, 106
Simon, A., Noble, J. A., Rouaut, G., et al. 2017a, Phys. Chem. Chem. Phys., 19, 8516
Simon, A., Rapacioli, M., Mascetti, J., & Spiegelman, F. 2012, Phys. Chem. Chem. Phys., 14, 6771
Simon, A., Rapacioli, M., Rouaut, G., Trinquier, G., & Gadéa, F. X. 2017b, Phil. Trans. Roy. Soc. A, 375, 20160195
Simon, A. & Spiegelman, F. 2013a, Comput. Theor. Chem., 1021, 54 Simon, A. & Spiegelman, F. 2013b, J. Chem. Phys., 138, 194309 Sinitsa, A. S., Lebedeva, I. V., Popov, A. M., & Knizhnik, A. A. 2017,
J. Phys. Chem. C, 121, 13396 Tielens, A. 2008, ARA&A, 46, 289
Witek, H. A., Irle, S., Zheng, G., de Jong, W. A., & Morokuma, K. 2006, J. Chem. Phys., 125, 214706
Yen, T. W. & Lai, S. K. 2015, J. Chem. Phys., 142, 084313
Zhen, J., Castellanos, P., Paardekooper, D. M., Linnartz, H., & Tie-lens, A. G. G. M. 2014, ApJ, 797, L30
Zheng, G., Irle, S., & Morokuma, K. 2005, Chem. Phys. Lett., 412, 210
Appendix A: Benchmark of IR spectra and
correction factors
Appendix A.1: Systematic determination of correction factors
The vibrational modes of carbon clusters are poorly known, except for a few exceptions such as buckminsterfullerene. Here we use density-functional theory with the B3LYP functional and the pc-1 basis set (Jensen 2001) as the ref-erence method. Given that this approach is not exact, all frequencies obtained with it are scaled by the appropriate factor of 0.973 (Laury et al. 2012).
A sample of 50 isomers of C24 were chosen
ran-domly among those reported in the work by Bonnin et al. (2019). Each isomer was locally reoptimized at the DFT/B3LYP/pc-1 level of theory, the normal modes be-ing determined by standard diagonalization of the mass-weighted Hessian matrix. DFT calculations were performed with the Gaussian09 suite of programs (Frisch et al. 2009). This was not achieved for C60 isomers due to the too high
computational cost at the DFT level. However, the pecu-liar but well known buckminsterfullerene isomer of C60was
added to the sample. Correlations between the frequencies obtained with the two methods (DFTB and DFT) can be seen for a subset of particularly active modes in Fig. A.1.
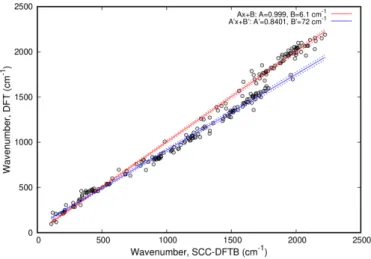
Fig. A.1: Harmonic line positions obtained at the DFT/B3LYP/pc-1 level of theory against the correspond-ing values with the SCC-DFTB method, for a sample of IR active modes from 51 isomers. The dotted lines above and below the main lines illustrate the corresponding un-certainties on each of the linear least-squares fits.
This correlation plot displays two main linear regions, depending on whether the active mode lies below 1750 cm−1 or above this approximate threshold. The DFT frequencies are recovered from SCC-DFTB frequencies if linear rela-tionships of the type
σDFT= AσDFTB+ B
are used in the corresponding ranges.
Least-squares fitting procedures readily provide the fol-lowing values for the linear coefficients, namely
A = 0.8401 ± 0.0080 and B = 72 ± 10 cm−1
for σDFT< 1750 cm−1, and
A = 0.9990 ± 0.0061 and B = 6.1 ± 9.3 cm−1
for σDFT > 1750 cm−1.
From the knowledge of the DFTB values, the IR band positions used for comparison with astronomical spectra were determined using these linear relations, and further scaled by 0.973. For the sake of clarity, the uncertainty on the determined correction factors also shown in Fig. A.1 was not applied to the spectra of Fig. 2.
Appendix A.2: Assessment of linear corrections on
buckminsterfullerene and fully dehydrogenated coronene
The IR active modes of icosahedral C60
(buckminster-fullerene) and D6hfully dehydrogenated coronene C24were
determined with the SCC-DFTB and DFT/B3LYP/pc-1 methods. The raw positions directly obtained with these methods are listed in Tables A.1 and A.2, along with the corrected SCC-DFTB values. For buckminsterfullerene, the residual shifts between corrected SCC-DFTB values and ex-perimental data are also given.
Exp. Raw Raw Corrected Residual
B3LYP/pc-1 SCC-DFTB SCC-DFTB shift to exp.
18.9 18.7 19.8 20.7 +1.8
17.3 17.0 14.9 16.1 -1.2
8.5 8.3 7.1 8.3 -0.2
7.0 6.9 6.0 7.0 0.0
Table A.1: Raw resonance wavelengths (in µm) of C60
buck-minsterfullerene IR active normal modes at the DFT and SCC-DFTB levels. The corrected SCC-DFTB values are also mentioned, along with the corresponding shifts with respect to experimental data (Krätschmer et al. 1990).
Raw Raw Corrected
B3LYP/pc-1 SCC-DFTB SCC-DFTB 24.2 29.0 28.4 21.8 21.4 22.1 12.4 11.0 12.3 9.5 8.2 9.4 6.5 5.8 6.8
Table A.2: Raw resonance wavelengths (in µm) of dehydro-genated coronene C24 IR active normal modes at the DFT
and SCC-DFTB levels. The corrected SCC-DFTB values are also mentioned.
Appendix B: Structural isomers of C
60+: IR
spectra
The geometries of all structural isomers of C60obtained at
the SCC-DFTB level were optimized in a positive charge state (doublet spin-state). Only slight structural changes were observed, the positive charge being diluted over the 60 carbon atoms. Their IR spectra were computed in the double harmonic approximation similarly to their neutral counterparts and the resulting average spectra for the four families as defined in the main text are shown in Fig. B.1.
A&A proofs: manuscript no. 34943corr 0.0 10.0 20.0 5 10 15 20 d)
Average intensity, (arb. units)
Wavelength (µm) branched 0.0 1.0 2.0 3.0 c) pretzel 0.0 2.0 4.0 b) PPA 0.0 0.4 0.8 1.2 1.6 2500 2000 1500 1000 500 a) Wavenumber (cm-1) cage
Fig. B.1: SCC-DFTB IR spectra of the families determined for C60+
Appendix C: Smaller size carbon clusters (C
42and
C
24): IR spectra
A similar study to that proposed in the present letter for C60 has been performed for smaller clusters, i.e., C42 and
C24with initial REBO structures taken from Bonnin et al.
(2019). The criteria used to determine the families are sim-ilar to those described for C60. The IR spectra of the four
families for the three cluster sizes are given in C.1.
0 2 4 6 8 10 12 5 10 15 20 PPA Wavelength (µm) C24 C42 C60 0 1 2 3 4 5 2500 2000 1500 1000 500 Cage
Average intensity (km.mol
-1 /cm -1 ) Wavenumber (cm-1) C24 C42 C60 5 10 15 20 0 5 10 15 20 25 30 Branched C24 C42 C60 0 1 2 3 4 5 6 7 8 2500 2000 1500 1000 500 Pretzel C24 C42 C60
Fig. C.1: SCC-DFTB IR spectra of the isomer families of C24and C42. Number of isomers per family, C42: 27324 cages,
40914 PPAs, 36036 pretzels, and 94130 branched structures; C24: 11 cages, 714 PPAs, 6307 pretzels, and 37309 branched