HAL Id: hal-01849043
https://hal.inria.fr/hal-01849043
Submitted on 25 Jul 2018HAL is a multi-disciplinary open access
archive for the deposit and dissemination of sci-entific research documents, whether they are pub-lished or not. The documents may come from teaching and research institutions in France or abroad, or from public or private research centers.
L’archive ouverte pluridisciplinaire HAL, est destinée au dépôt et à la diffusion de documents scientifiques de niveau recherche, publiés ou non, émanant des établissements d’enseignement et de recherche français ou étrangers, des laboratoires publics ou privés.
Designing objective quality metrics for panoramic videos
based on human perception
Sandra Nabil, Raffaella Balzarini, Frédéric Devernay, James L. Crowley
To cite this version:
Sandra Nabil, Raffaella Balzarini, Frédéric Devernay, James L. Crowley. Designing objective quality metrics for panoramic videos based on human perception. IMVIP 2018 - Irish Machine Vision and Image Processing Conference, Aug 2018, Belfast, United Kingdom. pp.1-4. �hal-01849043�
Designing objective quality metrics for panoramic videos
based on human perception
Sandra Nabil, Raffaella Balzarini, Frederic Devernay, James Crowley INRIA Grenoble Alpes
Abstract
The creation of high quality panoramic videos for immersive VR content is commonly done using a rig with multiple cameras covering the required scene. Unfortunately, this setup introduces both spatial and temporal artifacts due to the difference in optical centers as well as imperfect synchronization of cameras. Traditional image quality metrics are inadequate for describing geometric distortions in panoramic videos. In this paper, we propose an objective quality assessment approach for calculating these distortions based on optical flow coupled with an existing salience detection model. Our approach is validated with a human-centered study using error annotations and eye-tracking. Preliminary results indicate a good correlation between errors detected by the algorithm and human perception of errors.
Keywords: Panoramic Videos, Quality Assessment, Human Perception, Parallax Errors.
1
Introduction
The richness of panoramic videos within immersive environments makes it possible to capture outstanding scenes where the user can experience presence. However, realism of such videos is highly affected by visual artifacts such as parallax errors that appear in the form of deformations or ghosting. Unfortunately, this is unavoidable in panoramic video capture due to the use of multiple overlapping cameras. Several attempts have striven to minimize these errors [Perazzi et al., 2015, Lee et al., 2016], but neither could completely remove them. Quantifying those errors is important to video producers for quality monitoring and to researchers for algorithms optimization. Traditional image/video quality metrics are not well suited for capturing the geometric nature of panoramic video defects.
In this paper, we propose a quality assessment method based on a relative comparison of optical flow be-tween the set of input videos overlapping at a pixel location and its corresponding pixel in the output panorama. We enhance our results with the calculation of a salience map proposed by [Conze et al., 2012]. Finally, we as-sess our method using a human-centered empirical experiment by means of an error annotation interface along with eye-tracking Tobii glasses. Results show a good correlation between the way human perceive errors and the proposed objective metric as well as put the light on the importance of salience calculation.
2
Optical flow-based quality metrics
Several techniques for panoramic video quality assessment focus on user experiments within a virtual environ-ment where salience data is recorded and analyzed [Xu et al., 2017, Zhang et al., 2017]. Although interesting, subjective experiments are expensive and unpractical. As an alternative, we have investigated optical flow-based methods for this problem. A quality metric for stitched images was proposed by [Cheung et al., 2017] which calculates optical flow in the overlapping regions between views along with a salience map that guides the calculation. Unlike our approach, this method only works for images and is not applicable on videos. An-other limitation is the constraint they put on camera setup where the central image in a 3-view scene can be
considered the reference. Similar to our method, [K. and Channappayya, 2016] calculate a temporal feature from optical flow then use feature statistics to compare the reference and distorted videos on a frame-by-frame basis. Their approach is intended, however, to single-view videos hence does not have to deal with multiple inputs. The success of these methods in identifying geometrical defects has motivated us to work on an optical flow-based method for panoramic videos.
3
Proposed objective quality metric
In a panoramic video, a final output video frame is a composite novel view from a number of input views that go through a series of geometric transformations. Panoramic video stitching methods usually add further transformations for parallax compensation [Perazzi et al., 2015, Lee et al., 2016]. Our method suggests using the original videos as a reference to the single output panorama by comparing the difference in motion between two given frames in the original videos and motion in the final panorama. However, this is not directly ap-plicable since a given pixelxpano in the final panorama can have one to N sources corresponding toN input videos with overlapping regions. To overcome this, we have explored the calculation of the deviation of dis-placements of all source pixels xi, i ∈ N from the displacement of the panorama xp ano between times t and t + 1. In this way, we calculate the optical flow between two frames at timest andt + 1of each input video and the final panorama. We calculate the standard deviation of the end points of the vector field at each pixelxof the panoramic image to produce our distortion mapMd as follows:
Md(xt) = s
(xp ano,t +1−Pn
i xi ,t +1)2
n (1)
wheren ∈ [1, N ]is the number of overlapping images at pixelxandxt +1= xt+ µ(xt)andµis the motion field of a pixel between timest andt + 1.
For more accurate results, we determine visual salience using visibility maps as suggested by [Conze et al., 2012]. Visibility maps model three features that have been shown to mask errors, which are contrast, texture and vari-ation of gradient orientvari-ations. Equvari-ations for these maps are detailed in [Conze et al., 2012]. We define our salience mapMs for a panoramic frameIpano as:
Ms= Wc(Ip ano) ∗ Wt(Ip ano) ∗ Wo(Ip ano) (2) whereWc,Wt andWocorrespond to contrast, texture and orientation weighting maps respectively.
Building on the assumption that a human would gaze a region if it is distorted or if it salient, we propose to produce a distortion-salience mapMd s fromMd andMs using a weighted sum. The parameterωcan be changed depending on the video content, i.e.: a highly salient content implies a lower weight forMs.
Md s= ωMd+ (1 − ω)Ms (3)
4
Human gaze and annotations: an empirical assessment
Our objective visual quality assessment is meant to model human perception’s sensitivity to distortions and salience. Thus, it was important to validate it with a human-centered study where we collected gaze data using eye tracking and user decision using annotation. In our experiment, we define an error as a region with high number of fixations and an annotation by at least one participant. The protocol for measuring such errors involved the observation of 20 participants wearing Tobii eye-tracking glasses while watching 4 short panoramic videos. Our experiment was designed to answer the following question: Do humans recognize errors that are not identified by an algorithm and vice-versa? The videos were displayed on a large screen for immersion and were played in a random order within an annotation interface that allows the observer to pause the video and mark a region they perceived as deformed. This setup allowed the collection of two types of data, participants’
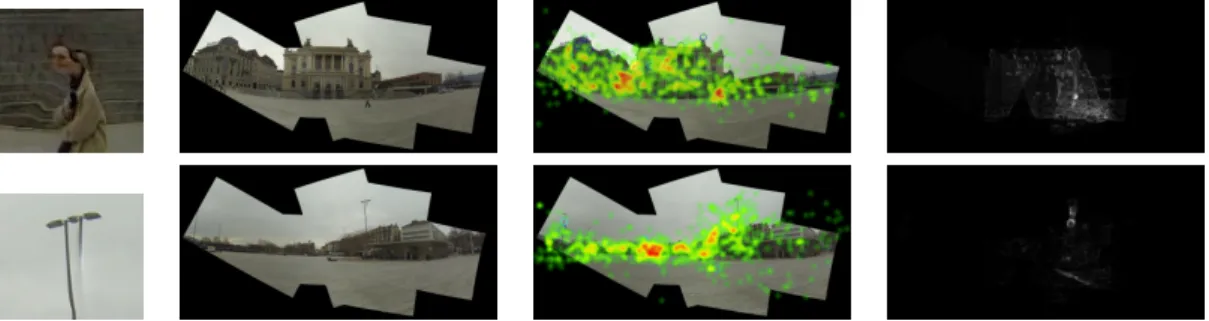
Figure 1: Results on Opera with corresonding heatmaps for gaze data and distortion map calculated by Eq. 1
Figure 2: Results on Street with corresponding heatmaps for gaze data and salience map calculated by Eq. 2
Figure 3: An example of a keyframe of Opera with corresponding AOIs. Charts to the right show that highest gazed error was also the most annotated by humans and it corresponds to the deformed person.
gaze and frames annotations. Our analysis was conducted on both types of data jointly. For each video, we chose one or more keyframes representing the central view within a sequence of frames. Depending on the scene being taken from a fixed view-point or a moving camera, we chose one keyframe or more.
To compare this with our objective metric, we calculated the temporal distortion on a sequence of frames whose center was a given keyframe. Temporal pooling of a given sequence was done by a simple OR then we overlayed our final composite map on the keyframe. Afterwards, data analysis was done using Tobii Pro Lab software. For each keyframe, we defined annotations collected by the 20 participants using Tobii Areas of Inter-est (AOI) corresponding to at least one human annotation. On the same keyframe, we defined the error regions identified by our distortion map as seen in figure 3. Qualitative results were obtained by generating heat-maps from gaze data recordings using an I-VT Tobii attention filter as suggested by [Salvucci and Goldberg, 2000]. Classical metrics such as total fixation count and total fixation duration [Holmqvist et al., 2011] were used to obtain descriptive statistics on the AOIs described earlier.
5
Preliminary results
In this paper, we present preliminary results that were obtained mainly on two videos Opera and Street taken in Zurich by Disney researchers [Perazzi et al., 2015]. We subdivided Opera into 5 keyframes since the camera is constantly moving, and only one for Street which was taken using a fixed rig hence content was nearly stable. Distortion and salience maps are calculated on those keyframes and we used [Farnebäck, 2003] for optical flow calculation. Heatmaps were generated for the 20 observers and combined on a single keyframe. We assume that an area with high fixations on a heatmap correspond to perceiving a distortion and/or a salience.
In response to our experimental question, preliminary results shown in 1 indicate that a person’s face de-formation and a lamp ghosting were the most annotated errors by participants in Opera which correspond to error locations identified by the distortion maps (see figure ). Results on street (see figure 2) show a correlation
between human gaze and the calculated salience map. Statistics on AOIs confirm our findings as in figure 3.
6
Conclusion
We presented a method for designing quality metrics for panoramic videos that was evaluated using a human-centered study. Our early results show that humans are more likely to see errors present in the foreground or moving objects, rather than those in the background. We were able to verify that the calculated distortion map was able to identify most error locations. However, the salience map is yet to be improved to reflect the new findings and be able to penalize distortions occurring in particular regions. Finally, we aim to complete our data analysis and provide a pooling method to obtain an index that can allow the comparison to other methods.
Acknowledgements
This work was funded by the LIVE360TV FUI 19 project and supported by the French Agence Nationale de la Recherche (ANR), grant ANR-11-EQPX-0002 Amiqual4Home.
References
[Cheung et al., 2017] Cheung, G., Yang, L., Tan, Z., and Huang, Z. (2017). A content-aware metric for stitched panoramic image quality assessment. In 2017 IEEE International Conference on Computer Vision Work-shops (ICCVW), pages 2487–2494.
[Conze et al., 2012] Conze, P.-H., Robert, P., and Morin, L. (2012). Objective view synthesis quality assess-ment. 8288:53–.
[Farnebäck, 2003] Farnebäck, G. (2003). Two-frame motion estimation based on polynomial expansion. In Bigun, J. and Gustavsson, T., editors, Image Analysis, pages 363–370. Springer Berlin Heidelberg.
[Holmqvist et al., 2011] Holmqvist, K., NystrÃ˝um, M., Andersson, R., Dewhurst, R., Jarodzka, H., and van de Weijer, J. (2011). Eye tracking: A comprehensive guide to methods and measures.
[K. and Channappayya, 2016] K., M. and Channappayya, S. S. (2016). An optical flow-based full reference video quality assessment algorithm. IEEE Transactions on Image Processing, 25(6):2480–2492.
[Lee et al., 2016] Lee, J., Kim, B., Kim, K., Kim, Y., and Noh, J. (2016). Rich360: Optimized spherical representation from structured panoramic camera arrays. ACM Trans. Graph., 35(4):63:1–63:11.
[Perazzi et al., 2015] Perazzi, F., Sorkine-Hornung, A., Zimmer, H., Kaufmann, P., Wang, O., Watson, S., and Gross, M. H. (2015). Panoramic video from unstructured camera arrays. Comput. Graph. Forum, 34(2):57– 68.
[Salvucci and Goldberg, 2000] Salvucci, D. D. and Goldberg, J. H. (2000). Identifying fixations and saccades in eye-tracking protocols. In Proceedings of the 2000 Symposium on Eye Tracking Research & Applications, ETRA ’00, pages 71–78, New York, NY, USA. ACM.
[Xu et al., 2017] Xu, M., Li, C., Liu, Y., Deng, X., and Lu, J. (2017). A subjective visual quality assessment method of panoramic videos. In 2017 IEEE International Conference on Multimedia and Expo (ICME), pages 517–522.
[Zhang et al., 2017] Zhang, B., Zhao, J., Yang, S., Zhang, Y., Wang, J., and Fei, Z. (2017). Subjective and objective quality assessment of panoramic videos in virtual reality environments. In 2017 IEEE International Conference on Multimedia Expo Workshops (ICMEW), pages 163–168.