HAL Id: inserm-02905473
https://www.hal.inserm.fr/inserm-02905473
Submitted on 23 Jul 2020
HAL is a multi-disciplinary open access archive for the deposit and dissemination of sci-entific research documents, whether they are pub-lished or not. The documents may come from teaching and research institutions in France or abroad, or from public or private research centers.
L’archive ouverte pluridisciplinaire HAL, est destinée au dépôt et à la diffusion de documents scientifiques de niveau recherche, publiés ou non, émanant des établissements d’enseignement et de recherche français ou étrangers, des laboratoires publics ou privés.
according to breast cancer subtype: Validation on a
cohort of BC patients treated by neoadjuvant
chemotherapy
Anne-Sophie Hamy, Lauren Darrigues, Enora Laas, Diane de Croze, Lucian
Topciu, Giang-Thanh Lam, Clemence Evrevin, Sonia Rozette, Lucie Laot,
Florence Lerebours, et al.
To cite this version:
Anne-Sophie Hamy, Lauren Darrigues, Enora Laas, Diane de Croze, Lucian Topciu, et al.. Prognostic value of the Residual Cancer Burden index according to breast cancer subtype: Validation on a cohort of BC patients treated by neoadjuvant chemotherapy. PLoS ONE, Public Library of Science, 2020, 15 (6), pp.e0234191. �10.1371/journal.pone.0234191�. �inserm-02905473�
RESEARCH ARTICLE
Prognostic value of the Residual Cancer
Burden index according to breast cancer
subtype: Validation on a cohort of BC patients
treated by neoadjuvant chemotherapy
Anne-Sophie Hamy1,2, Lauren Darrigues3, Enora Laas3, Diane De Croze4, Lucian Topciu5, Giang-Thanh Lam3,6, Clemence Evrevin2, Sonia Rozette2, Lucie Laot3,
Florence Lerebours2, Jean-Yves Pierga2,3, Marie Osdoit3, Matthieu Faron7, Jean-Guillaume Feron3, Marick Lae´5, Fabien Reyal2,3
*
1 Residual Tumor & Response to Treatment Laboratory, RT2Lab, INSERM, U932 Immunity and Cancer,
Institut Curie, Paris, France, 2 Department of Medical Oncology, Institut Curie, Saint-Cloud, France,
3 Department of Surgery, Faculte´ de Me´decine Descartes, Universite´ Paris, Institut Curie, Paris, France, 4 Department of Tumor Biology, Institut Curie, Saint-Cloud, France, 5 Department of Tumor Biology, Institut
Curie, Paris, France, 6 Department of Gynecology and Obstetrics, Geneva University Hospitals, Geneva, Switzerland, 7 Department of biostatistics and epidemiology, INSERM 1018 CESP Oncostat team, Gustave Roussy Cancer Campus, Villejuif, France
*fabien.reyal@curie.fr
Abstract
Introduction
The Residual Cancer Burden (RCB) quantifies residual disease after neoadjuvant chemo-therapy (NAC). Its predictive value has not been validated on large cohorts with long-term follow up. The objective of this work is to independently evaluate the prognostic value of the RCB index depending on BC subtypes (Luminal, HER2-positive and triple negative (TNBCs)).
Methods
We retrospectively evaluated the RCB index on surgical specimens from a cohort of T1-T3NxM0 BC patients treated with NAC between 2002 and 2012. We analyzed the associa-tion between RCB index and relapse-free survival (RFS), overall survival (OS) among the global population, after stratification by BC subtypes.
Results
717 patients were included (luminal BC (n = 222, 31%), TNBC (n = 319, 44.5%), HER2-posi-tive (n = 176, 24.5%)). After a median follow-up of 99.9 months, RCB index was significantly associated with RFS. The RCB-0 patients displayed similar prognosis when compared to the RCB-I group, while patients from the RCB-II and RCB-III classes were at increased risk of relapse (RCB-II versus RCB-0: HR = 3.25 CI [2.1–5.1] p<0.001; RCB-III versus RCB-0: HR = 5.6 CI [3.5–8.9] p<0.001). The prognostic impact of RCB index was significant for TNBC and HER2-positive cancers; but not for luminal cancers (Pinteraction= 0.07). The
a1111111111 a1111111111 a1111111111 a1111111111 a1111111111 OPEN ACCESS
Citation: Hamy A-S, Darrigues L, Laas E, De Croze
D, Topciu L, Lam G-T, et al. (2020) Prognostic value of the Residual Cancer Burden index according to breast cancer subtype: Validation on a cohort of BC patients treated by neoadjuvant chemotherapy. PLoS ONE 15(6): e0234191.
https://doi.org/10.1371/journal.pone.0234191
Editor: Tina Hieken, Mayo Clinic, UNITED STATES Received: November 11, 2019
Accepted: May 20, 2020 Published: June 24, 2020
Peer Review History: PLOS recognizes the
benefits of transparency in the peer review process; therefore, we enable the publication of all of the content of peer review and author responses alongside final, published articles. The editorial history of this article is available here:
https://doi.org/10.1371/journal.pone.0234191
Copyright:© 2020 Hamy et al. This is an open access article distributed under the terms of the
Creative Commons Attribution License, which permits unrestricted use, distribution, and reproduction in any medium, provided the original author and source are credited.
Data Availability Statement: All relevant data are
within the paper and its Supporting Information files.
prognosis of RCB-III patients was poor (8-years RFS: 52.7%, 95% CI [44.8–62.0]) particu-larly in the TNBC subgroup, where the median RFS was 12.7 months.
Conclusion
RCB index is a reliable prognostic score. RCB accurately identifies patients at a high risk of recurrence (RCB-III) with TNBC or HER2-positive BC who must be offered second-line adjuvant therapies.
Introduction
Neoadjuvant chemotherapy (NAC),i.e. chemotherapy before surgery, is currently being used
in poor prognosis breast carcinoma. Besides reducing tumor burden and enabling conserva-tive breast surgery, NAC also provides a unique opportunity to evaluate the response of patients with breast cancer (BC) to different treatments. Pathologic complete response (pCR), defined as an absence of invasive cancer in the breast and axillary lymph nodes, is associated with better long-term survival, though its prognostic value is particularly important in highly aggressive tumors, such as triple negative breast cancer (TNBC) andHER2-positive BC [1].
However, since most of the tumors do not achieve pCR following NAC, this binary indica-tor gathers in a unique category the majority of the patients, thus precluding the opportunity to sharply predict their oncological outcome. While patients with pCR exhibit an excellent prognosis, a wide clinical heterogeneity remains within those patients failing to reach complete response, and the identification of patients with residual disease at a high risk of relapse is a substantial challenge. Hence, the subdivision of the BC population into several prognostic groups could help improving the prediction of survival benefits [2].
The Residual Cancer Burden (RCB) index has been developed in 2007 by Symmans and colleagues from the M.D. Anderson Cancer Center (MDACC) [3] to quantify residual disease following NAC. The RCB index combines pathological findings in the primary tumor bed and the regional lymph nodes to calculate a continuous index. This index is subdivided into four classes with an increasing amount of residual disease: RCB 0 (pCR), RCB-I, RCB-II, and RCB-III. Several prospective clinical studies (CALGB [4], GEICAM [5] and I-SPY [6]) included RCB as a primary or secondary end point for response to NAC. Among the variety of scoring systems developed in the last years (CPS [7], CPS+EG, Neobioscore ([8]), RCB index was recommended by the BIG-NABCG (Breast International Group-North American Breast Cancer Group) to quantify residual disease in neoadjuvant trials, in addition to pCR [9]. How-ever, so far, it remains unknown if RCB index displays high prognostic performances in rou-tine practice, and external fully independent validation of the prognostic value of the RCB index is lacking. The current study aims at evaluating the prognostic value of the RCB index in a large real-life cohort of breast cancer patients treated with NAC.
Material and methods
Patients and tumors
The analysis was performed on a previously described cohort of patients [10] with invasive breast carcinoma stage T1-T3NxM0 and treated with NAC at Institut Curie, Paris, between 2002 and 2012 (NEOREP Cohort, CNIL declaration number 1547270). We included unilat-eral, non-recurrent, non-inflammatory, non-metastatic tumors, excluding T4 tumors. All
Funding: We thank Roche France for financial
support for the construction of the Institut Curie neoadjuvant database (NEOREP). Funding was also obtained from the Site de Recherche Integre´e en Cance´rologie/Institut National du Cancer (Grant No. INCa-DGOS-4654). A-S Hamy-Petit was supported by an ITMO-INSERM-AVIESAN translational cancer research grant. The funders had no role in study design, data collection and analysis, decision to publish, or preparation of the manuscript.
Competing interests: We thank Roche France for
financial support for the construction of the Institut Curie neoadjuvant database (NEOREP). Funding was also obtained from the Site de Recherche Integre´e en Cance´rologie/Institut National du Cancer (Grant No. INCa-DGOS-4654). A-S Hamy-Petit was supported by an ITMO-INSERM-AVIESAN translational cancer research grant.The authors have declared that no competing interests of any kind exist, with funders such as Roche France, or with other entities. This does not alter our adherence to PLOS ONE policies on sharing data and materials.
patients received NAC, followed by surgery and radiotherapy. NAC regimens changed over our recruitment period (anthracycline-based regimen or sequential anthracycline-taxanes reg-imen), with trastuzumab used in an adjuvant and/or neoadjuvant setting since 2005. Endo-crine therapy (tamoxifen or aromatase inhibitor) was prescribed when indicated. The study was approved by the Breast Cancer Study Group of Institut Curie and was conducted accord-ing to institutional and ethical rules regardaccord-ing research on tissue specimens and patients. Writ-ten informed consent from the patients was not required by French regulations.
Tumor samples
Cases were considered estrogen receptor (ER) or progesterone receptor (PR) positive (+) if at least 10% of the tumor cells expressed estrogen and/or progesterone receptors (ER/PR), in accordance with guidelines used in France [11].HER2 expression was determined by
immu-nohistochemistry with scoring in accordance with American Society of Clinical Oncology (ASCO)/College of American Pathologists (CAP) guidelines [12]. Scores 3+ were reported as positive, score 1+/0 as negative (-). Tumors with scores 2+ were further tested by FISH.HER2
gene amplification was defined in accordance with ASCO/CAP guidelines [12]. We evaluated a mean of 40 tumor cells per sample and the meanHER2 signals per nuclei was calculated. A HER2/CEN17 ratio � 2 was considered positive, and a ratio < 2 negative [12]. BC subtypes were defined as follows: tumors positive for either ER or PR, and negative forHER2 were
clas-sified as luminal; tumors positive forHER2 were considered to be HER2-positive BC; tumors
negative for ER, PR, andHER2 were considered to be triple-negative breast cancers (TNBC).
Tumor cellularity was defined as the percentage of tumor cells (in situ and invasive) on the specimen (biopsy or surgical specimen). Mitotic index was reported per 10 high power fields (HPF) (1 HPF = 0.301 mm2).
Pathological review
717 pathological pretreatment core needle biopsies and the corresponding post-NAC surgical specimens were reviewed independently by two experts in breast diseases (ML, DD).
Residual Cancer Burden index. Histological components of the “Residual Cancer
Bur-den” were retrieved for calculating the score as described in 2007 by Symmans (seeS1 File). RCB index enables the classification of residual disease into four categories: RCB-0 (complete pathologic response = pCR), RCB-I (minimal residual disease), RCB-II (moderate residual dis-ease) and RCB-III (extensive residual disdis-ease). Two cutoff points defined those subgroups: the first (RCB-IIIv RCB-I/II) was selected as the 87th percentile (RCB, 3.28), and the second
(RCB-Iv RCB-II) corresponded to the 40th percentile (RCB, 1.36). RCB has been calculated
through the web-based calculator that is freely available on the internet (www.mdanderson. org/breastcancer_RCB).
TILs and LVI. Lymphovascular invasion (LVI) was defined as the presence of carcinoma
cells within a finite endothelial-lined space (a lymphatic or blood vessel). Tumor infiltrating lymphocytes (TILs) were defined as the presence of mononuclear cells infiltrate (including lymphocytes and plasma cells, excluding polymorphonuclear leukocytes), and were also evalu-ated retrospectively, for research purposes (seeS1 File).
Study endpoints
Relapse-free survival (RFS) was defined as the time from surgery to death, loco-regional recur-rence or distant recurrecur-rence, whichever occurred first. Overall survival (OS) was defined as the time from surgery to death. The date of last known contact was retained for patients for whom none of these events were recorded. Survival cutoff date analysis was February, 1st, 2019.
Statistical analysis
The study population was described in terms of frequencies for qualitative variables, or medi-ans and associated ranges for quantitative variables. Chi-square tests were performed to search for differences between subgroups for each variable (considered significant for p-values � 0.05). Survival probabilities were estimated by the Kaplan–Meier method, and survival curves were compared in log-rank tests. Hazard ratios and their 95% confidence intervals were calcu-lated with the Cox proportional hazards model. Variables with a p-value for the likelihood ratio test equal to 0.05 or lower in univariate analysis were selected for inclusion in the variate analysis. A forward stepwise selection procedure was used to establish the final multi-variate model and the significance threshold was 5%. Missing data were present in 69 out of 717 patients (9.6%) for the variable lymphovascular invasion and we imputed these missing data by a chained equation multiple imputation strategy, as recommended in a previous study [13]. We assessed the effect of the RCB index both on the hazard scale (with a proportional hazards model) and on the log-of-time scale with an accelerated failure time model. Data were processed and statistical analyses were carried out with R software version 3.1.2 ( www.cran.r-project.org, [14].
Results
Patients’ characteristics
A total of 717 patients were included in the cohort. Patients and tumors characteristics are summarized inTable 1. Median age was 48 years old (range [25–80]) and most of the patients (63%) were premenopausal. BC repartition by subtype was as follows: luminal (n = 222; 31%), TNBC (n = 319; 44.5%),HER2-positive (n = 176; 24.5%). No difference was observed
accord-ing to BC subtype regardaccord-ing age, menopausal status, clinical tumor size nor clinical nodal status. TNBC andHER2-positive BCs were associated with a higher grade, Ki67 and mitotic
index than luminal BCs (p<0.001).
RCB index repartition and patients’ characteristics by RCB class
At NAC completion, RCB-0 (pCR) was observed in 202 patients (28.2%). Among 515 patients with residual disease, RCB index repartition was as follows RCB-I: n = 65 (9%), RCB-II: n = 309 (43.1%) and RCB-III: n = 141 (19.7%) (Table 2,Fig 1A). The RCB index distribution was significantly different by BC subtypes (p<0.001) (Table 2,Fig 1B): luminal tumors were more likely to be classified as RCB-II (49.1%) or III (36.9%), whereas TNBC or
HER2-positive BC were more likely to be RCB-0 or I (45.7% and 52.3% respectively) (p<0.001). Only
small subsets of TNBC andHER2-positive BCs were classified as RCB-III (13.2% and 8.5%
respectively).
The distribution of the index was bimodal as previously described [3], and the 2 modes of the distribution strongly overlapped with the post-NAC nodal status (Fig 2A and 2B). Most of the patients with tumors classified as RCB-I were free from axillar nodal involvement, while the majority of patients with tumors classified as RCB-III had a node-positive disease (Fig 2C and 2D).
Patients’ characteristics by RCB class are summarized inTable 2and are represented inFig 3. Among pre-NAC parameters, RCB class was significantly different by tumor size (p<0.001) (Fig 3A), clinical nodal status (p<0.001) (Fig 3B), pathological grade (p<0.001) (Fig 3C), BMI (p<0.05) (Fig 3D) and mitotic index (p<0.001) (Fig 3E). Pre-NAC TILs were inversely associ-ated with RCB (p<0.001) (Fig 3F). Among the post-NAC parameters, higher RCB class was significantly correlated with the presence of LVI (p<0.001;Fig 3G), nodal involvement
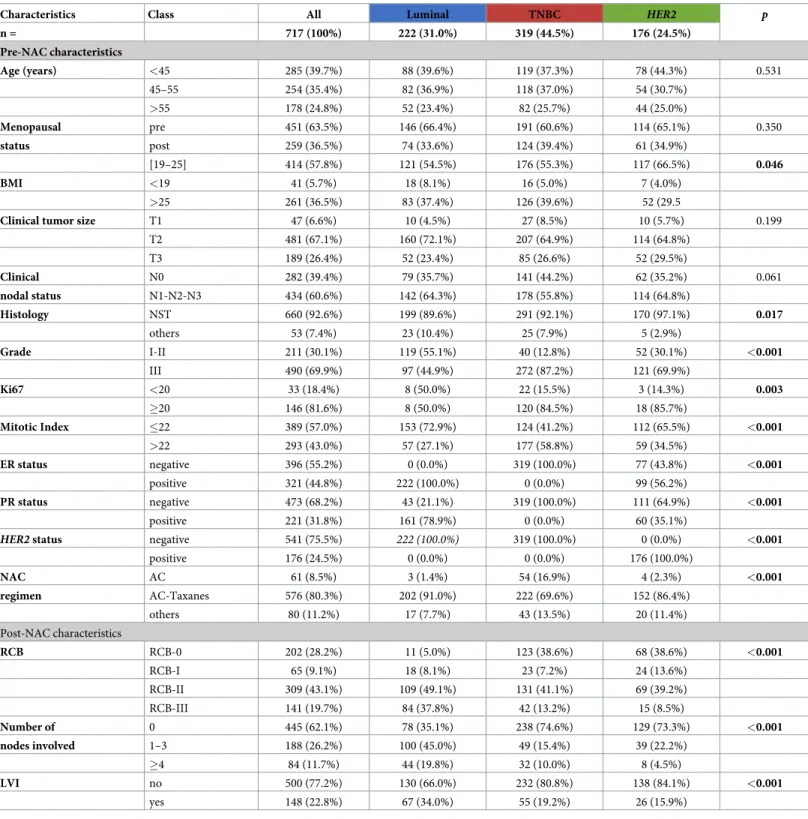
Table 1. Patients’ characteristics among the whole population and in each subtype.
Characteristics Class All Luminal TNBC HER2 p
n = 717 (100%) 222 (31.0%) 319 (44.5%) 176 (24.5%) Pre-NAC characteristics Age (years) <45 285 (39.7%) 88 (39.6%) 119 (37.3%) 78 (44.3%) 0.531 45–55 254 (35.4%) 82 (36.9%) 118 (37.0%) 54 (30.7%) >55 178 (24.8%) 52 (23.4%) 82 (25.7%) 44 (25.0%) Menopausal pre 451 (63.5%) 146 (66.4%) 191 (60.6%) 114 (65.1%) 0.350 status post 259 (36.5%) 74 (33.6%) 124 (39.4%) 61 (34.9%) [19–25] 414 (57.8%) 121 (54.5%) 176 (55.3%) 117 (66.5%) 0.046 BMI <19 41 (5.7%) 18 (8.1%) 16 (5.0%) 7 (4.0%) >25 261 (36.5%) 83 (37.4%) 126 (39.6%) 52 (29.5
Clinical tumor size T1 47 (6.6%) 10 (4.5%) 27 (8.5%) 10 (5.7%) 0.199
T2 481 (67.1%) 160 (72.1%) 207 (64.9%) 114 (64.8%) T3 189 (26.4%) 52 (23.4%) 85 (26.6%) 52 (29.5%) Clinical N0 282 (39.4%) 79 (35.7%) 141 (44.2%) 62 (35.2%) 0.061 nodal status N1-N2-N3 434 (60.6%) 142 (64.3%) 178 (55.8%) 114 (64.8%) Histology NST 660 (92.6%) 199 (89.6%) 291 (92.1%) 170 (97.1%) 0.017 others 53 (7.4%) 23 (10.4%) 25 (7.9%) 5 (2.9%) Grade I-II 211 (30.1%) 119 (55.1%) 40 (12.8%) 52 (30.1%) <0.001 III 490 (69.9%) 97 (44.9%) 272 (87.2%) 121 (69.9%) Ki67 <20 33 (18.4%) 8 (50.0%) 22 (15.5%) 3 (14.3%) 0.003 �20 146 (81.6%) 8 (50.0%) 120 (84.5%) 18 (85.7%) Mitotic Index �22 389 (57.0%) 153 (72.9%) 124 (41.2%) 112 (65.5%) <0.001 >22 293 (43.0%) 57 (27.1%) 177 (58.8%) 59 (34.5%) ER status negative 396 (55.2%) 0 (0.0%) 319 (100.0%) 77 (43.8%) <0.001 positive 321 (44.8%) 222 (100.0%) 0 (0.0%) 99 (56.2%) PR status negative 473 (68.2%) 43 (21.1%) 319 (100.0%) 111 (64.9%) <0.001 positive 221 (31.8%) 161 (78.9%) 0 (0.0%) 60 (35.1%)
HER2 status negative 541 (75.5%) 222 (100.0%) 319 (100.0%) 0 (0.0%) <0.001
positive 176 (24.5%) 0 (0.0%) 0 (0.0%) 176 (100.0%) NAC AC 61 (8.5%) 3 (1.4%) 54 (16.9%) 4 (2.3%) <0.001 regimen AC-Taxanes 576 (80.3%) 202 (91.0%) 222 (69.6%) 152 (86.4%) others 80 (11.2%) 17 (7.7%) 43 (13.5%) 20 (11.4%) Post-NAC characteristics RCB RCB-0 202 (28.2%) 11 (5.0%) 123 (38.6%) 68 (38.6%) <0.001 RCB-I 65 (9.1%) 18 (8.1%) 23 (7.2%) 24 (13.6%) RCB-II 309 (43.1%) 109 (49.1%) 131 (41.1%) 69 (39.2%) RCB-III 141 (19.7%) 84 (37.8%) 42 (13.2%) 15 (8.5%) Number of 0 445 (62.1%) 78 (35.1%) 238 (74.6%) 129 (73.3%) <0.001 nodes involved 1–3 188 (26.2%) 100 (45.0%) 49 (15.4%) 39 (22.2%) �4 84 (11.7%) 44 (19.8%) 32 (10.0%) 8 (4.5%) LVI no 500 (77.2%) 130 (66.0%) 232 (80.8%) 138 (84.1%) <0.001 yes 148 (22.8%) 67 (34.0%) 55 (19.2%) 26 (15.9%)
Missing values: menopausal status n = 7; BMI n = 1; clinical nodal status n = 1; mitotic index n = 35; histology n = 4; grade n = 16; Ki67 n = 538; LVI n = 69. Abbreviations: pCR = pathological complete response; BMI = body mass index; NST = no special type; ER = oestrogen receptor; PR = progesterone receptor; NAC = neoadjuvant chemotherapy; AC = anthracyclines; LVI = lymphovascular invasion; RCB = residual cancer burden.
Table 2. Patients’ characteristics according to RCB classes.
Variable Class pCR RCB-I RCB-II RCB-III p
n = 202 (28.2%) 65 (9.1%) 309 (43.1%) 141 (19.7%) Pre-NAC parameters Age (years) <45 76 (37.6%) 31 (47.7%) 130 (42.1%) 48 (34.0%) 0.136 45–55 66 (32.7%) 25 (38.5%) 108 (35.0%) 55 (39.0%) >55 60 (29.7%) 9 (13.8%) 71 (23.0%) 38 (27.0%) Menopausal pre 119 (59.8%) 46 (71.9%) 202 (65.6%) 84 (60.4%) 0.235 Status post 80 (40.2%) 18 (28.1%) 106 (34.4%) 55 (39.6%) BMI 19�BMI�25 125 (62.2%) 46 (70.8%) 176 (57.0%) 67 (47.5%) 0.007 <19 8 (4.0%) 6 (9.2%) 15 (4.9%) 12 (8.5%) >25 68 (33.8%) 13 (20.0%) 118 (38.2%) 62 (44.0%) Tumoral Size T1 26 (12.9%) 3 (4.6%) 12 (3.9%) 6 (4.3%) <0.001 T2 129 (63.9%) 52 (80.0%) 213 (68.9%) 87 (61.7%) T3 47 (23.3%) 10 (15.4%) 84 (27.2%) 48 (34.0%) Nodal status N0 83 (41.1%) 32 (49.2%) 138 (44.7%) 29 (20.7%) <0.001 pre NAC N1-N2-N3 119 (58.9%) 33 (50.8%) 171 (55.3%) 111 (79.3%) Mitotic Index �22 89 (47.1%) 40 (66.7%) 167 (56.2%) 93 (68.4%) 0.001 >22 100 (52.9%) 20 (33.3%) 130 (43.8%) 43 (31.6%) Histology NST 188 (93.5%) 59 (90.8%) 292 (95.4%) 121 (85.8%) 0.004 other 13 (6.5%) 6 (9.2%) 14 (4.6%) 20 (14.2%) Grade I-II 33 (16.8%) 21 (32.8%) 91 (30.2%) 66 (47.5%) <0.001 III 164 (83.2%) 43 (67.2%) 210 (69.8%) 73 (52.5%) Ki67 <20% 6 (10.2%) 3 (30.0%) 17 (20.7%) 7 (25.0%) 0.198 �20% 53 (89.8%) 7 (70.0%) 65 (79.3%) 21 (75.0%)
TILs stromal mean % 34 26.1 19.7 19.0 <0.001
Subtype luminal 11 (5.4%) 18 (27.7%) 109 (35.3%) 84 (59.6%) <0.001 TNBC 123 (60.9%) 23 (35.4%) 131 (42.4%) 42 (29.8%) HER2 68 (33.7%) 24 (36.9%) 69 (22.3%) 15 (10.6%) ER status negative 163 (80.7%) 31 (47.7%) 152 (49.2%) 50 (35.5%) <0.001 positive 39 (19.3%) 34 (52.3%) 157 (50.8%) 91 (64.5%) PR status negative 183 (91.5%) 38 (60.3%) 185 (61.3%) 67 (51.9%) <0.001 positive 17 (8.5%) 25 (39.7%) 117 (38.7%) 62 (48.1%)
HER2 status negative 134 (66.3%) 41 (63.1%) 240 (77.7%) 126 (89.4%) <0.001
positive 68 (33.7%) 24 (36.9%) 69 (22.3%) 15 (10.6%) NAC Regimen AC 17 (8.4%) 3 (4.6%) 30 (9.7%) 11 (7.8%) 0.599 AC-Taxanes 158 (78.2%) 57 (87.7%) 244 (79.0%) 117 (83.0%) others 27 (13.4%) 5 (7.7%) 35 (11.3%) 13 (9.2%) Post-NAC parameters Nodal involvment 0 202 (100.0%) 53 (81.5%) 188 (60.8%) 2 (1.4%) <0.001 1–3 0 (0.0%) 12 (18.5%) 101 (32.7%) 75 (53.2%) �4 0 (0.0%) 0 (0.0%) 20 (6.5%) 64 (45.4%) LVI no 200 (99.0%) 41 (91.1%) 190 (71.4%) 69 (51.1%) <0.001 yes 2 (1.0%) 4 (8.9%) 76 (28.6%) 66 (48.9%)
Mitotic Index mean, SD 0.82 (2.54) 17.75 (28.88) 19.32 (33.53) <0.001
TILs stromal mean, SD 8.7 (10.5) 12.8 (14.6) 14.8 (12.5) 15.2 (14) <0.001
Abbreviations: pCR = pathological complete response; BMI = body mass index; NST = no special type; ER = oestrogen receptor; PR = progesterone receptor; NAC = neoadjuvant chemotherapy; AC = anthracyclines; LVI = lymphovascular invasion, TILs = tumor infiltrating lymphocytes.
(p<0.001;Fig 3H), whereas post-NAC TILs were positively associated with RCB (p<0.001;
Fig 3I).
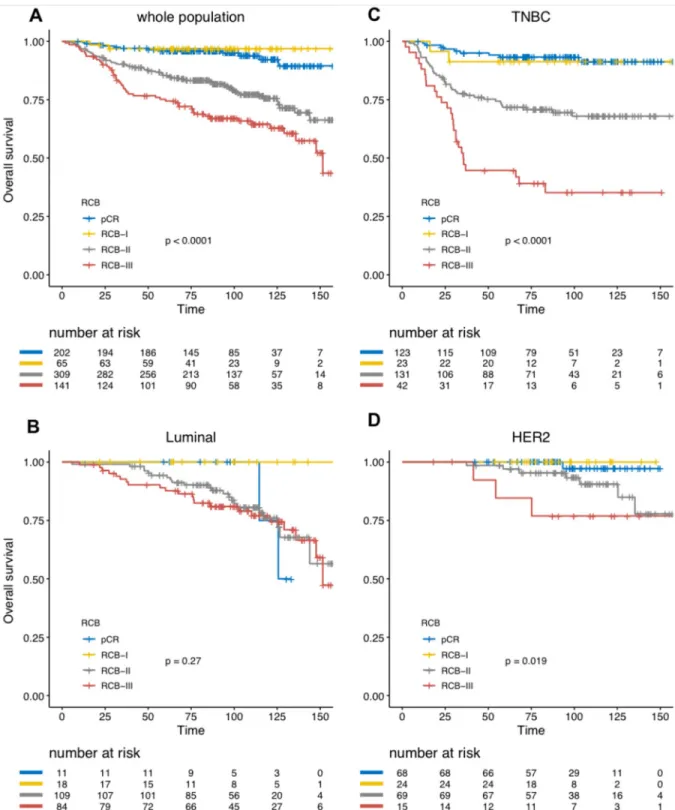
Survival analyses
With a median follow-up of 99.9 months, [range (9.3–184.2 months)], 205 patients experi-enced relapse, and 133 were deceased. Among the whole population, RCB was significantly associated with RFS (Fig 4A), and this association was significant after both univariate analysis and multivariate analysis (Table 3). Eight-years relapse free survival was good in RCB-0 and RCB-I group (89.9%, CI [85.6–94.4] and 89.0% CI [80.7–98.2] respectively), whereas the prognosis was intermediate in RCB-II patients (67.8%, CI [62.4–73.5]) and poor in RCB-III patients (52.7%, CI [44.8–62.0]). Increasing RCB was associated with an increased risk of relapse (RCB-II versus RCB-0: HR = 3.25 CI [2.1–5.1]p<0.001 and RCB-III versus RCB-0:
HR = 5.6 CI [3.5–9.0]p<0.001). The prognosis impact of the RCB index was significant in
TNBC andHER2-positive BCs, but not in luminal BC (Fig 4B–4Dand S1-S3 Tables inS1 File) (Pinteraction= 0.05, though the interaction test failed to reach statistical significance after
multi-variate analysis (Pinteraction= 0.057)). In addition to the increased risk of relapse, RCB index
was also significantly associated with an earlier time-to-relapse, as estimated by the AFT regression model (RCB IIversus RCB 0 and I grouped, HR = 3.27, 95% CI [2.18–4.91], RCB-III versus RCB 0 and I grouped, HR = 5.73, 95% CI [3.74–8.76] p<0.001), and this was true in
TNBC andHER2-positive BCs (p<0.001) but not in luminal BCs (p = 0.06). In TNBC, RCB-III
class identified a group of patients with extremely poor prognosis, displaying a median relapse-free survival of 12.7 months. We also identified an interaction between post-NAC TILs and RCB class to predict RFS (Pinteraction= 0.03). Post-NAC TILs had no prognostic impact on
Fig 1. RCB class distribution among the whole population and by BC subtypes: A) among the whole population, B) in each subtype population.
RFS in pCR, RCB-I and RCB-II subgroups, while post-NAC TILs had a poor prognostic impact (HR = 1.019, [1.001–1.037]) in the RCB-III subgroup.
Overall survival analyses yielded similar results (Fig 5,Table 4, S4-S6 Tables inS1 File). Together with BC subtype, RCB index was the only independent predictor of survival in the whole population.
Discussion
In this retrospective reanalysis of 717 surgical specimens of BC patients treated with NAC with a long-term follow-up, we confirm the strong prognostic value of the RCB index.
RCB index was first created in 2007 by Symmans and colleagues on a cohort of 241 BC patients who completed NAC [3]. In this study, patients had almost a two-fold increase in relapse risk for each unit of increase in the RCB index and it remained significantly associated with the risk of disease recurrence after multivariate analysis. Though RCB is a composite end-point built upon 6 variables, this index was shown to be highly reproducible. Peintingeret al.
Fig 2. Histograms of the distribution of residual cancer burden (RCB) index in the patients with residual disease at surgery immediately following NAC, in
the whole population (A) and according to phenotype of disease (B). Histograms showing the distribution of nodal status (positive or negative) according to the RCB value, in the whole population (C) and according to the phenotype of disease (D).
retrospectively assessed RCB on a series of 100 pathology slides from BC cases treated by NAC, and the overall concordance was 0.93 (95%CI = 0.91–0.95) after an independent review by five pathologists [15]. However, so far, the prognostic value of the index was evaluated only in small studies ([3,16–22] (S7 Table inS1 File). To the best of our knowledge, we report here the largest fully independent cohort available with a long-term follow-up, with a notably high number of patients with TNBCs.
Fig 3. Associations between RCB classes (pCR to RCB-III) and clinico-pathological variables: A) pre-NAC tumor size, B) Clinical Nodal status at baseline, C) Grade I to II tumors, D) BMI, E) pre-NAC mitotic index, F) Pre-NAC TILs, G) post-NAC LVI, H) pathological nodal involvement, I) post-NAC TILs.
Several findings of our study are of interest.First, in line with the findings of Symmans and
colleagues, we found that the prognosis of patients with RCB-I was not significantly different than the prognosis of patients whose tumor reached pCR (RCB-0). The latter finding confirms that the category of pCR patients, known to be at a very low-risk of relapse, could be extended
Fig 4. Association of RCB classes (pCR to III) with relapse-free survival (RFS): A) whole population (N = 717), B) luminal tumors (N = 222), C) TNBC (N = 319), D) HER2-positive BC (N = 176).
Table 3. Association of clinical and pathological pre and post-NAC parameters with relapse-free survival after univariate and multivariate analysis in the whole population.
Univariate Multivariate Variable Class Number Events HR CI p� p HR CI p
Pre-NAC parameters
Age (years) <45 285 92 1 0.266
45–55 254 67 0.81 [0.59–1.11]
>55 178 46 0.78 [0.55–1.11]
Menopausal status pre 451 127 1 0.796
post 259 74 1.04 [0.78–1.38] BMI 19�BMI�25 414 111 1 0.348 <19 41 11 1.01 [0.54–1.87] >25 261 83 1.23 [0.93–1.64] Tumor size T1 47 13 1 0.027 T2 481 127 0.93 [0.53–1.65] 0.812 T3 189 65 1.41 [0.77–2.55] 0.263
Clinical nodal status N0 282 78 1 0.597
N1-N2-N3 434 127 1.08 [0.81–1.43] Mitotic index �22 389 110 1 0.185 >22 293 90 1.21 [0.91–1.6] Histology NST 660 182 1 0.026 other 53 22 1.65 [1.06–2.57] Grade I-II 211 70 1 0.268 III 490 131 0.85 [0.63–1.13] Ki67 <20% 33 10 1 0.53 �20% 146 51 1.24 [0.63–2.45] Subtype luminal 222 75 1 <0.001 1 - -TNBC 319 102 1.1 [0.82–1.49] 0.523 2,13 [1.54–2.96] <0.001 HER2 176 28 0.46 [0.3–0.71] <0.001 0,92 [0.58–1.45] 0,7 ER status negative 396 112 1 0.516 positive 321 93 0.91 [0.69–1.2] PR status negative 473 135 1 0.26 positive 221 59 0.84 [0.62–1.14]
HER2 status negative 541 177 1 <0.001
positive 176 28 0.43 [0.29–0.65] NAC regimen AC 61 25 1 0.115 AC-Taxanes 576 161 0.66 [0.43–1] Others 80 19 0.58 [0.32–1.06] TILs (continuous) 0,99 [0.98–0.99] 0,002 Post-NAC parameters Nodal involvment 0 445 86 1 <0.001 1–3 188 69 2 [1.45–2.74] <0.001 �4 84 50 3.85 [2.71–5.45] <0.001 RCB class pCR 202 23 1 <0.001 1 - -RCB-I 65 7 0.98 [0.42–2.3] 0.972 1,17 [0.50–2.74] 0.48 RCB-II 309 102 3.25 [2.07–5.11] <0.001 3,38 [2.11–5.39] <0.001 RCB-III 141 73 5.61 [3.51–8.97] <0.001 6,29 [3.73–10.62] <0.001
Interaction term RCB class�BC subtype 0,051
Interaction term RCB class�Post-NAC TILs 0,058
to patients with minimal residual disease.Second, we also confirm the very poor prognosis of
patients with RCB-III disease, particularly in TNBC patients where the post-NAC median RFS barely exceeded one year. The identification of poor-prognosis after NAC is of substantial importance, as data from the CREATE-X and the KATHERINE trials suggest that these patients may benefit from the addition of adjuvant capecitabine [23] in the TNBC subpopula-tion, or adjuvant TDM-1 inHER2-positive BCs respectively [24]. In the latter trials, both sec-ond-line therapies were associated with a decrease of the recurrence risk, nearly reaching 50%.
Finally, patients with RCB-II disease displayed an intermediate prognosis, and it remains
unknown if they would benefit from additional therapies. As they represent 40% of the cohort, further prognostic subsetting using genomic signatures or additional clinical or pathological features should be of particular interest in this group.
In our cohort, RCB index displayed a strong discriminative power in TNBC and
HER2-pos-itive BC but not in luminal BCs, and we identified a trend towards an interaction (Pinteraction=
0.07) between BC subtype and RCB class. However, a pooled meta-analysis of more than 5000 individual RCB data with long-term follow up was recently presented by Symmans and col-leagues [25]. In this study, RCB was significantly associated with BC outcomes, even in the luminal BC subgroup. These results are consistent with a lack of power to detect such differ-ences in our data, where the subgroup of patients with luminal subtype who achieved pCR or RCB-1 only included 29 patients, therefore leading to a low number of events. This finding is also consistent with the well-known fact that BC subtypes respond differentially to NAC [26], and that the prognostic value of pCR is greatest in aggressive tumor subtypes such as TNBC or
HER2-positive BC [1,27] than in luminal BCs. Of note, Symmans and colleagues previously published the SET index signature assaying 165 genes from ER-related transcription. On a cohort of 131 patients with ER+ BC treated with prior neoadjuvant chemotherapy, both the RCB index and the SET index were independently predictive of the distant relapse risk and the elevated endocrine sensitivity was associated with reduced relapse risk when there was less than extensive RCB after chemotherapy [28]. In this context, the validation of the SET index signature in an independent NAC-treated cohort would be of interest.
Last, our study opens new perspectives for further improvement of the RCB index. We recently demonstrated that the presence of lymphovascular invasion (LVI) after NAC was associated with a dramatically impaired relapse-free survival in a BC subtype-dependent man-ner [29], and we show here that this feature adds an independent prognostic information to the RCB in the whole population, and in every BC subtype but luminal BCs. We also previ-ously pointed out an interaction between RCB and the presence of stromal immune infiltra-tion after chemotherapy [30], and identified an impaired prognostic impact of post-NAC TILs in the RCB-III subgroup. As immunotherapy is increasingly becoming part of the therapeutic strategy of breast cancer [31–35], the combination of both patterns could be an efficient tool to select poor-prognostic patients likely to benefit from such innovative treatments [9].
Table 3. (Continued)
Univariate Multivariate Variable Class Number Events HR CI p� p HR CI p
LVI no 500 108 1 <0.001 1 -
-yes 148 75 2.76 [2.06–3.71] <0.001 1,55 [1.15–2.08] 0,004
TILs (continuous) 1,01 [0.99–1.02] 0,311
Abbreviations: pCR = pathological complete response; BMI = body mass index; NST = no special type; ER = oestrogen receptor; PR = progesterone receptor; NAC = neoadjuvant chemotherapy; AC = anthracyclines; TILs = tumor infiltrating lymphocytes; RCB = residual cancer burden; LVI = lymphovascular invasion.
Fig 5. Association of RCB classes (0 to III) with overall survival (OS): A) whole population (N = 717), B) luminal tumors (N = 222), C) TNBC (N = 319), D) HER2-positive BC (N = 176).
Table 4. Association of clinical and pathological pre and post-NAC parameters with overall survival after univariate and multivariate analysis in the whole population.
Univariate Multivariate Variable Class Number Events HR CI p� p HR CI p
Pre-NAC parameters
Age (years) <45 285 57 1 0.514
45–55 254 48 0.96 [0.65–1.41]
>55 178 28 0.77 [0.49–1.21]
Menopausal status pre 451 80 1 0.457
post 259 51 1.14 [0.8–1.62] BMI 19�BMI�25 414 74 1 0.837 <19 41 8 1.14 [0.55–2.36] >25 261 51 1.1 [0.77–1.58] Tumor size T1 47 8 1 0.007 1 - -T2 481 78 0.92 [0.44–1.91] 0.823 0.74 [0.35–1.55] 0.422 T3 189 47 1.64 [0.77–3.47] 0.197 1.23 [0.57–2.66] 0.594
Clinical nodal status N0 282 48 1 0.463
N1-N2-N3 434 85 1.14 [0.8–1.63] Mitotic index �22 389 64 1 0.014 >22 293 66 1.54 [1.09–2.18] 0.014 Histology ductal 660 121 1 0.65 other 53 11 1.15 [0.62–2.14] Grade I-II 211 36 1 0.291 III 490 94 1.23 [0.84–1.81] Ki67 <20 33 5 1 0.33 �20 146 35 1.59 [0.62–4.07] Subtype luminal 224 19 1 <0.001 1 - -TNBC 311 59 2.77 [1.65–4.65] 0.075 2.7 [1.8–4.05] <0.001 HER2 181 3 0.24 [0.07–0.83] <0.001 0.51 [0.24–1.08] 0.078 ER status negative 396 80 1 0.049 positive 321 53 0.71 [0.5–1] 0.049 PR status negative 473 93 1 0.052 positive 221 33 0.67 [0.45–1] 0.052
HER2 status negative 541 122 1 <0.001
positive 176 11 0.25 [0.13–0.46] <0.001 NAC regimen AC 61 13 1 0.489 AC-Taxanes 576 110 0.96 [0.54–1.72] Others 80 10 0.65 [0.29–1.49] TILs (continuous) 0,99 [0.98–0.99] 0,01 Post-NAC parameters Nodal involvment 0 445 51 1 <0.001 1–3 188 46 2.1 [1.41–3.13] <0.001 �4 84 36 4.24 [2.76–6.5] <0.001 RCB class pCR 202 12 1 <0.001 1 - -RCB-I 65 2 0.55 [0.12–2.45] 0.43 0.75 [0.17–3.38] 0.711 RCB-II 309 68 3.85 [2.09–7.12] <0.001 4.17 [2.21–7.86] <0.001 others 141 51 6.59 [3.51–12.37] <0.001 6.6 [3.28–13.27] <0.001 LVI no 500 66 1 <0.001 1 - -yes 148 55 3.07 [2.15–4.39] <0.001 1.76 [1.21–2.57] 0.003 (Continued )
Supporting information
S1 File.
(PDF)
Author Contributions
Conceptualization: Anne-Sophie Hamy, Enora Laas, Fabien Reyal.
Data curation: Anne-Sophie Hamy, Lauren Darrigues, Enora Laas, Clemence Evrevin, Sonia
Rozette.
Formal analysis: Anne-Sophie Hamy, Lauren Darrigues, Enora Laas, Diane De Croze, Lucian
Topciu, Giang-Thanh Lam, Florence Lerebours, Jean-Yves Pierga, Marie Osdoit, Matthieu Faron, Jean-Guillaume Feron, Marick Lae´, Fabien Reyal.
Funding acquisition: Anne-Sophie Hamy. Investigation: Anne-Sophie Hamy.
Methodology: Anne-Sophie Hamy, Enora Laas, Fabien Reyal. Project administration: Anne-Sophie Hamy, Fabien Reyal. Resources: Anne-Sophie Hamy.
Software: Anne-Sophie Hamy, Enora Laas.
Supervision: Anne-Sophie Hamy, Enora Laas, Fabien Reyal. Validation: Anne-Sophie Hamy, Enora Laas, Fabien Reyal. Visualization: Anne-Sophie Hamy.
Writing – original draft: Anne-Sophie Hamy, Lauren Darrigues.
Writing – review & editing: Anne-Sophie Hamy, Lucie Laot, Fabien Reyal.
References
1. Cortazar P., Zhang L., Untch M., Mehta K., Costantino J.P., Wolmark N., et al. (2014). Pathological complete response and long-term clinical benefit in breast cancer: the CTNeoBC pooled analysis. Lan-cet 384, 164–172.https://doi.org/10.1016/S0140-6736(13)62422-8PMID:24529560
2. Hatzis C., Gould R.E., Zhang Y., Abu-Khalaf M., Chung G., Sanft T., et al. (2013). Abstract P6-06-37: Predicting improvements in survival based on improvements in pathologic response rate to neoadjuvant chemotherapy in different breast cancer subtypes. Cancer Res 73, P6-06-37-P6-06–37.
3. Symmans W.F., Peintinger F., Hatzis C., Rajan R., Kuerer H., Valero V., et al. (2007). Measurement of Residual Breast Cancer Burden to Predict Survival After Neoadjuvant Chemotherapy. Journal of Clini-cal Oncology 25, 4414–4422.https://doi.org/10.1200/JCO.2007.10.6823PMID:17785706
4. Hylton N.M., Gatsonis C.A., Rosen M.A., Lehman C.D., Newitt D.C., Partridge, et al. (2016). Neoadju-vant Chemotherapy for Breast Cancer: Functional Tumor Volume by MR Imaging Predicts
Recurrence-Table 4. (Continued)
Univariate Multivariate Variable Class Number Events HR CI p� p HR CI p
TILs (continuous) 0,99 [0.99–1.02] 0,329
Abbreviations: pCR = pathological complete response; BMI = body mass index; NST = no special type; ER = oestrogen receptor; PR = progesterone receptor; NAC = neoadjuvant chemotherapy; AC = anthracyclines; TILs = tumor infiltrating lymphocytes; RCB = residual cancer burden; LVI = lymphovascular invasion.
free Survival-Results from the ACRIN 6657/CALGB 150007 I-SPY 1 TRIAL. Radiology 279, 44–55. https://doi.org/10.1148/radiol.2015150013PMID:26624971
5. Martı´n M., Chaco´ n J.I., Anto´n A., Plazaola A., Garcı´a-Martı´nez E., Seguı´ M.A., et al. (2017). Neoadju-vant Therapy with Weekly Nanoparticle Albumin-Bound Paclitaxel for Luminal Early Breast Cancer Patients: Results from the NABRAX Study (GEICAM/2011-02), a Multicenter, Non-Randomized, Phase II Trial, with a Companion Biomarker Analysis. Oncologist.
6. Cureton E.L., Yau C., Alvarado M.D., Krontiras H., Ollila D.W., Ewing C.A., et al. (2014). Local Recur-rence Rates are Low in High-Risk Neoadjuvant Breast Cancer in the I-SPY 1 Trial (CALGB 150007/ 150012; ACRIN 6657). Ann Surg Oncol 21, 2889–2896.https://doi.org/10.1245/s10434-014-3721-7 PMID:24788555
7. Jeruss J.S., Mittendorf E.A., Tucker S.L., Gonzalez-Angulo A.M., Buchholz T.A., Sahin A.A., et al. (2008a). Staging of Breast Cancer in the Neoadjuvant Setting. Cancer Res 68, 6477–6481.
8. Mittendorf E.A., Vila J., Tucker S.L., Chavez-MacGregor M., Smith B.D., Symmans W.F., et al. (2016). The Neo-Bioscore Update for Staging Breast Cancer Treated With Neoadjuvant Chemotherapy: Incor-poration of Prognostic Biologic Factors Into Staging After Treatment. JAMA Oncol 2, 929–936.https:// doi.org/10.1001/jamaoncol.2015.6478PMID:26986538
9. Bossuyt V., Provenzano E., Symmans W.F., Boughey J.C., Coles C., Curigliano G., et al. (2015). Rec-ommendations for standardized pathological characterization of residual disease for neoadjuvant clini-cal trials of breast cancer by the BIG-NABCG collaboration. Ann. Oncol. 26, 1280–1291.https://doi. org/10.1093/annonc/mdv161PMID:26019189
10. Hamy A.-S., Pierga J.-Y., Sabaila A., Laas E., Bonsang-Kitzis H., Laurent C., et al. (2017). Stromal lym-phocyte infiltration after neoadjuvant chemotherapy is associated with aggressive residual disease and lower disease-free survival in HER2-positive breast cancer. Ann. Oncol. 28, 2233–2240.https://doi. org/10.1093/annonc/mdx309PMID:28911063
11. Harvey J.M., Clark G.M., Osborne C.K., and Allred D.C. (1999). Estrogen receptor status by immuno-histochemistry is superior to the ligand-binding assay for predicting response to adjuvant endocrine therapy in breast cancer. J. Clin. Oncol. 17, 1474–1481.https://doi.org/10.1200/JCO.1999.17.5.1474 PMID:10334533
12. Wolff A.C., Hammond M.E.H., Schwartz J.N., Hagerty K.L., Allred D.C., Cote R.J., et al. (2007). Ameri-can Society of Clinical Oncology/College of AmeriAmeri-can Pathologists guideline recommendations for human epidermal growth factor receptor 2 testing in breast cancer. J. Clin. Oncol. 25, 118–145.https:// doi.org/10.1200/JCO.2006.09.2775PMID:17159189
13. van Buuren S. and Groothuis-Oudshoorn K. (2011). mice: Multivariate Imputation by Chained Equa-tions in R. Journal of Statistical Software 45, 1–67.
14. R Foundation for Statistical Computing (2009). R Development Core Team. R: A Language and Envi-ronment for Statistical Computing.
15. Peintinger F., Sinn B., Hatzis C., Albarracin C., Downs-Kelly E., Morkowski J., et al. (2015). Reproduc-ibility of Residual Cancer Burden For Prognostic Assessment of Breast Cancer After Neoadjuvant Che-motherapy. Mod Pathol 28, 913–920.https://doi.org/10.1038/modpathol.2015.53PMID:25932963
16. Campbell J.I., Yau C., Krass P., Moore D., Carey L.A., Au A., et al. (2017). Comparison of residual can-cer burden, American Joint Committee on Cancan-cer staging and pathologic complete response in breast cancer after neoadjuvant chemotherapy: results from the I-SPY 1 TRIAL (CALGB 150007/150012; ACRIN 6657). Breast Cancer Res. Treat. 165, 181–191.https://doi.org/10.1007/s10549-017-4303-8 PMID:28577078
17. Cockburn A., Yan J., Rahardja D., Euhus D., Peng Y., Fang Y., et al. (2014). Modulatory effect of neoadjuvant chemotherapy on biomarkers expression; assessment by digital image analysis and rela-tionship to residual cancer burden in patients with invasive breast cancer. Hum. Pathol. 45, 249–258. https://doi.org/10.1016/j.humpath.2013.09.002PMID:24289969
18. Corben A.D., Abi-Raad R., Popa I., Teo C.H.Y., Macklin E.A., Koerner F.C., et al. (2013). Pathologic Response and Long-Term Follow-up in Breast Cancer Patients Treated With Neoadjuvant Chemother-apy: A Comparison Between Classifications and Their Practical Application. Archives of Pathology & Laboratory Medicine 137, 1074–1082.
19. Lee S.M., Bae S.K., Kim T.H., Yoon H.K., Jung S.J., Park J.S., et al. (2014). Value of 18F-FDG PET/CT for early prediction of pathologic response (by residual cancer burden criteria) of locally advanced breast cancer to neoadjuvant chemotherapy. Clin Nucl Med 39, 882–886.https://doi.org/10.1097/RLU. 0000000000000531PMID:25072926
20. Romero A., Garcı´a-Sa´ enz J.A., Fuentes-Ferrer M., Lo´pez Garcia-Asenjo J.A., Furio´ V., Roma´n J.M., et al. (2013). Correlation between response to neoadjuvant chemotherapy and survival in locally advanced breast cancer patients. Ann. Oncol. 24, 655–661.https://doi.org/10.1093/annonc/mds493 PMID:23104719
21. Sheri A., Smith I.E., Johnston S.R., A’Hern R., Nerurkar A., Jones R.L., et al. (2015). Residual prolifer-ative cancer burden to predict long-term outcome following neoadjuvant chemotherapy. Ann. Oncol. 26, 75–80.https://doi.org/10.1093/annonc/mdu508PMID:25361988
22. Symmans W.F., Wei C., Gould R., Yu X., Zhang Y., Liu M., et al. (2017). Long-Term Prognostic Risk After Neoadjuvant Chemotherapy Associated With Residual Cancer Burden and Breast Cancer Sub-type. J. Clin. Oncol. 35, 1049–1060.https://doi.org/10.1200/JCO.2015.63.1010PMID:28135148
23. Masuda N., Lee S.-J., Ohtani S., Im Y.-H., Lee E.-S., Yokota I., et al. (2017). Adjuvant Capecitabine for Breast Cancer after Preoperative Chemotherapy. New England Journal of Medicine 376, 2147–2159. https://doi.org/10.1056/NEJMoa1612645PMID:28564564
24. von Minckwitz G., Huang C.-S., Mano M.S., Loibl S., Mamounas E.P., Untch M., et al. (2019). Trastuzu-mab Emtansine for Residual Invasive HER2-Positive Breast Cancer. N. Engl. J. Med. 380, 617–628. https://doi.org/10.1056/NEJMoa1814017PMID:30516102
25. Yau C., van der Noordaa M., Wei J., Osdoit M., Reyal F., Hamy A.-S., et al. (2019). Residual cancer bur-den after neoadjuvant therapy and long-term survival outcomes in breast cancer: A multi-center pooled analysis. SABCS Abstract, GS5-01.
26. Rouzier R., Perou C.M., Symmans W.F., Ibrahim N., Cristofanilli M., Anderson K., et al. (2005). Breast cancer molecular subtypes respond differently to preoperative chemotherapy. Clin. Cancer Res. 11, 5678–5685.https://doi.org/10.1158/1078-0432.CCR-04-2421PMID:16115903
27. von Minckwitz G., Untch M., Blohmer J.-U., Costa S.D., Eidtmann H., Fasching P.A., et al. (2012). Defi-nition and impact of pathologic complete response on prognosis after neoadjuvant chemotherapy in var-ious intrinsic breast cancer subtypes. J. Clin. Oncol. 30, 1796–1804.https://doi.org/10.1200/JCO. 2011.38.8595PMID:22508812
28. Symmans W.F., Hatzis C., Sotiriou C., Andre F., Peintinger F., Regitnig P., et al. (2010). Genomic Index of Sensitivity to Endocrine Therapy for Breast Cancer. JCO 28, 4111–4119.
29. Hamy A.-S., Lam G.-T., Laas E., Darrigues L., Balezeau T., Guerin J., et al. (2018). Lymphovascular invasion after neoadjuvant chemotherapy is strongly associated with poor prognosis in breast carci-noma. Breast Cancer Res. Treat. 169, 295–304.https://doi.org/10.1007/s10549-017-4610-0PMID: 29374852
30. Hamy A.-S., Bonsang-Kitzis H., Croze D.D., Laas E., Darrigues L., Topciu L., et al. (2019). Interaction between molecular subtypes, stromal immune infiltration before and after treatment in breast cancer patients treated with neoadjuvant chemotherapy. Clin Cancer Res clincanres.3017.2018.
31. Emens L.A. (2018). Breast Cancer Immunotherapy: Facts and Hopes. Clin Cancer Res 24, 511–520. https://doi.org/10.1158/1078-0432.CCR-16-3001PMID:28801472
32. Loi S., Dushyanthen S., Beavis P.A., Salgado R., Denkert C., Savas P., et al. (2016). RAS/MAPK Acti-vation Is Associated with Reduced Tumor-Infiltrating Lymphocytes in Triple-Negative Breast Cancer: Therapeutic Cooperation Between MEK and PD-1/PD-L1 Immune Checkpoint Inhibitors. Clin Cancer Res 22, 1499–1509.https://doi.org/10.1158/1078-0432.CCR-15-1125PMID:26515496
33. McArthur H.L., Diab A., Page D.B., Yuan J., Solomon S.B., Sacchini V., et al. (2016). A Pilot Study of Preoperative Single-Dose Ipilimumab and/or Cryoablation in Women with Early-Stage Breast Cancer with Comprehensive Immune Profiling. Clin Cancer Res 22, 5729–5737. https://doi.org/10.1158/1078-0432.CCR-16-0190PMID:27566765
34. Nanda R., Liu M.C., Yau C., Asare S., Hylton N., Veer L.V., et al. (2017). Pembrolizumab plus standard neoadjuvant therapy for high-risk breast cancer (BC): Results from I-SPY 2. JCO 35, 506–506.
35. Vonderheide R.H., LoRusso P.M., Khalil M., Gartner E.M., Khaira D., Soulieres D., et al. (2010). Treme-limumab in Combination with Exemestane in Patients with Advanced Breast Cancer and Treatment-Associated Modulation of Inducible Costimulator Expression on Patient T Cells. Clin Cancer Res 16, 3485–3494.https://doi.org/10.1158/1078-0432.CCR-10-0505PMID:20479064