HAL Id: halshs-02950885
https://halshs.archives-ouvertes.fr/halshs-02950885
Submitted on 28 Sep 2020
HAL is a multi-disciplinary open access archive for the deposit and dissemination of sci-entific research documents, whether they are pub-lished or not. The documents may come from teaching and research institutions in France or abroad, or from public or private research centers.
L’archive ouverte pluridisciplinaire HAL, est destinée au dépôt et à la diffusion de documents scientifiques de niveau recherche, publiés ou non, émanant des établissements d’enseignement et de recherche français ou étrangers, des laboratoires publics ou privés.
Women’s benefits and harms trade-offs in breast cancer
screening. Results from a discrete choice experiment
Jonathan Sicsic, Nathalie Pelletier-Fleury, Nora Moumjid
To cite this version:
Jonathan Sicsic, Nathalie Pelletier-Fleury, Nora Moumjid. Women’s benefits and harms trade-offs in breast cancer screening. Results from a discrete choice experiment. Value in Health, Elsevier, 2018, 21 (1), pp.78-88. �10.1016/j.jval.2017.07.003�. �halshs-02950885�
1
Women’s benefits and harms trade-offs in breast cancer screening.
Results from a discrete choice experiment
Jonathan Sicsic1,2,4*, PhD ; Nathalie Pelletier-Fleury2, MD,PhD ; Nora Moumjid1,3,4,PhD
Corresponding author *: Jonathan Sicsic
Email : jonathan.sicsic@inserm.fr (postdoctoral researcher at the time of study writing1)
Address: Centre Leon Berard. 28, rue Laennec, 69008 Lyon, France
Authors’ affiliations
1 Centre Léon Bérard, Cancer environnement team, Lyon, France
2 CESP, Univ. Paris-Sud, UVSQ, INSERM, Univ. Paris-Saclay, 94805, Villejuif, France 3 University Claude Bernard, Lyon 1, France
4 HESPER EA 7425, Lyon, France
Financial support for this study was provided by the French National Institute of Cancer (INCa). The funding agreement ensured the authors’ independence in designing the study, interpreting the data, writing, and publishing the report.We would like to thank women who kindly accepted to participate to the focus groups or individual interviews. We also thank the three anonymous reviewers for helpful comments on the paper.
Reference
This paper was published in Value in Health (available online 18 August 2017). This is the last version before proofs. The final edited version (in press, corrected proof) is available at: http://www.sciencedirect.com/science/article/pii/S1098301517303248.
1 Current affiliation and position: LIRAES (EA4470), department of Humanities and Social Sciences, University of Paris, 45 rue des Saints-Pères, 75006 Paris (assistant professor). jonathan.sicsic@u-paris.fr
2 ABSTRACT
Background: Over the past decade, the benefits and harms balance of breast cancer (BC) screening has been widely debated. We aimed to elicit women’s trade-offs between the benefits and harms of BC screening and to analyse the main determinants of these trade-offs. Methods: A discrete choice experiment with seven attributes depicting BC screening programmes including varying levels of BC mortality, overdiagnosis, and false-positive result. Eight hundred and twelve women aged 40-74 years with no personal history of BC recruited by a survey institute and representative of the French general population (age, socioeconomic level, and geographical location) completed the discrete choice experiment. Preference heterogeneity was investigated using generalized multinomial logit models from which individual trade-offs were derived, and their main determinants were assessed using generalized linear models. Screening acceptance rates under various benefits and harms ratio were simulated on the basis of the distribution of individual preferences.
Results: The women would be willing to accept on average 14.1 overdiagnosis cases (median = 9.6) and 47.8 women with a false-positive result (median = 27.2) to avoid one BC-related death. After accounting for preference heterogeneity, less than 50% of women would be willing to accept 10 overdiagnosis cases for one BC-related death avoided. Screening acceptance rates were higher among women with higher socio-economic level and lower among women with poor health.
Conclusions: Women are sensitive to both the benefits and harms of BC screening and their preferences are highly heterogeneous. Our study provides useful results for public health authorities and clinicians willing to improve their recommendations of BC screening based on women's preferences.
Key words: benefits and harms balance; breast cancer screening; discrete choice experiment; overdiagnosis; preference heterogeneity; willingness to accept
3
1. INTRODUCTION
Breast cancer (BC) is one of the leading causes of death per cancer around the world. Studies published in the mid-90s showed that early detection through screening plays an important role in reducing the morbidity and mortality of cancer [1,2]. Until recently, the effectiveness of screening mammography has been widely acknowledged and national screening programmes were initiated in most developed countries, where health authorities have relied on similar recommendations, i.e. a screening periodicity of 2-3 years among women aged 45 or 50 years to 69 or 74 years [3–5]. Much of the research to date has focused on assessing the cost-effective level of BC screening uptake or evaluating interventions to increase BC screening participation [6,7]. In 2012, only 9 of the 26 European programmes had achieved the desirable level of 75% participation rate [4] and in France, only 62% of eligible women (i.e. aged 50-74 years) had received a mammogram in the past two years according to recommendations [8]. In France as in many OECD countries, a national programme for BC has been implemented: women aged 50-74 years are mailed an invitation to receive a “free” mammogram in a local screening centre. They can also be screened outside the national programme after doctor’s prescription (opportunistic screening) and in practice, women with one or more risk factors can be prescribed a mammogram by their GP or gynaecologist from 40 years.
However, there has been a large debate regarding the benefits and harms of BC screening [9– 13] and it has been argued that harms have not been given equal attention compared to benefits in scientific articles [14]. Particularly, overdiagnosis and false-positive mammography are well documented harms [15]. Overdiagnosis usually refers to the diagnosis and treatment of ductal carcinoma in situ (i.e. non-invasive breast cancer) that may not have become life-threatening [12]. In reality, the diagnosis process appears into detection, diagnosis, and treatment, thus potentially leading to overdetection, overdiagnosis, and overtreatment. Overtreatment is a direct consequence of overdiagnosis, and it is the focus of our study. Estimations of the prevalence of overdiagnosis varies according to the studies, ranging from less than 1 overdiagnosis to more than 10 overdiagnosis cases per BC death prevented [11,13,15]. Another harm of screening is false-positive mammography [12,13] resulting in both unnecessary biopsies and increased distress and anxiety related to a possible diagnosis of cancer [16]. Estimated 10-year cumulative risk of false-positive mammography varies from 4.8% to 9.4% depending on age at first screen and screening interval [17].
4 Despite these debates, little is known about women’s preferences and the following questions remain unsolved: what are women’s trade-offs between the benefits and harms of mammography? How these trade-offs vary according to women and what are their main determinants? Analysing women’s preferences for BC screening using a discrete choice experiment (DCE) could bridge this gap. In the past ten years, DCEs have been increasingly used in healthcare research to investigate patients, public, and health professionals’ preferences for medical procedures or treatments [18,19]. The DCE methodology was applied to analyse public preferences for cancer screening programmes, with a majority of studies on colorectal cancer screening [20–22] and three studies on BC screening [23–25]. The results of these studies allowed prioritisation of cancer screening attributes such as mortality risk reduction, waiting time or out-of-pocket costs, and to estimate the willingness to pay for reducing cancer mortality risk [23]. Yet, important attributes characterizing BC screening have not been taken into account such as the risk of additional invasive examinations (i.e. false-positive mammography) and additional treatments related to overdiagnosis.
Using a DCE based on a representative sample of French women, this study aimed to measure women’s preferences for BC screening programmes and to estimate for the first time their trade-offs between the benefits and harms of mammography. As a “one size fits all” approach of women preferences can be a suboptimal way of designing screening services, another objective was to account for preference heterogeneity and to analyse their main determinants using socio-demographic, health, and attitudinal variables collected from the survey.
2. METHODS
2.1/The discrete choice experiment
In a discrete choice experiment (DCE), participants are asked to make choices between several hypothetical scenarios offering different combinations of attributes in order to infer their preferences for each attribute independently [26]. The first step consists in selecting attributes and levels, the second step is choosing an appropriate design for building the choice scenarios and the third step is sampling respondents and collecting data.
5 2.1.1 Selection of attributes and levels
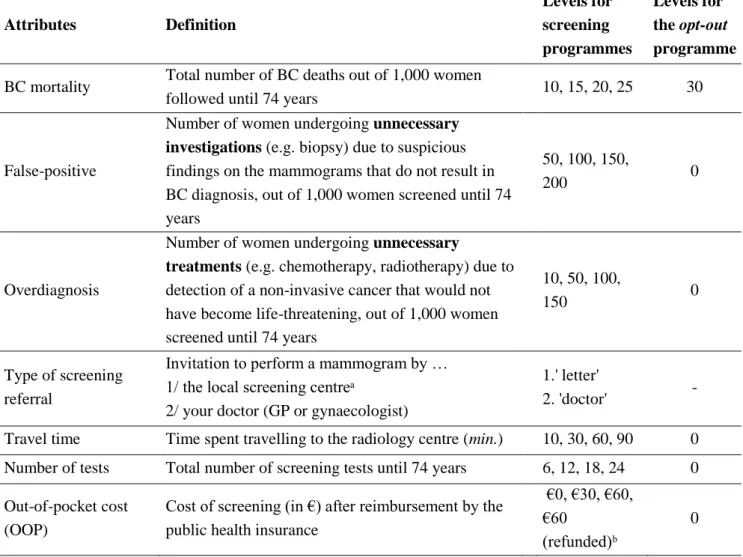
The selection of attributes and levels for BC screening was based on two complementary stages: a literature review and a qualitative phase including two focus groups (with a total of 8 participants) and 7 semi-structured interviews. The 15 participants were recruited in Lyon and Paris area between October and December, 2015. A thematic analysis of responses was conducted based on audio recording and written notes of meetings and interviews [27–29]. The thematic analysis of responses focused on themes related to the perceived advantages and drawbacks of mammography as well as women’s experience and knowledge of BC screening. We identified seven BC screening attributes to include in the hypothetical screening programmes (Table 1): BC mortality, false-positive mammography, overdiagnosis, type of screening referral, number of screening tests, time spent travelling, and out of pocket cost (see supplementary file 1 for detailed presentation of attributes as shown to respondents). The analysis on the information presented in decision aids or in the medical literature [15,30,31] allowed us to define plausible levels for BC mortality, false-positive, and overdiagnosis. Except for the prescribing physician, all attributes were expected to have negative impacts on the utility derived from the screening programme. For instance, increasing the number of false-positive mammography in a screening programme would decrease the probability of women choosing this programme. The impact of doctors’ prescription as compared to receiving an invitation letter from the local screening centre was not clear a priori. On the one hand, results of qualitative interviews indicated that women relied on their doctors’ recommendation to perform BC screening, which would suggest a preference towards doctors’ prescription. On the other hand, prescription of a mammogram implies consulting a doctor, which may have both time and monetary opportunity costs.
2.1.2. Design of the choice scenarios
The seven attributes and their levels would allow 8192 unique attribute combinations (alternatives) in a full factorial design. A main effects D-efficient design was generated using the techniques developed by Street and Burgess [32] to reduce this design to a more pragmatic 16 choice scenarios allowing independent estimation of preference weights. A pairwise choice format with an opt-out was selected, i.e. respondents were given a choice between two hypothetical screening programmes and a ‘no screening’ programme. Indeed, this format better mimics decisions women face in real life and allows accounting for non-demanders of BC screening [33]. The design was then divided into two blocks or versions, each containing
6 a total of 8 choice scenarios for presentation to respondents (see Figure 1 for an example of a choice scenario). Respondents were randomly allocated to each version and the order of choice scenarios was randomly varied from one respondent to another.
2.1.3. Sampling respondents and collecting data
The inclusion criteria for this study were to be a woman aged between 40 and 74 years, with no history of BC. Indeed, although only women aged 50-74 years are targeted by the French national BC screening programme, women with one or more risk factors can be prescribed a mammogram by their GP/gynaecologist from 40 years.
The DCE was included in an online survey sent to a listing of representative sample of women using the quota sampling method based on age, socio-professional category, and geographical location distribution. Respondents could attain the questionnaire by clicking on a link that was included in an e-mail containing no information about the survey. The women were recruited by a survey institute. The questionnaire took about 15 minutes to be completed, and respondents were offered a €3 voucher for their participation. The target objective was to obtain about 800 completed questionnaires. This number was calculated using Orme’s approximate formulae for DCE sample size [34] (see, e.g. Bekker-Grob et al, 2015, for a comparison of sample size requirements for DCEs in health care). With eight choice tasks, three alternatives per choice task, and a maximum of five different levels per attribute, the required sample size would be 104 respondents. We then arbitrarily multiplied this minimum requirement by 8 to obtain a sample robust to individuals' idiosyncrasies and allowing for investigation of variability in preferences.
The questionnaire started with a short introduction on the background of the research study and an explanation of what the questionnaire would involve (including a practical example, i.e. a warm-up task describing literally the consequences of women’s choices for each possible alternative). The first section of the questionnaire contained the discrete choice experiment. The second section consisted of background information regarding sociodemographics, health status and health care use, and attitudinal questions related to BC screening (e.g. ‘I think it is my duty to attend for regular mammogram’) using Likert-scales statements with 5 levels (‘Strongly disagree’, ‘Disagree’, ‘Agree’, ‘Strongly agree’, ‘I don’t know’). Before launching the survey, a pre-test survey was conducted among twenty women to check the respondents’ understanding of the attributes and their levels, as well as the
7 questionnaire in general. One result of their feedback was to add the practical example and to give the opportunity to check the exhaustive definition of some attributes (e.g. overdiagnosis and false-positive mammography) at any time during completion of the DCE.
2.1.4. Ethics approval
All precautions were taken to ensure anonymity of the data, in agreement with the CNIL (Commission Nationale de l’Informatique et des Libertés, French law no. 78-17). According to the French law, written informed consent was not required for this type of study. This study was approved by our local Institutional Review Board.
2.2/ Analysis of mean preferences
The DCE data were analysed within a random utility maximization framework [35,36]. In order to estimate the mean preferences of the sample while taking into account the non-independence of the data provided by the same respondent and the non-non-independence of alternatives in a choice set, the empirical model to be estimated was an error component (EC) model [37,38] specified as follows:
𝑈𝑛𝑗𝑡= 𝛼0𝑛𝐴𝑆𝐶𝑆𝑐𝑟𝑒𝑒𝑛+ 𝛼1𝑛𝐴𝑆𝐶𝐴𝑙𝑡𝐴+ 𝛽′𝑥𝑗𝑡+ 𝜖𝑛𝑗𝑡
where 𝑈𝑛𝑗𝑡is the utility woman n derives from choosing alternative j in choice scenario t, 𝐴𝑆𝐶𝑆𝑐𝑟𝑒𝑒𝑛 is a generic screening intercept entering the utility function of the two screening
alternatives, with 𝛼0𝑛 the associated coefficient assumed normally distributed, representing the individual systematic tendency to choose to be screened, 𝐴𝑆𝐶𝐴𝑙𝑡𝐴 is an alternative-specific shift dummy only entering the utility function of alternative A, with 𝛼1𝑛 the associated
coefficient assumed normally distributed, representing the individual systematic tendency to choose the screening alternative A, 𝑥𝑗𝑡 is the vector of attributes levels of alternative j in choice situation t, 𝛽′ is the vector of preferences weights reflecting the desirability of the attributes, and 𝜖𝑛𝑗𝑡 is an error term assumed independent and identically distributed (iid) as
extreme value. We used Stata’s mixlogit command to estimate the EC model using 5000 halton draws to simulate the log-likelihood of the sample. The assumed threshold for statistical significance was 5%.
8 In discrete choice models, trade-offs between attributes are quantified using marginal rates of substitution (MRS), measuring what amount of an attribute individuals are willing to trade against a decrease in another attribute. For instance, the MRS between overdiagnosis and BC mortality can be interpreted as the number of overdiagnosis cases the women are willing to accept to decrease BC mortality by one unit, that is, to avoid one BC-related death. Thus, the MRS is interpreted as a willingness-to-accept (WTA) and also represents women’s benefits and harms trade-off. In line with our study objectives, we focused on two WTA measures: the WTA overdiagnosis and the WTA false-positive mammography. The two WTA measure were derived from the results of the EC models and confidence intervals were calculated using the delta method [39].
2.3/ Analysis of preference heterogeneity
2.3.1. Estimation of individual-specific WTA
In the EC model an implicit assumption is made that all women make the same trade-offs between attributes. This assumption can be misleading since women may weigh the benefits and harms of BC screening differently depending on both observed and unobservable characteristics. In this section we investigate the distribution of women’s benefits and harm trade-offs based on individual WTA estimates. We used the Generalized Multinomial Logit Model (GMNL) framework using a parameterization in WTA-space allowing direct estimation of WTA parameters’ distribution [40,41]. The main contribution of the GMNL model is the inclusion of a scale parameter, capturing (but not disentangling [42]) correlation between attributes and variation of randomness in the decision-making process from one respondent to another. Accounting for scale heterogeneity is especially relevant for stated preference data, where respondents can pay attention and interpret choice situations differently [43]. Specification and estimation of the GMNL-WTA-space models are further detailed in Appendix 1. Because of the panel nature of data (i.e. multiple choices per women), the empirical bayes estimator was used to recover subject-specific trade-offs [38].
2.3.2. Determinants of individual trade-offs
Based on the results of the WTA calculated from the GMNL-WTA-space models, general linear models (GLMs) were performed to model WTA overdiagnosis and WTA false positive variability as a function of 1/ socio-demographics (age, socio-professional category,
9 complementary health insurance status, marital status) 2/ health and healthcare use (self-rated health, regular medical visits to GPs and/or gynaecologists, regularity of BC screening uptake) and 3/ attitudinal variables (fear of BC, perceived level of risk of BC, family history of BC, opinions about mammography and additional exams).
2.3.3. Simulation of screening acceptance as a function of the benefits/harms balance
The inverse-quantile functions of WTA overdiagnosis and WTA false-positive mammography were used to simulate the share of the population willing to accept a screening programme conditional on various levels of overdiagnosis and false-positive mammography. We simulated screening acceptability conditional on plausible values of the benefits/harms ratio as found in the literature, i.e. from 2 to 10 overdiagnosis cases and from 10 to 50 women with a false-positive mammography for one BC death avoided [11–13]. Screening acceptance was simulated in the overall population and conditional on covariates that had a significant impact on WTA in the GLMs described above.
3. RESULTS
3.1/ Description of the study population
The survey was launched between March and April, 2016, until the expected number of completed questionnaires was reached. During this period, about 7,000 e-mails were sent, 2,064 women clicked on the survey link, 1,723 matched the inclusion criteria for the study, and 1,102 entered the quotas set to obtain a representative sample of the French 40-74 years old woman population. Of the 1,102 women who were eligible to continue the survey, 812 completed the whole questionnaire (74% completion rate), 72 women (6%) refused to participate and 218 women (20%) gave incomplete answers or stopped at some point of the questionnaire.
Descriptive statistics of the survey population are presented in Table 2. Overall, 301 (37.1%) of women have 40-49 years and 511 (63.9%) have 50-74 years. Most of women are married or live in a couple, have one or more children, and possess a private complementary health
10 insurance or the CMU-C (income-dependent public complementary insurance2). Overall, 72.3% of women declare a very good or good health, 57.1% have regular follow-up with the GP or the gynaecologist. Regarding screening uptake, 58.3% of women have received a mammogram in the past two years, 26.9% are irregular participants (more than two or four years since last mammogram), and 14.8% never received a mammogram.
Regarding the responses to attitudinal statements, 44.5% of women declare being moderately worried about BC and 11.5% are ‘very’ worried. Compared to women of their age group, most of women (63.9%) consider that they have similar level of risk of getting BC, 10.5% (respectively, 10.7%) consider that they have lower (respectively, higher) chances of getting BC, and only a fifth of women (20.6%) do not know anyone having an history of BC in their family, among their friends or other acquaintance. Overall, 85.2% of women consider that it is their duty to attend for regular mammograms, 48.4% consider that mammograms are troublesome and 22.7% that mammograms are dangerous. In case of suspicious findings on the mammogram, only 8.9% consider it as constraint to do additional investigations such as biopsies, 53.1% consider that it is necessary and 20.2% consider that it is a guarantee of quality.
3.2/ Analysis of mean preferences
The estimation results of the error component model are presented in Table 3. First of all, the generic screening intercept is positive and highly significant (ASCscreen= 9.430, 95%CI
[7.742; 11.096]), showing that women have a propensity to choose to be screened, i.e. they place higher weights on the benefits as compared to the harms of BC screening. There is no significant propensity to choose screening alternative A as compared to screening alternative B (ASCAltA= 0.274 [-0.033; 0.087]) thus indicating that respondents were effectively trading
between the two screening alternatives. All attributes are significant at the 5% level, except the number of tests (only significant at the 10% level) and all the coefficients have the expected sign, i.e. they are negative. The coefficient of the type of screening referral attribute is negative and significant (Referraldoctor= -0.159 [-0.222; -0.095]) indicating a negative
2 In France, private complementary health insurance is generally purchased to cover insurable copayments that are not covered by public health insurance. Below an income threshold that is lower than the poverty line, individuals can benefit from a free complementary health insurance called the CMU-C. Individuals benefiting from the CMU-C can be considered poor.
11 preference towards doctor’s prescription as compared to receiving an invitation from the local screening centre.
The attributes displaying highest negative impact on women’s utility include BC mortality (-1.048 1.265; -0.829] for each additional 10 BC-related deaths), overdiagnosis (-0.075 [-0.091; -0.058] for each additional 10 overdiagnosed cases) and, to a lesser extent, false-positive mammography (-0.022 [-0.036; -0.007] for each additional 10 false-false-positive results). We tested the linearity of preferences by including a second order polynomial function (square term) for the three main attributes of interest (BC mortality, false-positive, overdiagnosis) but the square term was never significant at the 5% level (value=0.108; p-value=0.325; p-value=0.961, respectively3). Having to pay for the mammogram despite being refunded lately (advanced fees) negatively affects BC screening uptake (OOPrefunded= -0.226
[-0.329; -0.121]). The women are also highly sensitive to out-of-pocket costs (OOP), and disutility increases with the level of OOP. On average, the women would be willing to accept 14.1 (95%CI [12.9 to 15.2]) overdiagnosis cases and 47.8 (95%CI [24.9 to 70.8]) false positive results to save one life from breast cancer.
3.3/ Analysis of preference heterogeneity
3.3.1. Distribution of individual WTA
The empirical distribution and cumulative distribution functions of individual WTA estimated from the GMNL models are presented in Figure 2. The WTA values for overdiagnosis and false-positive mammography are log-normally distributed and exhibit a heavy right-hand tail with extreme values4. These heavy tails create a discrepancy between the mean and median WTA: the mean WTA overdiagnosis is 15.5, for a median of 9.6 and the mean WTA false-positive results is 41.5, for a median of 27.2. Computation of 95% credibility intervals show that 95% of women would be willing to accept between 2.3 and 49.2 overdiagnosis cases (respectively, between 6.7 and 127.3 women with a false-positive mammography) to save one life from BC.
3.3.2 Determinants of individual trade-offs
3 Third or forth order polynomials were also not significant at the conventional threshold.
4 These skewed distributions are related to the log-normal distribution assumed. This can be justified by the fact that we allow for respondents not having payed attention to the overdiagnosis or false-positive results attributes (as revealed in the qualitative interviews).
12 The results of GLMs assessing the determinants of WTA variability are displayed in Table 4. The predictors having a significant and positive impact on WTA overdiagnosis include living in Paris, being an executive and being very worried about BC. For instance, executives have a WTA overdiagnosis 26% higher than unemployed women. On the contrary, declaring a fair or poor health is associated to lower WTA: women in poor health have a WTA overdiagnosis 43% lower than women declaring a good or very good health. The predictors of WTA false-positive mammography are the same and also include regular screening uptake (WTA 22% higher than women who never received a mammogram) and positive opinions about additional exams such as biopsies (WTA 16% higher than women having negative opinions about additional exams). We checked for multicollinearity by removing some variables (e.g. occupation, last BC screening uptake) that were assumed to be correlated with other determinants, but it had no significant impact on the final results.
3.3.3. Simulation of screening acceptance as a function of the benefits/harms balance
The simulated shares of women willing to accept a screening programme conditional on various benefits/harms ratios are presented in Table 5. Overall, 73% of women would be willing to accept a screening programme leading to 6 or less overdiagnosis cases for one BC-death avoided, and 48% of women would accept a screening programme leading to 30 or less false-positive mammography for one BC-related death avoided. Screening acceptance is a decreasing function of the number of harms relatively to the benefits, with a minimum of 49% of women willing to accept a 10 to 1 overdiagnosis/BC death avoided ratio and only 29% of women willing to accept a 50 to 1 false-positive mammography/BC death avoided ratio. Screening acceptance varies significantly according to women’s profiles. For instance, among executives, up to 58% (versus 49% overall) of women would accept a 10 to 1 overdiagnosis/BC death avoided ratio and up to 48% (versus 29% overall) of women would accept a 50 to 1 false-positive mammography /BC death avoided ratio. On the contrary, among women declaring a poor health, only 33% of women would accept a 10 to 1 overdiagnosis/BC death avoided ratio.
13
4. DISCUSSION
Summary of findings and comparison with existing literature
Using a DCE to quantify women’s preferences for BC screening we showed that women are sensitive to attributes related to absolute benefits and harms of screening (overdiagnosis and false-positive mammography) as well as organisational features such as the type of the prescribing physician, travel time, and out-of-pocket cost. These results are consistent with previous DCE studies analysing public preferences for screening programmes in various screening contexts [21,23,25,44–46].
Particularly, our study provides evidence that women are willing to trade a decrease in BC mortality against an increase in harms, and vice-versa. For instance, looking at the most controversial measure of harms, i.e. overdiagnosis, the women would be willing to accept on average 14.1 (95%CI [12.9 to 15.2]) overdiagnosis cases to save one life from BC. This figure is higher than the benefits and harms balance estimated in the medical and epidemiological literature, peaking at 10 overdiagnosis cases for one BC death avoided [15]. We also estimated that the women would be willing to accept on average 47.8 (95%CI [24.9 to 70.8]) false positive biopsies to save one life from BC, which is relatively high compared to epidemiological estimates of false-positives rates [17]. These estimates are nonetheless consistent with previous analyses based on focus groups in the UK, showing that many women felt that accepting the offer of BC screening was worthwhile [11].
Another important finding of the study is that preferences are highly heterogeneous. Actually, half of women would be willing to accept less than 9.6 overdiagnosis cases (respectively, less than 27.2 false-positive mammography) to avoid one death from BC. Our predictions of screening acceptance thus show that if a benefits/harms balance of 10 overdiagnosis cases (respectively, 30 women with a false-positive mammography) for one BC death avoided was communicated to women, only 49% (respectively, 48%) of them would accept to be screened. Screening acceptance rates vary according to women’s profiles: living in Paris, being executive or having a high fear of BC increase BC screening acceptance, whereas having a poor health decreases BC screening acceptance. These results are in line with a number of studies showing the influence of socio-economic background [47,48], poor health or disability [48,49], and psychological and motivational factors [50] on cancer screening uptake. They are also in line with the literature showing how important it is to provide a balanced information on both benefits and harms to women through an informed decision-making process taking
14 into account women’s health numeracy and literacy levels [30,51,52]. Such a process is respectful of women’s preferences whatever they are.
Strengths and limitations of the study
To our knowledge, this is the first study to investigate the individual benefits and harms trade-off in mammography screening among a relatively large sample of women. The design of the survey using the quota method ensured that our sample of respondents was representative of the French 40-74 years female population in terms of age, geographical location, and socio-professional category. However, respondents voluntarily accessed the questionnaire, which reduces the generalisability of the results. In supplementary file 2 we analyse the characteristics of non-respondents and show that they are different in terms of age (they are older), socio-professional category (they are more likely to be inactive) and prevention behaviours (they are less likely to have performed a mammogram in the past 2 years. We can conclude that our estimates of benefits and harms trade-offs (willingness to accept) may be higher than what would be obtained from a representative sample of the French 40-74 years female population. A second limitation of the study concerns the lack of information on women’s educational level, which is an important predictor of cancer screening adherence. However, educational norms have changed between the sixties and the eighties as a result of school massification in France. As a consequence, educational level has not the same meaning for women below 50 and women higher than 50 (i.e., there is a cohort effect). For this reason, we preferred to focus on the impact of professional status which is also highly correlated with educational level.
Another limitation of the study concerns the simulations of BC screening acceptance based on WTA estimates, which must be interpreted with caution given the hypothetical nature of the survey. Indeed, hypothetical bias and survey engagement are well-known concerns in the stated preference literature as it may lead to overestimation of willingness-to-pay / willingness-to-accept [53,54]. One possible indicator or consequence of hypothetical bias in our data is the presence of women with extreme preferences, i.e. exhibiting very with high levels of WTA overdiagnosis and WTA false-positive mammography. These extreme WTA may also be explained by women not having payed sufficient attention to the two attributes because of e.g. misunderstanding. Indeed, false-positive and overdiagnosis are complicated medical issues that have proven difficult for respondents to understand in the past [30]. Another possible explanation for the presence of extreme WTP is the influence of
15 “professional respondents” (i.e. individuals only interested in getting the reward for completing the survey) and thus responding with little effort. In practice, these extreme values create a discrepancy between the mean and median WTA values and may potentially lead to erroneous conclusions if not correctly taken into account. In accordance with other authors [55], we decided to not remove women with extreme preferences and large WTA because we could not determine with certainty whether they expressed real preferences or whether they did not engaged sufficiently into the survey. Nonetheless, focusing on the quantiles of the WTA distributions rather than the mean allowed us to mitigate the influence of women with extreme preferences. Despite these precautions, we cannot reject the eventuality of biases (thus careful interpretation is needed) in our predictions of BC screening acceptance rates under different scenarios as a consequence of either 1/ hypothetical bias, 2/ misunderstanding concerning risk attributes, and 3/ health literacy or health numeracy [56]. Further research on these topics is needed in order to improve the reliability of predictions obtained from discrete choice experiments.
Implications for clinicians and policymakers
Results from our study are of potential interest to both a national and international audience. Indeed, the organization of BC screening is similar in most developed countries because health authorities have relied on similar recommendations [3]. In this sense, our results provide guidance to policymakers as well as medical practitioners wishing to align BC screening recommendations with patients’ preferences. Better communication around the benefits and also the harms of BC screening should be achieved so that women make informed choices based on their preferences. Overall, women place higher weights on the benefits as compared to the harms of BC screening. However, there are important disparities among women. For instance, women with lower socio-economic level and/or poor health are less willing to accept screening programmes for a similar benefits/harms ratio. As women’s preferences determine their demand of preventive services, public policies aimed at modifying behaviours (e.g.. increasing prevention and screening behaviours) among specific subgroups such as less-educated or disadvantaged individuals should also focus on modifying their preferences. Further study should try and understand why individuals with different socio-economic background and health status have different preferences and how these preferences relate to information and health care access.
16 Conclusion
Women are sensitive to both the benefits and harms of BC screening. They are willing to trade a decrease in BC mortality against an increase in harms (overdiagnosis, and false-positive mammography), and their preferences are highly heterogeneous. Our study provides useful results for both public health authorities and healthcare professionals who want to provide information on BC screening based not only on scientific evidence, but also on women's preferences.
17
References
[1] Kerlikowske K, Grady D, Rubin SM, Sandrock C, Ernster VL. Efficacy of screening mammography. A meta-analysis. JAMA 1995;273:149–54.
[2] Walter LC, Lewis CL, Barton MB. Screening for colorectal, breast, and cervical cancer in the elderly: a review of the evidence. Am J Med 2005;118:1078–86. doi:10.1016/j.amjmed.2005.01.063.
[3] Oeffinger KC, Fontham EH, Etzioni R, et al. Breast cancer screening for women at average risk: 2015 guideline update from the american cancer society. JAMA 2015;314:1599–614. doi:10.1001/jama.2015.12783.
[4] Giordano L, von Karsa L, Tomatis M, Majek O, de Wolf C, Lancucki L, et al. Mammographic screening programmes in Europe: organization, coverage and participation. J Med Screen 2012;19 Suppl 1:72–82. doi:10.1258/jms.2012.012085. [5] Hofvind S, Geller B, Vacek PM, Thoresen S, Skaane P. Using the European guidelines
to evaluate the Norwegian Breast Cancer Screening Program. Eur J Epidemiol 2007;22:447. doi:10.1007/s10654-007-9137-y.
[6] Sabatino SA, Lawrence B, Elder R, Mercer SL, Wilson KM, DeVinney B, et al. Effectiveness of interventions to increase screening for breast, cervical, and colorectal cancers: nine updated systematic reviews for the guide to community preventive services. Am J Prev Med 2012;43:97–118. doi:10.1016/j.amepre.2012.04.009.
[7] Bonfill X, Marzo M, Pladevall M, Martí J, Emparanza JI. Strategies for increasing women participation in community breast cancer screening. Cochrane Database Syst Rev 2001:CD002943. doi:10.1002/14651858.CD002943.
[8] National Institute for Health Surveillance. BEH Special issue - The French breast cancer screening programme. 2012:n°35-36-37.
[9] Marmot MG, Altman DG, Cameron DA, Dewar JA, Thompson SG, Wilcox M. The benefits and harms of breast cancer screening: an independent review. Br J Cancer 2013;108:2205–40. doi:10.1038/bjc.2013.177.
[10] Pace LE, Keating NL. A systematic assessment of benefits and risks to guide breast cancer screening decisions. JAMA 2014;311:1327–35. doi:10.1001/jama.2014.1398. [11] Independant UK Panel. The benefits and harms of breast cancer screening: an
independent review. The Lancet 2012;380:1778–86. doi:10.1016/S0140-6736(12)61611-0.
[12] Myers ER, Moorman P, Gierisch JM, Havrilesky LJ, Grimm LJ, Ghate S, et al. Benefits and Harms of Breast Cancer Screening: A Systematic Review. JAMA 2015;314:1615– 34. doi:10.1001/jama.2015.13183.
[13] Paci E. Summary of the evidence of breast cancer service screening outcomes in Europe and first estimate of the benefit and harm balance sheet. J Med Screen 2012;19:5–13. doi:10.1258/jms.2012.012077.
[14] Jørgensen KJ, Klahn A, Gøtzsche PC. Are benefits and harms in mammography screening given equal attention in scientific articles? A cross-sectional study. BMC Med 2007;5:12. doi:10.1186/1741-7015-5-12.
18 [15] Gøtzsche PC, Nielsen M. Screening for breast cancer with mammography. Cochrane
Database Syst Rev 2011:CD001877. doi:10.1002/14651858.CD001877.pub4.
[16] Brewer NT, Salz T, Lillie SE. Systematic review: the long-term effects of false-positive mammograms. Ann Intern Med 2007;146:502–10.
[17] Hubbard RA, Kerlikowske K, Flowers CI, Yankaskas BC, Zhu W, Miglioretti DL. Cumulative probability of false-positive recall or biopsy recommendation after 10 years of screening mammography: a cohort study. Ann Intern Med 2011;155:481–92. doi:10.7326/0003-4819-155-8-201110180-00004.
[18] Clark MD, Determann D, Petrou S, Moro D, Bekker-Grob EW de. Discrete Choice Experiments in Health Economics: A Review of the Literature. PharmacoEconomics 2014;32:883–902. doi:10.1007/s40273-014-0170-x.
[19] de Bekker-Grob EW, Ryan M, Gerard K. Discrete choice experiments in health economics: a review of the literature. Health Econ 2012;21:145–172. doi:10.1002/hec.1697.
[20] Marshall DA, Johnson FR, Kulin NA, Ozdemir S, Walsh JME, Marshall JK, et al. How do physician assessments of patient preferences for colorectal cancer screening tests differ from actual preferences? A comparison in Canada and the United States using a stated-choice survey. Health Econ 2009;18:1420–39. doi:10.1002/hec.1437.
[21] Hol L, de Bekker-Grob EW, van Dam L, Donkers B, Kuipers EJ, Habbema JDF, et al. Preferences for colorectal cancer screening strategies: a discrete choice experiment. Br J Cancer 2010;102:972–80. doi:10.1038/sj.bjc.6605566.
[22] van Dam L, Hol L, de Bekker-Grob EW, Steyerberg EW, Kuipers EJ, Habbema JDF, et al. What determines individuals’ preferences for colorectal cancer screening programmes? A discrete choice experiment. Eur J Cancer Oxf Engl 1990 2010;46:150– 9. doi:10.1016/j.ejca.2009.07.014.
[23] Gyrd-Hansen D, Søgaard J. Analysing public preferences for cancer screening programmes. Health Econ 2001;10:617–34.
[24] Taguchi R, Yamazaki Y, Nakayama K. Eliciting preferences for mammography: using a discrete choice experiment approach. Jpn J Public Health 2010;57:83–94.
[25] Gerard K, Shanahan M, Louviere J. Using stated preference discrete choice modelling to inform health care decision-making: A pilot study of breast screening participation. Appl Econ 2003;35:1073–85. doi:10.1080/0003684032000081348.
[26] Ryan M. Discrete choice experiments in health care. BMJ 2004;328:360–1. doi:10.1136/bmj.328.7436.360.
[27] Coast J, Al-Janabi H, Sutton EJ, Horrocks SA, Vosper AJ, Swancutt DR, et al. Using qualitative methods for attribute development for discrete choice experiments: issues and recommendations. Health Econ 2012;21:730–741. doi:10.1002/hec.1739.
[28] Vass C, Rigby D, Payne K. The Role of Qualitative Research Methods in Discrete Choice Experiments. Med Decis Making 2017;37:298–313. doi:10.1177/0272989X16683934.
[29] Kløjgaard ME, Bech M, Søgaard R. Designing a Stated Choice Experiment: The Value of a Qualitative Process. J Choice Model 2012;5:1–18. doi:10.1016/S1755-5345(13)70050-2.
19 [30] Hersch J, Barratt A, Jansen J, Irwig L, McGeechan K, Jacklyn G, et al. Use of a decision aid including information on overdetection to support informed choice about breast cancer screening: a randomised controlled trial. Lancet 2015;385:1642–52. doi:10.1016/S0140-6736(15)60123-4.
[31] Stacey D, Légaré F, Col NF, Bennett CL, Barry MJ, Eden KB, et al. Decision aids for people facing health treatment or screening decisions. Cochrane Database Syst Rev 2014:CD001431. doi:10.1002/14651858.CD001431.pub4.
[32] Street DJ, Burgess L. The Construction of Optimal Stated Choice Experiments: Theory and Methods. John Wiley & Sons; 2007.
[33] Ryan M, Skåtun D. Modelling non-demanders in choice experiments. Health Econ 2004;13:397–402. doi:10.1002/hec.821.
[34] Bekker-Grob EW de, Donkers B, Jonker MF, Stolk EA. Sample Size Requirements for Discrete-Choice Experiments in Healthcare: a Practical Guide. Patient - Patient-Centered Outcomes Res 2015;8:373–84. doi:10.1007/s40271-015-0118-z.
[35] Manski CF. The structure of random utility models. Theory Decis 1977;8:229–54. doi:10.1007/BF00133443.
[36] McFadden D. Conditional Logit Analysis of Qualitative Choice Behavior. Front. Econom. P.Zarembka, Academic Press: New York; 1974, p. 105–42.
[37] Hall J, Fiebig DG, King MT, Hossain I, Louviere JJ. What influences participation in genetic carrier testing?: Results from a discrete choice experiment. J Health Econ 2006;25:520–37. doi:10.1016/j.jhealeco.2005.09.002.
[38] Train K. Discrete Choice Methods with Simulation. Cambridge University Press, New York; 2003.
[39] Hole AR. A comparison of approaches to estimating confidence intervals for willingness to pay measures. Health Econ 2007;16:827–40. doi:10.1002/hec.1197.
[40] Fiebig DG, Keane MP, Louviere J, Wasi N. The Generalized Multinomial Logit Model: Accounting for Scale and Coefficient Heterogeneity. Mark Sci 2010;29:393–421.
[41] Greene W, Hensher D. Does scale heterogeneity across individuals matter? An empirical assessment of alternative logit models. Transportation 2010;37:413–28.
[42] Hess S, Rose JM. Can scale and coefficient heterogeneity be separated in random coefficients models? Transportation 2012;39:1225–39. doi:10.1007/s11116-012-9394-9. [43] Train K, Weeks M. Discrete Choice Models in Preference Space and Willingness-to-Pay
Space. In: Scarpa R, Alberini A, editors. Appl. Simul. Methods Environ. Resour. Econ., Springer Netherlands; 2005, p. 1–16. doi:10.1007/1-4020-3684-1_1.
[44] Marshall DA, Johnson FR, Phillips KA, Marshall JK, Thabane L, Kulin NA. Measuring patient preferences for colorectal cancer screening using a choice-format survey. Value Health 2007;10:415–30. doi:10.1111/j.1524-4733.2007.00196.x.
[45] Mansfield C, Tangka FKL, Ekwueme DU, Smith JL, Guy GP, Li C, et al. Stated Preference for Cancer Screening: A Systematic Review of the Literature, 1990-2013. Prev Chronic Dis 2016;13:E27. doi:10.5888/pcd13.150433.
[46] Howard K, Salkeld GP, Patel MI, Mann GJ, Pignone MP. Men’s preferences and trade-offs for prostate cancer screening: a discrete choice experiment. Health Expect 2014. doi:10.1111/hex.12301.
20 [47] Duport N, Ancelle-Park R. Do socio-demographic factors influence mammography use of French women? Analysis of a French cross-sectional survey. Eur J Cancer Prev 2006;15:219–24. doi:10.1097/01.cej.0000198902.78420.de.
[48] Sicsic J, Franc C. Obstacles to the uptake of breast, cervical, and colorectal cancer screenings: what remains to be achieved by French national programmes? BMC Health Serv Res 2014;14:465. doi:10.1186/1472-6963-14-465.
[49] Bussière C, Sicsic J, Pelletier-Fleury N. Simultaneous effect of disabling conditions on primary health care use through a capability approach. Soc Sci Med 2016;154:70–84. doi:10.1016/j.socscimed.2016.02.022.
[50] Whynes DK, Philips Z, Avis M. Why do women participate in the English cervical cancer screening programme? J Health Econ 2007;26:306–25. doi:10.1016/j.jhealeco.2006.08.007.
[51] Bourmaud A, Soler-Michel P, Oriol M, Regnier V, Tinquaut F, Nourissat A, et al. Decision aid on breast cancer screening reduces attendance rate: results of a large-scale, randomized, controlled study by the DECIDEO group. Oncotarget 2016;7:12885–92. doi:10.18632/oncotarget.7332.
[52] Smith SK, Trevena L, Simpson JM, Barratt A, Nutbeam D, McCaffery KJ. A decision aid to support informed choices about bowel cancer screening among adults with low education: randomised controlled trial. BMJ 2010;341:c5370.
[53] Johannesson M, Blomquist GC, Blumenschein K, Johansson P, Liljas B, O’Conor RM. Calibrating Hypothetical Willingness to Pay Responses. J Risk Uncertain 1999;18:21– 32. doi:10.1023/A:1007708326467.
[54] Ozdemir S, Johnson FR, Hauber AB. Hypothetical bias, cheap talk, and stated willingness to pay for health care. J Health Econ 2009;28:894–901. doi:10.1016/j.jhealeco.2009.04.004.
[55] Ryan M, Watson V, Entwistle V. Rationalising the “irrational”: a think aloud study of discrete choice experiment responses. Health Econ 2009;18:321–36. doi:10.1002/hec.1369.
[56] Gaglio B, Glasgow RE, Bull SS. Do patient preferences for health information vary by health literacy or numeracy? A qualitative assessment. J Health Commun 2012;17 Suppl 3:109–21. doi:10.1080/10810730.2012.712616.
21
Tables
Table 1.Definition of attributes and levels
Attributes Definition Levels for screening programmes Levels for the opt-out programme
BC mortality Total number of BC deaths out of 1,000 women
followed until 74 years 10, 15, 20, 25 30
False-positive
Number of women undergoing unnecessary investigations (e.g. biopsy) due to suspicious findings on the mammograms that do not result in BC diagnosis, out of 1,000 women screened until 74 years
50, 100, 150,
200 0
Overdiagnosis
Number of women undergoing unnecessary
treatments (e.g. chemotherapy, radiotherapy) due to detection of a non-invasive cancer that would not have become life-threatening, out of 1,000 women screened until 74 years
10, 50, 100,
150 0
Type of screening referral
Invitation to perform a mammogram by … 1/ the local screening centreᵃ 2/ your doctor (GP or gynaecologist)
1.' letter'
2. 'doctor'
-Travel time Time spent travelling to the radiology centre (min.) 10, 30, 60, 90 0 Number of tests Total number of screening tests until 74 years 6, 12, 18, 24 0 Out-of-pocket cost
(OOP)
Cost of screening (in €) after reimbursement by the public health insurance
€0, €30, €60, €60
(refunded)ᵇ
0
ᵃ Standard procedure for inviting women aged 50-74 years eligible to the national BC screening programme (organized screening).
22 Table 2. Description of the sample (n=812)
N (%) N (%)
Age How worried are you about
40-49 301 (37.1) breast cancer ?
50-74 511 (63.9) Not at all 121 (14.9)
Socio-professional category A bit 361 (44.5)
Farmer 7 (0.9) Quite 237 (29.2)
Craftsman 42 (5.2) Very 93 (11.5)
Executive 84 (10.3) Compared to other women of your age,
Intermediate profession 116 (14.3) do you think your chances of getting
Office worker 142 (17.5) breast cancer are
Skilled/unskilled worker 65 (8) Lower 85 (10.5)
Unemployed 135 (16.6) Same 519 (63.9)
Retired 221 (27.2) Higher 87 (10.7)
Marital status I don't know 121 (14.9)
Married 432 (53.2) Do you know someone in your life who
Living in a couple 126 (15.5) had a breast cancer ?
Single 105 (12.9) Yes, among my family 217 (26.7)
Widowed/divorced 149 (18.4) Yes, among my friends 230 (28.3)
Having children Yes, another acquaintance 198 (24.4)
Yes 649 (79.9) No 167 (20.6)
No 163 (20.1) I think it is my duty to attend for
Complementary health insurance regular mammograms
Private 703 (86.6) Disagreeᵃ 83 (10.2)
Free (CMU-C) 57 (7.0) Agreeᵇ 692 (85.2)
No 52 (6.4) I don't know 37 (4.6)
Self-rated health I think mammograms are troublesome
Very good/good 587 (72.3) Disagree 360 (44.3)
Fair 185 (22.8) Agree 393 (48.4)
Poor/very poor 40 (4.9) I don't know 59 (7.3)
Regular medical visits to I think mammograms are dangerous
GP only 208 (25.6) Disagree 574 (70.7)
Gynaecologist only 64 (7.9) Agree 184 (22.7)
Either GP or gynaecologist 464 (57.1) I don't know 54 (6.7)
No regular medical visit 76 (9.4) In case of suspicious findings on the
Last BC screening uptake mammogram, I consider doing
Less than two years 473 (58.3) additional investigations (e.g. a biopsy)
Between two and four years 110 (13.6) as … (Multiple answers accepted)
More than four years 109 (13.4) A constraint 72 (8.9)
Never 120 (14.8) Frightening 354 (43.6)
Tobacco consumption Granted 234 (28.8)
Heavy smoker (>=10 cigarettes/day) 122 (15.0) Necessary 431 (53.1)
Moderate smoker (< 10 cigarettes/day) 88 (10.8) A guarantee of quality 164 (20.2)
Non-smoker 507 (62.4) Other 1 (0.1)
Ex-smoker 95 (11.7) I don't know 38 (4.7)
Total 812 (100) Total 812 (100)
23 Table 3.Results of the error component (EC) logit model
Moment MLE. Std. err. [95% CI]
1. Preferences
ASCScreen Mean 9.430*** 0.861 [7.742 to 11.096]
SD 7.671*** 0.698 [6.349 to 9.100]
ASCAltA Mean 0.274 0.031 [-0.033 to 0.087]
SD 0.250*** 0.072 [0.105 to 0.390]
BC mortality /10 Mean -1.048*** 0.111 [-1.265 to -0.829]
False-positive mammography / 10 Mean -0.022*** 0.007 [-0.036 to -0.007]
Overdiagnosis /10 Mean -0.075*** 0.008 [-0.091 to -0.058]
Type of screening referral Mean -0.159*** 0.032 [-0.222 to -0.095]
Travel time Mean -0.053*** 0.011 [-0.075 to -0.031]
Number of tests Mean -0.114* 0.063 [-0.238 to 0.010]
OOP_€60 (refunded) Mean -0.226*** 0.052 [-0.329 to -0.121]
OOP_€30 Mean -0.748*** 0.168 [-1.077 to -0.417]
OOP_€60 Mean -0.974*** 0.171 [-1.309 to -0.638]
2. Willingness-to-accept
Overdiagnosis Mean 14.1*** 0.601 [12.9 to 15.2]
False-positive mammography Mean 47.8*** 11.700 [24.9 to 70.8]
3. Model statistics
# Individuals 812
# Observations 6496
Log-Likelihood -4685
Pseudo R2 0.3436
MLE: maximum likelihood estimate; SD: standard deviation; Std. err.: standard error; OOP: out-of-pocket cost ASCScreen: generic screening intercept entering the utility function of the two screening alternatives
ASCAltA: alternative-specific shift dummy only entering the utility function of alternative A
Significance level: ***: 1%, **:5%, *: 10%.
Reading note: The women would be willing to accept on average 14.1 overdiagnosis cases and 47.8 false-positive mammograms to avoid one BC-related death.
24 Table 4. Determinants of willingness-to-accept variability - results of the GLMs (N=812)
log (WTA overdiagnosis)
log (WTA false-positive)
dy/dx (%)ᵃ Std. Err dy/dx (%)ᵃ Std. Err
Age: 40-49 (ref='50-74') -7.9 7.3 -8.7 7.6
Region: Centre (ref='West') 6.9 8.8 4.5 9.1
Region: Est 12.5 8.7 12.9 9
Region: Ile de France 5.7 9.8 5.7 10.2
Region: Mediterranean 4.0 10.0 -2.9 10.4
Region: Nord 16.0 12.5 16.7 13
Region: Paris 25.1 15.4 26.4* 16
Occupation: Farmer/craftsman (ref='Unemployed') 1.5 13.1 0.4 13.7
Occupation: Executive 26.4** 10.6 28.3** 11
Occupation: Associate profession -14 8.8 -12.9 9.1
Occupation: Worker -6.1 11.5 -3.6 12
Occupation: Retired -6.5 8.3 -3.9 8.7
Complementary health insurance: None (ref='Private') -2.7 12 -7.0 12.5
Complementary health insurance: CMU-C -16.5 11.6 -10.3 12.1
Marital status: Married (ref= 'Single') -2.9 10 -6.5 10.4
Marital status: Couple -4.5 11.2 -8.2 11.7
Marital status: Widowed/divorced 0.0 11.7 -3.6 12.1
Children: none (ref= 'yes') -2.0 8.2 -4.1 8.5
Self-rated health: Poor (ref='very good/good') -42.5*** 13.5 -43.1*** 14.1
Self-rated health: Fair -17.1** 7.0 -20.0*** 7.3
Regular medical follow-up: Yes (ref= 'No') -8.6 10.7 -5.6 11.1
Last BC screening uptake: <2 years (ref= 'Never') 16.7 12.1 22.3* 12.6
Last BC screening uptake: [2-4 years] 4.5 13.4 8.7 14
Last BC screening uptake: > 4 years 14.1 13.3 20.6 13.9
Tobacco consumption: Heavy smoker (ref= 'No') -3.0 8.6 -1.9 9
Tobacco consumption: Moderate smoker -0.5 9.6 0.3 10
Tobacco consumption: Ex-smoker 7.5 9.2 7.6 9.6
Worry about BC: Not at all (ref= 'A bit') 7.0 9.1 8.2 9.5
Worry about BC: Quite 5.1 6.8 4.9 7.1
Worry about BC: A lot 21.4** 9.7 20.7** 10.1
Self-assessed BC risk: Lower (ref= 'Same as others') -6.6 9.9 -7.8 10.3
Self-assessed BC risk: I don't know -16.7* 8.7 -18.9** 9
Self-assessed BC risk: Higher 12.3 9.9 11.6 10.3
History of BC: Among the family (ref= 'No') -13.4 8.9 -11.5 9.3
History of BC: Among friends -0.8 8.5 2.0 8.9
History of BC: Among another acquaintance -7.9 8.7 -6 9.1
Mammograms are a duty: Disagree (ref='Agree') 5.2 11.1 7.2 11.5
Mammograms are troublesome: Disagree (ref='Agree') -7.6 6.4 -7.8 6.7
Mammograms are dangerous: Disagree (ref='Agree') 0.3 7.6 1.6 7.9
Additional examinations (e.g. biopsy) are: A guarantee
of quality (ref= 'A constraint/frightening') 14.8 9.1 16.0* 9.5
Additional examinations are: Granted/Necessary 6.4 7.4 5.4 7.7
25
Significance level: ***=1%; **=5%; *=10%
Reading: Executives have a WTA overdiagnosis 26.4% higher than unemployed women
Table 5. Simulation* of screening acceptance rates as a function of various benefits/harms ratio
Number of overdiagnosis cases for
one BC death avoided
Number of false-positive mammograms for one BC death
avoided 2 4 6 8 10 10 20 30 40 50 % Accepationᵃ Overall 98% 90% 73% 58% 49% 92% 63% 48% 39% 29% Paris 100% 91% 74% 65% 59% 94% 74% 65% 56% 44% Executives 99% 93% 83% 67% 58% 96% 74% 61% 52% 48% Poor health 95% 83% 55% 43% 33% 90% 45% 35% 28% 18% Fair health 97% 91% 71% 52% 41% 91% 59% 39% 31% 21% High fear of BC 99% 94% 83% 68% 57% 95% 72% 50% 45% 33% Positive opinions of - - - - - 95% 71% 55% 43% 34%
additional tests (e.g. biopsy)
* Simulation based on the results of the GMNL-WTA-space models (see Appendix 1 for details).
ᵃ Percentage of women having a benefits and harm trade-off higher than the given value: prediction of the proportion of women who would accept the screening programme conditional on the given benefits and harms ratio (under complete information).
26
Figures
Figure 1. Example of a choice scenario
Screening option A Screening option B No screening option BC mortality 10 25 30 False-positive 200 50 0 Overdiagnosis 150 10 0
Type of screening referral invitation letter your doctor none
Travel time 10 min 90 min 0 min
Number of tests 18 12 0
Out-of-pocket cost € 60 € 30 € 0
Which option would you choose ? □ □ □
Note: In each choice task, respondents could attain the detailed defintion of attributes by clicking on the attribute’s label
27 Figure 2. Densities and cumulative distribution functions of willingness-to-accept (WTA) - results of the GMNL-WTA-space models
Reading note: the mean WTA overdiagnosis is 15.5 and the median is 9.6 (i.e. 50% of women would be willing to accept less than 9.6 overdiagnosis cases to avoid one BC-related death). The mean WTA false-positive is 41.5 and the median is 27.2. According to the CDFs, 95% of women would be willing to accept between 2.3 and 49.2 overdiagnosis cases (respectively, between 6.7 and 127.3 false-positive mammograms) to avoid one BC-related death.
28
Appendix
Appendix 1. Specification and estimation details of the GMNL-WTA-space model 1/ The GMNL- model
The Generalized Multinomial Logit Model (GMNL) applied to the initial EC model specification can be written as follows [40]:
𝑈𝑛𝑗𝑡 = 𝛼𝑛′𝐴𝑆𝐶 + (𝜎𝑛𝛽𝑛′)𝑥𝑗𝑡+ 𝜖𝑛𝑗𝑡 (1)
Where 𝛼𝑛′=(𝛼0𝑛, 𝛼1𝑛), ASC is the vector of generic and alternative-specific intercepts as
described in the EC model, and 𝜎𝑛 is the respondent-specific scale of the idiosyncratic error 𝜖𝑛𝑗𝑡, representing the variation of randomness in the decision-making process from one respondent to another. As 𝛽 and 𝜎 cannot be separately identified, we used the general specification of the scale parameter [40]: 𝜎𝑛 = exp(𝜎̅ + 𝜏𝜖0𝑛), where 𝜖0𝑛~𝑁(0,1) and 𝜎̅ =
−𝜏2
2
⁄ so that E(𝜎𝑛)=1. Note that the GMNL model reduces to the RPL specification if 𝜏 = 0 as 𝜏 provides a measure of scale heterogeneity.
2/ The GMNL-WTA-space model
As detailed by Greene and Hensher (2010), the GMNL can be parameterized to estimate preference parameters in WTP-space in order to compute subject-specific WTP. We followed their methodology to estimate parameters in WTA-space. First, separating the ‘harm’ attributes (harm) entering the denominator of the WTA expression (i.e. overdiagnosis or false-positive) and their coefficients (𝛽ℎ𝑎𝑟𝑚,𝑛) we get :
𝑈𝑛𝑗𝑡 = 𝛼𝑛′𝐴𝑆𝐶 + 𝜎𝑛(−𝛽ℎ𝑎𝑟𝑚,𝑛ℎ𝑎𝑟𝑚 + 𝛽𝑛′𝑥𝑗𝑡) + 𝜖𝑛𝑗𝑡 (2)
𝑈𝑛𝑗𝑡 = 𝛼𝑛′𝐴𝑆𝐶 + 𝜎𝑛𝛽ℎ𝑎𝑟𝑚,𝑛(−ℎ𝑎𝑟𝑚 +𝛽𝑛′
𝛽ℎ𝑎𝑟𝑚,𝑛
⁄ 𝑥𝑗𝑡) + 𝜖𝑛𝑗𝑡 (3)
Normalizing the harm coefficient (𝛽ℎ𝑎𝑟𝑚,𝑛) to 1 and restricting 𝛽𝑛′ to 𝛽𝑚𝑜𝑟𝑡𝑎𝑙𝑖𝑡𝑦,𝑛 in the numerator of Eq (3) yields the WTA-space specification. Two distinct models are derived by replacing 𝛽ℎ𝑎𝑟𝑚,𝑛either by 𝛽𝑜𝑣𝑒𝑟𝑑𝑖𝑎𝑔𝑛𝑜𝑠𝑖𝑠,𝑛or 𝛽𝑓𝑎𝑙𝑠𝑒𝑝𝑜𝑠𝑖𝑡𝑖𝑣𝑒𝑠,𝑛:
𝑈𝑛𝑗𝑡 = 𝛼𝑛′𝐴𝑆𝐶+ 𝜎𝑛(−𝑜𝑣𝑒𝑟𝑑𝑖𝑎𝑔𝑛𝑜𝑠𝑖𝑠 + 𝑊𝑇𝐴𝑜𝑣𝑒𝑟𝑑𝑖𝑎𝑔𝑛𝑜𝑠𝑖𝑠,𝑛𝑚𝑜𝑟𝑡𝑎𝑙𝑖𝑡𝑦𝑗𝑡) + 𝜖𝑛𝑗𝑡 (4)
29 Where 𝑊𝑇𝐴𝑜𝑣𝑒𝑟𝑑𝑖𝑎𝑔𝑛𝑜𝑠𝑖𝑠,𝑛 =𝛽𝑚𝑜𝑟𝑡𝑎𝑙𝑖𝑡𝑦,𝑛 𝛽 𝑜𝑣𝑒𝑟𝑑𝑖𝑎𝑔𝑛𝑜𝑠𝑖𝑠,𝑛 ⁄ and 𝑊𝑇𝐴𝑓𝑎𝑙𝑠𝑒𝑝𝑜𝑠𝑖𝑡𝑖𝑣𝑒𝑠,𝑛= 𝛽𝑚𝑜𝑟𝑡𝑎𝑙𝑖𝑡𝑦,𝑛 𝛽𝑓𝑎𝑙𝑠𝑒−𝑝𝑜𝑠𝑖𝑡𝑖𝑣𝑒𝑠,𝑛 ⁄ 3/ Estimation details
The two GMNL models in Eq (4) and (5) are estimated by specifying a joint multivariate normal distribution for the vector of random variables, i.e. (𝛼0𝑛, 𝛼1𝑛, 𝑊𝑇𝐴𝑜𝑣𝑒𝑟𝑑𝑖𝑎𝑔𝑛𝑜𝑠𝑖𝑠,𝑛) in Eq (4) and (𝛼0𝑛, 𝛼1𝑛, 𝑊𝑇𝐴𝑓𝑎𝑙𝑠𝑒𝑝𝑜𝑠𝑖𝑡𝑖𝑣𝑒𝑠,𝑛) in Eq (5), and using 500 halton draws to simulate the log-likelihood of the sample. Because of the panel nature of data (i.e. multiple choices per women), the empirical bayes estimator was used to recover subject-specific trade-offs [38]. The models were coded and estimated using the GMNL package written in R software. All the codes are available upon request.
30 Supplementary file 1. Description of the attributes as presented to respondents (in French) and translation in English
Attributes Full definition
French English French English
Nombre de décès BC mortalilty Nombre de décès par cancer du sein attendus pour 1000 femmes suivies jusqu’à 74 ans Number of breast cancer deaths expected per 1000 women followed up to 74 years
Nombre de fausses alertes
(faux-positif)
False-positive
Nombre de femmes ayant une fausse alerte suite à un cliché anormal sur une mammographie, qui ne conduit cependant pas au diagnostic d'un cancer du
sein, pour 1000 femmes dépistées régulièrement
jusqu'à 74 ans. NB : la fausse alerte engendre un examen
complémentaire invasif de type biopsie
Number of women with false alarm following an abnormal mammography, which does not lead to the diagnosis of breast cancer, for every 1,000 women performing regular screening up to 74
years of age NB: the false alarm generates an invasive
examination such as a biopsy
Nombre de traitements non nécessaires
(sur-diagnostic)
Overdiagnosis
Nombre de femmes ayant un traitement non nécessaire pour une tumeur précancéreuse détectée
par le dépistage, qui n'aurait probablement pas évolué en cancer du sein, pour 1000 femmes
dépistées régulièrement jusqu'à 74 ans. NB : le traitement peut consister en une
chirurgie, une chimiothérapie et/ou une radiothérapie
Number of women with unnecessary treatment for a precancerous tumor detected by screening,
which would probably not have evolved into breast cancer, per 1,000 women screened
regularly up to 74 years of age. NB: the treatment may consist of surgery,
chemotherapy and/or radiotherapy
Prescripteur Type of screening referral
La mammographie vous est proposée par : 1/ un courrier d’invitation envoyé par le centre de
gestion du dépistage 2/ votre médecin (votre gynécologue ou votre
médecin généraliste)
Your are invited to perform a mammography by: 1/ a letter sent by the local screening centre
2/ your doctor (GP or gynaecologist)
Temps de
déplacement Travel time
Temps de déplacement au cabinet de radiologie le plus proche (en minutes)
Time spent travelling to the radiological centre (in min)
31
Nombre total de
mammographies Number of tests
Nombre total de mammographies à effectuer jusqu'à vos 74 ans
Total number of mammograms to be performed up to age 74
Coût d’une
mammographie Out-of-pocket cost
Coût de chaque mammographie restant à votre charge (en €), après remboursement de l'assurance
maladie
Cost of each mammogram remaining in your charge (in €) after reimbursement by the public