The Design of A Coiled Tubing Cutter for Use In
Subsea Oil Drilling Applications
by
Tye Schlegelmilch
Submitted to the Department of Mechanical Engineering in partial Fulfillment of the Requirements for the Degrees of
Master of Science in Mechanical Engineering Bachelor of Science in Mechanical Engineering
at the
MASSACHUSETTS INSTITUTE OF TECHNOLOGY
May 1999
© 1999 Massachusetts Institute of Technology All rights reserved.
Signature of Author:
Certified by:
Accepted by:
Department of Mechanical Engineering May 7, 1999
V CZ1 Steven Dubowsky
Professor of *chanical Engineering Thesis Supervisor
Ain A. Sonin Professor of Mechanical Engineering Chairman, Department Graduate Committee
OF TECHNOLOGY
JAN
2 5 2007
LIBRARIES
MASSACHUSETTS INSTITUTE OF TECHNOLOGYLIBRARIES
ARCHISeS
The Design of a Coiled Tubing Cutter for Subsea Oil Drilling
Applications
By
Tye Schlegelmilch
Submitted to the Department of Mechanical Engineering on May 7, 1999, in partial fulfillment of the requirements for the degree of Master of Science in Mechanical
Engineering and Bachelor of Science in Mechanical Engineering
Abstract
A cutting device has been developed which can be used in conjunction with Schlumberger's SenTree product line to insure proper disconnect of an offshore system from a subsea wellhead during the testing of the well. Design requirements for the device were established by the requirements of the SenTree tool. Additional force requirements for the prototype were established through theoretical models and experimental tests. These goals were met with a prototype based upon a linear piston arrangement. This piston arrangement offers an advantage over other conventional methods of cutting because of its predictability and ease of use. This thesis explores issues relevant to the design including material considerations, cutting blade optimization, and the examination of prior work. In this thesis, the proposed prototype was manufactured and verified through experimental testing. Furthermore, the guidelines developed in this thesis can be used to design the future generations of subsea cutting tools.
Thesis Supervisor: Steven Dubowsky Title: Professor of Mechanical Engineering
Acknowledgements
I would like to acknowledge and thank Schlumberger Perforating and Testing Center (SPT) for the sponsoring of the research presented in this thesis. I would especially like to thank Vance Nixon, Gary Rytlewski for their guidance throughout the process. In addition, I would like to thank Professor Steven Dubowsky for his patience in helping me develop this thesis.
Table of Contents
I Introduction 9
1.1 Background 12
1.2 Thesis Overview 17
1.3 Thesis Organization 18
2 Design Considerations and Performance Goals 19
2.1 SenTree 3 Cutter Design Considerations 19
2.2 SenTree 7 Cutter Design Considerations 21
3 Shear Model 22
3.1 System Model 22
3.2 Constant Cutting Force 23
3.3 Non-Constant Cutting Force 26
4 Cutting Tests 31 4.1 Equipment 32 4.1.1 Test Fixture 32 4.1.2 Tinius Olsen 33 4.1.3 Material Selection 34 4.1.4 Cutting Blades 35 4.2 Experimental Procedure 37
4.3 Cutting Test Results 38
5 Discussion and Results 47
5.1 Cutting Force Comparison 47
6 SenTree 3 Prototype Cutter 52
6.1 Prior Work 52
6.2 SenTree 3 Cutter Design 54
6.2.1 Piston Design 54
6.2.2 Cutting Blade Design 64
6.2.3 Alignment Pins 66
6.2.4 Completed Prototype 67
6.3 Prototype Testing 68
6.3.1 Static Testing 68
6.3.2 Static Test Procedure 70
6.3.3 Static Test Results 72
6.3.4 Dynamic Tests 73
6.3.5 Dynamic Procedure 73
6.3.6 Dynamic Results 75
7 SenTree 7 Mock-Up Cutter Design 76
8 Conclusions & Recommendations 79
8.1 Conclusions 79
8.2 Recommendations 80
References 82
List of Figures
1.1 Subsea wellhead system 10
1.2 SenTree schematic 11
1.3 Chemical cutter 13
1.4 Shaped Charge Schematic 15
1.5 Shaped Charge Jet Formation 15
2.1 Size Requirements 20
3.1 Schematic of Shear Model 22
3.2 Approximated Cross-Section 23
3.3 Theoretical force predictions 25
3.4 Theoretical energy predictions for constant-force model 26
3.5 Non-constant force model 27
3.6 Theoretical force predictions for 1.5inch coiled tubing 28 3.7 Theoretical force predictions for 1.75inch coiled tubing 28 3.8 Theoretical force predictions for 2.0inch coiled tubing 29 3.9 Theoretical force predictions for 3.5inch coiled tubing 29 3.10 Theoretical energy predictions for non-constant force model 30
4.1 Picture of test fixture 32
4.2 Schematic of Tinius Olsen 33
4.3 Schematic of 45degree blade geometry 36
4.4 Blade geometries 37
4.6 Data for 1.5inch coiled tubing 40
4.7 Data for 1.75inch coiled tubing 40
4.8 Data for 2.0inch coiled tubing 40
4.9 Data for 3.5inch coiled tubing 41
4.10 Graph of required cutting force 42
4.11 Energy required by each blade geometry 43
4.12 Uncut versus cut samples 44
4.13 Comparison of external deformation of coiled tubing 45 4.14 Comparison of internal deformation of coiled tubing 45
4.15 Results of PTFE coated blade versus non-coated 46
5.1 Theoretical force versus experimental results 49
5.2 Theoretical energy versus experimental results 51
6.1 Schematic of M-shaped linkage 54
6.2 Preliminary piston concept 55
6.3 Original piston design 57
6.4 Modified piston design 59
6.5 Von Mises FEA of original piston design 60
6.6 Deformation of original piston in Y direction 61
6.7 Von Mises FEA of modified piston 62
6.8 Deformation of modified piston in Y direction 63
6.9 Design of compound blade for prototype 64
6.10 Reactionary forces acting on blades 65
6.12 Assembly of SenTree 3 prototype 67
6.13 Static experimental setup 69
6.14 Schematic of test bay pressure system 70
6.15 Test data taken from static cutting tests 72
6.11 Dynamic test setup 74
7.1 SenTree 7 piston schematic 77
Chapter 1
Introduction
In recent years, the use of subsea wells in the production of oil has significantly increased due to advances in technology and recent software development. As a result, offshore drilling and the use of subsea wellheads have become commonplace [Society for Underwater Technology, 1996].
The subsea well is very similar to those used on land. Included in the subsea well are the wellhead assembly and blow out preventer (BOP) shown in fig.l.l. In offshore situations, the BOP stack can be fixed to the wellhead and is often used as the last alternative in the event of a dangerous situation (for example, a hurricane, a broken motor on floating rig, pressure surge). If needed, the BOP has two methods for controlling the well. The first method relies upon its hydraulically powered pipe rams. These pipe rams are designed to clamp and seal around any internal pipes. However, if this is not enough, the BOP also contains several shear rams. These hydraulically powered blades can be used to cut material inside of the well and subsequently seal the well. As a result of the damage caused by their use, the use of the BOP's shear rams are often avoided until all other options have failed. If used, it may take several days to replace damaged equipment and re-establish the well [Mather, 1995].
Floating Rig
Figure 1.1: Basic configuration of the subsea well. In the event of an emergency, the BOP may be used to sever any material present and allow disconnect [Meijer, 1997].
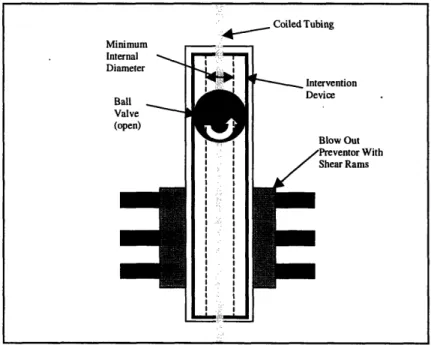
Due to the high costs associated with the use of the BOP, Schlumberger has been working on the development of a line of tools known as the SenTree product line. Current work has been focused on three inch (SenTree 3) and seven inch (SenTree 7) versions (Here the three and seven inch refer to the minimum internal diameter of the respective intervention device as shown in Fig. 1.2). It is expected that these tools will be able to fit within the BOP and act as an additional well control device as shown in fig 1.1 and fig. 1.2. In the event of a large storm or critical situation the SenTree 7 and SenTree 3 tools would allow the riser to be completely sealed without the use of the shear rams of the BOP stack. Both the SenTree 3 and SenTree 7 also allow the riser to be unlatched and sealed so that it may be pulled off of the wellhead and easily re-attached at a later time [Meijer, 1997]. Riser Intervention Device Inside of BOP -BOP After Disconnect Before Disconnect
In the event that the well needs to be sealed, the SenTree 7 has a duel method of closure. The sealing is accomplished via the use of both a ball valve and flapper valve used in combination (ball valve portion can be seen in fig. 1.2) [Meijer, 1997]. The
SenTree 3 uses two ball valves to accomplish the same sealing process (only one ball valve shown in fig. 1.2) [Nixon, 1998]. However, when tools are being run through the SenTree intervention devices as shown in Fig. 1.2, the presence of coiled tubing (flexible steel tubing used to lower tools in the well) or wireline (armored conductive cable) may obstruct the closure of these valves.
However, the ball valve is capable of completing the required cutting in some instances where tension is very high and the coiled tubing size is less than 2 inches in diameter. Its use is not ideal due to the crucial sealing function it serves. Testing has also shown that the current ball valve assembly is not capable of cutting coiled tubing over 2.375 inches in either the SenTree 7 or SenTree 3.
Figure 1.2: Basic schematic of SenTree systems within BOP and subsea assembly. Coiled Tubing Minimum Internal (I t ms
1.1 Background
The problem of cutting coiled tubing has been a widely studied problem for the past several years [Precision Coiled Tubing, 1997]. Recently, many new techniques have been developed which allow the cutting to be conducted in a very timely and efficient manner. Some of these methods recently developed, rely upon technology which has existed for many years. Among these methods, chemical cutters, mechanical cutters and the use of shaped charges are the three most commonly used. Although these three methods are used to cut coiled tubing, their use in a subsea environment has been very limited. With the exception of cutting by ball valve or shear rams of a BOP, no cutting mechanisms currently exist for this environment.
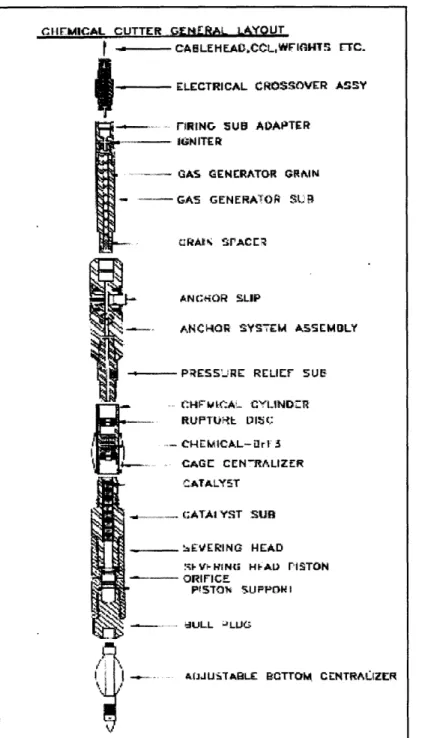
The active chemical in many of the chemical cutters is bromine trifluoride. This highly toxic, colorless liquid has the ability to dissolve coiled tubing in a matter of seconds. Chemical cutters can be both mechanically and hydraulically actuated to release the bromine trifluoride. The bromine trifluoride, which is stored inside of chambers within the cutting device (fig. 1.3) is then forced out in an even manner through small exit holes in the tool. Although, the bromine trifluoride is a highly reactive substance, in order to cut efficiently, the chemicals must be emitted within a 1/16 of an inch to the coiled tubing. Within the SenTree devices, this tight tolerance would require that the chemicals be mechanically positioned prior to being released as a result of the large minimum diameter necessary. In addition, the active chemicals are only effective on one layer of material. Therefore, in the event that additional material is present inside of the coiled tubing (a common practice when using heavy tools which require a power source)
the chemical cutters would only sever one layer. The tool would not only need to hold
the bromine trifluoride, but also contain all of the mechanical equipment necessary for the alignment.
CIIEMICAL CUTTER .orNEfENRAL LkYOUT
---
I CABLE HEA,CCLWF'IGHTs rTC.
ELECTRICAL CROSSOVER AsSY
FIRINCG SUB AD)APTER
IGNITER
GAS GENERATOR GRAIN
-GAS GENERATOR S~R
aRAko SPrACE
i. ,... n-dJUrTA.BLE BOTTOM CENTRACIZER
V.
Figure 1.3. Chemical cutter consisting of bromine trifluoride cylinders, catalyst, and rupture discs [Pipe Recovery Systems, Inc. 1997].
ANC~+OR SLIP
ANCIOR: YSTEM ASSEMDLY
PqESS'..RE RELIEF SUE
C"HF WCA:L CYIIND-R RUPTUtit DISC
C•HEM ICAL- r1: 3
CAGE CEN-RALIZER
CATALYST
(;ATAI YST SUR
t*EVERING HEAD
IvI-.•INiN HIAD PISTON ORIFICE
PISTON SLUPPOF I
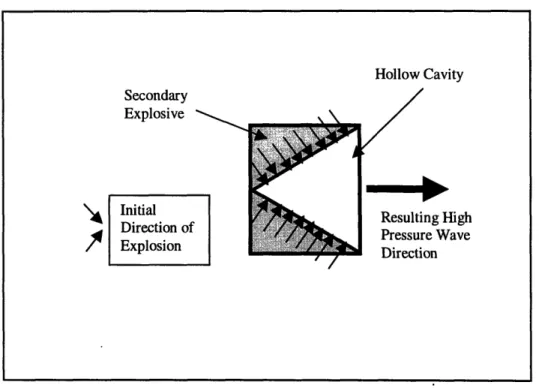
A second method for the cutting of coiled tubing is shaped charge explosives. Shaped charges are usually a low grade explosive formed into a special shape in an effort to guide the explosion. Some of the most common types of explosive used for this purpose are RDX, HMX, and HNS. In the case of coiled tubing cutting, these charges are usually placed into a riing formation shown in Fig. 1.4 and then used within or around the outside of the coiled tubing. The assembly consists of a detonator, booster and a symmetric shaped charge cutter. The detonator can be activated by an electrical signal. Once activated, the detonator ignites the booster. The explosion of the booster then ignites the secondary (low-grade) explosives of the shaped charge cutter. As the secondary explosives are ignited the symmetric charge explodes. The explosion creates a high-pressure wave which breaks into the hollow cavity. At this point, the vertical components of the high-pressure wave are canceled out resulting in a high-pressure wave in the desired direction. These charges are usually placed into a ring formation shown in Fig. 1.4. This results in a flat horizontal pressure wave. This high-pressure jet is responsible for the cutting. Figure 1.5 shows the creation of a high-pressure jet from a single shaped charge [Walters, 1989].
In the presence of fluid, these shaped charges must be within 1/4 of an inch to the material to ensure proper results. Much like the chemical cutter, this tolerance would require an additional mechanical structure to move the shaped charges into cutting position. In most situations, shaped charges are not considered safe above 2750F while
Figure 1.4: On the left is a basic shaped charge schematic. Shown are the detonator, booster, and tubing cutter. The right side shows the ring arrangement for a tubing cutter. As the charges explode, high pressure jets are emitted.
Hollow Cavity Secondary Explosive Initial Direction of Explosion r / ng High re Wave on
Figure 1.5: Resulting high-pressure wave direction following shaped charge detonation.
Planar Jet From Cutting Charge Hollow Cavities Detonator Explosive Booster Primary Explosive Tubing Cutter Secondary Explosive HNS, RDX, RMX
on---A third method used for the cutting of coiled tubing is mechanical shear. During the shearing process, coiled tubing is usually placed between two cutting blades. As the blades overlap the coiled tubing is sheared into two pieces.
The principle behind mechanical shear is very simple. However, in order to cut large sizes of coiled tubing, complex hydraulic systems have become necessary. In subsea applications, BOP's rely upon these complex shear rams to cut several inches of coiled tubing. Unfortunately, these devices capable of cutting coiled tubing are far too large to fit within Schlumberger's SenTree tools.
Each of these cutting methods has its benefit and downside and it is up to the designer to choose appropriately among them. Although all three of the methods presented are commonly used in some conditions, none of them are presently used in subsea applications. As a result, the subsea environment and design requirements resulted in the elimination of both the chemical and shaped charge cutters. The following section describes the resulting approach taken in this thesis.
1.2 Thesis Overview
In this thesis, the development of a prototype cutter for use in Schlumberger's SenTree 3 intervention device relied upon a variation of the basic shear method applied to the cutting of coiled tubing. A theoretical model was derived to predict the cutting force and energy requirements of the prototype. This model was then compared with experimental tests performed in the laboratory. Results from both the experimental tests and
was then manufactured and tested within Schlumberger's laboratory at the Rosharon, TX facility.
The development of a cutter for the SenTree 7 intervention device was also necessary. However, the scope of this thesis concluded with a mock-up design. The development of the mock-up cutter for the SenTree 7 also relied upon the results of the cutting tests and theoretical model to predict the necessary force requirements. Using these results, the up was designed in a similar manner to the SenTree 3. The mock-up was not manufactured.
1.3 Thesis Organization
Chapter 2 of this thesis examines the design requirements of both the SenTree 3 and SenTree 7 cutters. In chapter 3, we formulate a basic theoretical model for the shearing process experienced during the closing of two objects. We will then use this shear formula in the formation of the theoretical energies required to complete the cutting process. Once the theoretical values have been examined, chapter 4 will present the cutting tests conducted within Schlumberger's laboratory. This section will also present some basic design details of the test fixture and cutting blades used for the process. Chapter 5 will present a comparison of the theoretical model versus the experimental results. Chapter 6 will follow with the formulation of the SenTree 3 concept through the final prototype design. Included in this chapter will be a section for each of the key components of the prototype. Also included in this chapter will be FEA results for one of the components. The chapter will conclude with a discussion of the prototype testing. The design for the SenTree 7 mock-up will then be examined in Chapter 7. Finally, this
thesis will finish with the conclusions and recommendations for future work in Chapter 8. Appendix A will contain all of the results.
Chapter 2
Design Considerations and Performance Goals
Due to the nature of Subsea oil production, the design requirements of the cutting mechanisms for both the SenTree 3 and SenTree 7 are largely dependent upon speed and size constraints. This is because of the scarce space available for machinery in a subsea well [Riley, 1980]. Time is such a crucial issue because of the hazards commonly associated with an offshore rig. In the event of a storm or other hazardous situation as mentioned in Chapter 1, it is imperative that the floating rig be able to disconnect from the subsea well quickly. A delayed disconnection may result in the destruction of the rig and the death of several workers. Another consideration is the hostile hydrogen sulfide environment present in most subsea wells. In response to this type of environment, material selection needs to be made consistent with NACE (National Association of Corrosive Engineers) and API (American Petroleum Institute) standards [Society for Underwater Technology, 1996].
2.1 SenTree 3 Cutter Design Considerations
The objective of the SenTree 3 cutter was to comply with all of the requirements listed in Table 2.1. Additional force requirements were established by a theoretical model and experimental tests conducted in later chapters. A visual model of the general
specifications for both the SenTree 3 and SenTree 7 can be seen in Fig.2.1. The figure shows the available space for the design in the form of an annulus. Shown are the
maximum outside diameter (OD), minimum internal diameter (ID), and the maximum
vertical height. The maximum coiled tubing size is the largest coiled tubing size needed to be cut. The maximum operating pressure is the maximum amount of pressure available to the cutting system, while the maximum test pressure refers to the amount of pressure present in the ID of the tool during testing.
Figure 2.1: Visual description of size requirements for both SenTree 3 & 7 cutter
Table 2.1: Project requirements for the SenTree 3 cutter [Nixon, 1998]. Minimum I.D Maximum O.D Lximum rtical ight
General Specifications: Tarret
Maximum O.D 13.00in.
Minimum I.D 3.03 in.
Maximum Vertical Height 18 in.
Maximum ID Test pressure 20,000psi Maximum Operating Temperature 325oF Minimum Operating Temperature -20 OF
Maximum Coiled Tubing Size 2.0 in. O.D
0.190 Wall Thickness 90ksi yield strength Maximum Absolute Operating Pressure -Static 10,000psi
(across valves and ID)
Maximum Allowable Time For Cutting 5 Seconds
2.2
SenTree 7 Cutter Design Considerations
The requirements for the SenTree 7's cutter are shown in Table 2.2. A schematic of the maximum O.D, minimum LD, and maximum vertical height can be seen in fig. 2.1. Once again, the maximum ID test pressure is the maximum pressure inside of the ID during testing, while the maximum operating pressure is the available line pressure during testing.
General Specifications: Target
Maximum O.D 18.56 in.
Minimum I.D 7.37 in.
Maximum Vertical Height 18.0 in.
Maximum ID Test pressure 15,000 psi
Maximum Operating Temperature 3250F
Minimum Operating Temperature -20 OF
Maximum Coiled Tubing Size 3.5 in. O.D
0.250 Wall Thickness 80 ksi yield strength Maximum Absolute Operating Pressure -Static 10,000 psi (across valves and ID)
Maximum Allowable Time For Cutting 5 Seconds Process
Chapter 3
Shear Model
This chapter presents the development of two theoretical models for the laboratory cutting tests. Inclusive to this section is the derivation of two models for the required cutting force. This cutting force can then be used to predict values for the energy expended during the cutting process. The first model presented will be a basic upper bound model. Proceeding this will be the derivation and results of a second shear model. The results of the second model were only calculated for the coiled tubing sizes experimentally tested (as noted in Table 3.1). It is important to note that neither of these models take plastic effects experienced during the cutting process into account.
3.1 System Model
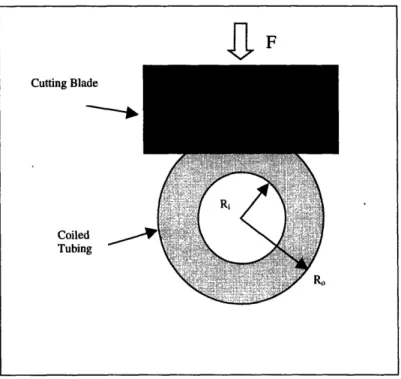
For a first approximation of the system behavior, the system will be modeled as a beam of material subjected to pure shear. As shown above in Fig. 3.1, the top block moves downward with some force, F, thereby causing the beam to shear into two pieces.
Figure 3.1: Schematic of basic shear model used to describe cutting of coiled tubing
Solid Block, of Material
3.2 Constant Cutting Force
In the first model, the cross-section of the coiled tubing will be modeled as a solid beam with a width equivalent to the diameter of the coiled tubing and a thickness equal to twice the thickness, t, of the coiled tubing as shown in Fig. 3.2. This approximation is made based upon the hypothesis that the coiled tubing will deform into this geometry prior to being sheared by the blocks.
Figure 3.2: Approximated cross-section of coiled tubing.
Therefore, in order to calculate the required cutting force, von Mises yield criterion is used as shown below [Crandall, 1978]:
2 y 2 2 +3 , + .2 + ] (3.1)
where Y is the value where yielding occurs (minimum yield strength), ox, ay, and oz are the principal stresses, and ,,xy, Tyz, and tzx are the shear stresses. Because there are no principle stresses associated with pure shear, oa,, ay, and (z are equal to zero and thus drop out of the equation. After simplification, the equation becomes:
Y= 3.
(3.2)
Diameter
The total force required to shear the coiled tubing can then be calculated by multiplying the values calculated for the shear stress by their respective cross-sectional areas from Table 3.1 as follows:
F, =
tA
(3.3)Substituting equation 3.2 into 3.3 results in the following equation:
Y
F - A (3.4)
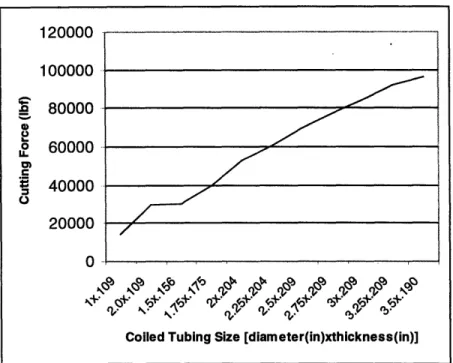
Fig. 3.3 then plots these theoretical values versus their respective coiled tubing size. This
is done for all thick walled coiled tubing sizes. As shown, the force required to cut the coiled tubing is proportional to the cross-sectional area of the coiled tubing and the yield strength. For the theoretical calculations, all coiled tubing sizes assumed a 80,000 lbf/in2
for the minimum yield strength [Precision Coiled Tubing, 1997].
Name of Coiled O.D Specified (in.) Wall Thickness Calculated Cross- Minimum Yield Tubing Specified (in.) Sectional Area Strength (lbf/in.2)
(in.2) 1.0x.109 1.0 0.109 0.305 80,000 2.0x.109* 2.0 0.109 0.647 80,000 1.5x. 156* 1.5 0.156 0.658 80,000 1.75x.175* 1.75 0.175 0.865 80,000 2.0x.204 2.0 0.204 1.151 80,000 2.25x.204 2.25 0.204 1.311 80,000 2.5x.209 2.5 0.209 1.504 80,000 2.75x.209 2.75 0.209 1.668 80,000 3.0x.209 3.0 0.209 1.833 80,000 3.25x.209 3.25 0.209 1.997 80,000 3.5x.190* 3.5 0.190 1.976 80,000
* Coiled tubing sizes used in experimental testing
Table 3.1: Explanation of coiled tubing size and relevant data for coiled tubing used for theoretical model and laboratory testing [Precision Coiled Tubing, 1997].
SZUUUU 100000 80000 U 60000 5 40000 20000 0
Figure 3.3: Calculated theoretical force requirements for the cutting of varying sizes of coiled tubing.
The importance of the force requirement to cut through the varying sizes of coiled tubing is very apparent. Another area to be understood is the energy expenditure used in the cutting process. Energy is used to both deform and cut the coiled tubing in the laboratory tests. However, for the theoretical model, the cutting will again be modeled as simple shear as shown in Fig. 3.4. This assumption will result in a model that does not take into account any of the deformation associated with the process.
In the most basic form, energy can be defined as:
Energy =
J
Fdx (3.5) where Fc is the force requirement and dx is an incremental distance. For the purposes of this derivation, F, is held as a constant. Use of this equation in conjunction with Eq. 3.4 yields:2t Y
Energy -= dx (3.6)
Enrrg0
F3
IAA~~~
where A is the cross-sectional area of the specimen from Table 3.1. Referring back to the cross-sectional approximation results in the integration from zero to 2t (where 2t is twice the thickness of the coiled tubing). This then results in:
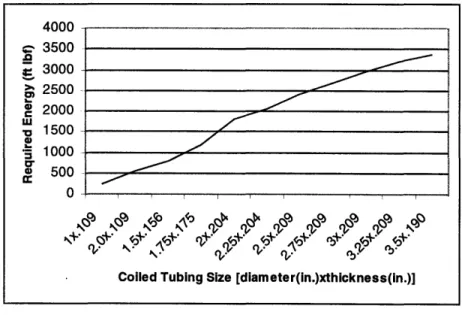
Energy = F 2t (3.7) The theoretical results of the cutting tests are shown in further detail in Fig. 3.3. As shown, there is a strong correlation between the cross-sectional area and the required energy. Again, this theoretical energy prediction is done for all sizes of coiled tubing
with a minimum yield strength of 80,0001b/in2.
A AA , 3500
3000
>% 2500 C 2000 - 1500 '- 1000 a 500 0Coiled Tubing Size [dameter( n, thckness(n.) Coiled Tubing Size [diam ete r(in.)xthickness(in.)]
Figure 3.4: Graph shows the theoretical energy requirement for several coiled tubing sizes.
3.3
Non-Constant Cutting Force
In this second theoretical model the force required for the cutting process will not be considered a constant. Instead, the force will depend upon the area remaining to be cut. Fig. 3.5 shows the cross-section of the coiled tubing used to calculate the area. As
shown, the remaining area is the portion of the coiled tubing which has not been cut. Using the result from equation 3.5, the cutting force is equal to:
Y Fc =-A
c4=3 (3.4)
Unlike the previous derivation the required cutting force changes as the blade makes its way through the material.
Figure 3.5: Schematic of cutting blade cutting through material. Area is calculated as the remaining uncut coiled tubing.
To calculate the required force to cut each of the four coiled tubing sizes a
spreadsheet was created which allowed the force to be calculated by means of an iterative process. For the initial value, it was assumed that the area was completely intact. For each subsequent value, the blade moved into the material 0.00075in. As a result, the initial value coincides with the previous model's calculations for the maximum required force for each of these coiled tubing sizes. The curve then slopes downward as the
-,aF
Cutting Blade
Coiled Tubing
remaining area decreases. The results for each of the four coiled tubing sizes are shown in Figs. 3.6-3.9. 35000 30000 25000 20000 15000 10000 5000 0 0.5 1 1.5 2 Displacement (in)
Figure. 3.6: Theoretical force prediction for 1.5inch coiled tubing.
45000 40000 35000 ,30000 25000 2 20000 u- 15000 10000 5000 0 0 0.5 1 1.5 Displacement (in) 2
35000 30000 25000 20000 15000 10000 5000 0 0 0.5 1 1.5 Displacement (in) 2 2.5
Figure 3.8: Theoretical force prediction for 2.0inch coiled tubing.
100000 80000 60000 40000 20000 0 0 1 2 3 Displacement (in) 4
Figure 3.9: Theoretical force prediction for 3.5inch coiled tubing.
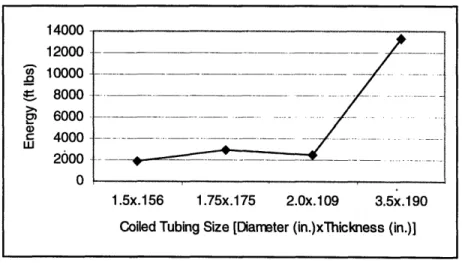
Each of these curves could then be used to calculate the energy necessary to cut each of the four coiled tubing sizes. As previously mentioned, the energy of this process is the area underneath the force curve. For the theoretical model, this was calculated by means of an iterative calculation of the area underneath the curve. Fig. 3.10 shows the plot of the theoretical energy predictions as a function of the coiled tubing size cut. The energy was only calculated for these four coiled tubing sizes, hence the graph does not
contain a smooth function. It does however, show the general pattern for increasing cross-sectional areas. IUVVV -12000 10000 -8000 2 6000 4000 2000 0 1.5x.156 1.75x.175 2.0x.109 3.5x.190
Coiled Tubing Size [Diameter (in.)xThickness (in.)]
Figure 3.10: Theoretical energy predictions for the four coiled tubing sizes tested in the laboratory.
Chapter 4
Cutting Tests
Prior to the beginning of this thesis, research had been conducted within Schlumberger concerning the potential for a subsea cutting device that would allow the coiled tubing to be easily fished out of the well once cut. For this project, ideal fishing criteria is for the diameter of the coiled tubing, both internal and external, to remain fairly unchanged. Previous results have shown that by creating a circular blade that would follow the contour of the tubing, the tubing would be forced to shear with much less deformation than experienced when using a simple flat blade device. This research set the groundwork for the following experimentation [Ribeyre, 1997].
Initial progress revolved around the development of a test fixture and cutting blades to be used within the Schlumberger laboratories in Rosharon, TX. The five primary reasons for doing the cutting tests were as follows:
1. Develop a basic understanding of the cutting process.
2. Compare experimental results with those obtained through the theoretical modeling (this could in turn lead to additional theoretical work should the model not
coincide with experimental testing).
3. Ensure that material choice and subsequent treatment result in an optimal design.
4. Experiment with the amount of coiled tubing deformation resulting from cutting.
5. Predict force requirements of the prototype.
The significance of the actual cutting process on the performance of any final design, resulted in several cutting tests conducted within Schlumberger's laboratory.
4.1 Equipment
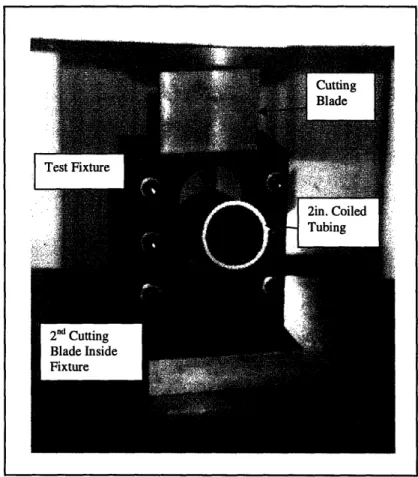
4.1.1 Test Fixture
The test fixture was designed to simulate the cutting of coiled tubing in the SenTree apparatus. The fixture allowed for two, 1/2 inch thick, cutting blades to overlap and cut in a linear geometry as shown in Fig. 4.2. To accommodate the 3.5 inch coiled tubing, the fixture was designed to handle loads in excess of 120,000 lbf. The fixture also allowed for easy transition from one set of test blades to the next. This was accomplished
by requiring the removal of only 6 screws before exposing the cutting blades. The
completed test fixture can be seen in Fig. 4.1.
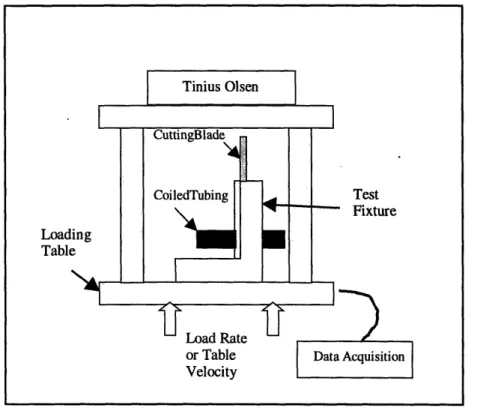
4.1.2 Tinius Olsen
The test apparatus used to conduct the testing of the blades was a hydraulic compression machine manufactured by Tinius Olsen. The Tinius Olsen machine was capable of loading under a prescribed velocity or load rate. During the loading process, the Tinius Olsen's acquisition device would record the time, load, and displacement at a sampling rate of 2hz. This data was then stored in a file in ascii format.
Despite the actual cutting tools five-second cutting process, the Tinius Olsen was still used to test the blade geometries because of its ability to record data and perform repeatable tests. The schematic in Fig. 4.2 shows the Tinius Olsen and its major components.
Figure 4.2: Schematic of Tinius Olsen with key components defined.
Press
Load Rate or Velocity
4.1.3 Material Selection
Prior to developing a design for the cutting blades, material selection needed to be done. It was necessary for the cutting blades to be both strong and tough so that they could be used for multiple tests with limited wear and breakage. In addition, the blades would need to be able to withstand the impact associated with the rapid, five second, cutting of the prototype.
For the initial, material selection, the choice was made to use the shock resisting steel, S7. This tool steel has all of the characteristics needed from the blades. S7 is a very hard steel with a hardness between 45-57 Rc. It is also very resistant to cracking, experiences little distortion, and is very tough. As a result of these characteristics, S7 is often the tool steel of choice for industrial cutting [ASM, 1990 & ASM, 1994].
To decide upon the proper hardness for this application of the S7, three sets of blades were made by Burnett Machine Works and subsequently tested in Schlumberger's laboratory. Each set comprises three blades. The first set of blades was tempered to a hardness of 48-52Rc (it is customary to give a range of 4 Rc as a hardness specification for a part). The second set was given a hardness of 52-56Rc, while the third set was tempered to 56-60Rc. Cutting tests were then performed using identical samples of coiled tubing with all three groups of blades. As shown in table 4.1, the set of blades with an Rc of 56-60 were far too brittle to perform repeated tests. Conversely, the set with a 48-52 Rc experienced excessive amounts of deformation during the cutting tests. The second group with an Rc of 52-56 did experience a slight amount of deformation yet
were able to continue with tests. As a result, all further blades were given a 52-56 Rc specification.
Specification (Rc) Blade Number Actual (Rc) Result
48-52 1 48 Excessive Deformation
48-52 2 49 slight deformation
48-52 3 51 slight deformation
52-56 1 53 very slight deformation
52-56 2 53 very slight deformation
52-56 3 54 no noticeable result
56-60 1 59 cracking
56-60 2 59 severe cracking
56-60 3 57 severe cracking
Table 4.1: Results from S7 blades with different Rockwell hardness.
4.1.4 Cutting Blades
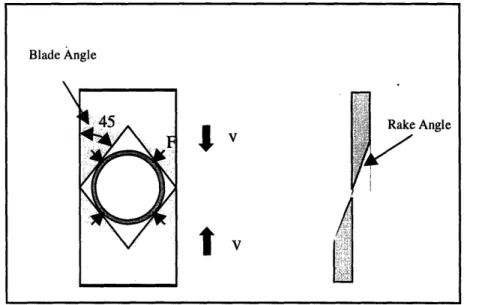
Research conducted by Schlumberger had suggested that a round geometry would be ideal for the cutting process. This geometry allowed for a smooth cut with limited distortion of the coiled tubing. Unfortunately, a round geometry would also have to be adapted to every coiled tubing size to be tested if it were to display similar results. This resulted in the consideration of other blade designs. As shown below in Fig. 4.3, by designing the blades with 45 degree blade angles, all of the force transmitted to the coiled tubing would be acting in opposing directions. It was therefore hypothesized that this geometry would negate much of the deformation.
In addition to the 45 degree blade angle, other experimental blades were developed. These designs utilized varying degrees for the blade angles as well as varying angles on the rake of the blade. Table 4.2 gives each of the blades names as well
as the blade angle and rake angle as defined in Fig. 4.3 (each name is a combination of blade angle x rake angle). For the blades with a circular blade, a radius is given instead of a blade angle. One set of blades was also given a PTFE coating in an effort to reduce the friction between the two blades. PTFE is an industrial coating commonly used to reduce friction and protect parts in hostile environments [National, 1986]. Figure 4.4 shows the geometry associated with all of the blades tested in the laboratory.
Figure 4.3: Schematic of 45 degree blade geometry. Blade angle and rake angle are also defined.
Blade Name Blade Angle (deg) Rake Angle (deg)
45x45 45 45 60x45 60 45 roundx45 1.88 (in.) 45 roundx60 1.88 (in.) 60 compound 1.0 (in.) 45 xylan (PTFE) 60 45
Table 4.2: Blade descriptions and explanation of names.
Blade Angle
Angle
I
o. b
Figure 4.4: These five different blade geometries were used in the cutting tests. From top left going clockwise, the blades are: roundx45, roundx60, compound, 45x45 and 60x45. The PTFE blade is not shown since it is a duplicate of the 60x45.
4.2 Experimental Procedure
After the test blades were designed and detailed, the drawings were submitted to Burnett Machine Works so that they could be manufactured. To begin testing, the test fixture was first placed onto the load table of the Tinius Olsen. One blade was located inside the fixture and the mating blade placed in the slot as shown in Fig. 4.5. Prior to placing the second blade in the slot a piece of coiled tubing was placed through the opening in the test fixture (Fig. 4.1). The addition of the second blade would then hold the coiled tubing
in place and assure proper alignment. After starting the test, the Tinius Olsen began to raise its lower table upward at a constant force rate of 10,000 lbf/min. The Tinius Olsen's table would continue to move upward until the sample had been cut. Upon cutting the coiled tubing, the machine would automatically return back to the pre-programmed start
location. During the testing, data was recorded within the Tinius Olsen's memory storage by means of its 290 Controller. Following the completion of the tests the data was
converted to an ascii format and used for data analysis. This process was conducted at least twice for each of the four coiled tubing sizes using the six different blades (data on the four coiled tubing sizes can be found in Table 3.1 on p. 24).
Figure 4.5: Experimental setup for static cutting blade design tests using the Tinius Olsen
4.3 Cutting Test Results
This chapter presents and discusses the results obtained from the cutting tests. It begins with a description of the force results and then examines the energy consumption involved in the cutting process by all six blade geometries.
Test
Fixture
Load
Tabli
Load Rate
or Table Data Acquisition Velocity
In this section the standard deviation of various tests will be calculated. This calculation is not done to show a statistical significance of the process, but rather to show the variation among coiled tubing sizes cut. Percentage differences presented in this
section are calculated by the following equation:
Difference Average
where Difference is the difference between the two values and Average is the average of the two values.
As previously mentioned, the Tinius Olsen's test data could be recorded and then later converted to an ascii format for analysis. Graphs of the data received for all four of the coiled tubing sizes can be seen in Figs. 4.6-4.9. The graphs contain data from all blade geometries cutting each of the specified coiled tubing sizes. As shown, the force required to cut the coiled tubing is increasing with the displacement of the cutting blade. As the blade continues to move, the force continues to increase until the coiled tubing is sheared in half. This is represented on the graph by the rapid unloading of the Tinius Olsen. It also appears that the different blade geometries load up in nearly an identical manner. The compound, PTFE coated blade, 45x45 and 60x45 all appear to have similar slopes while the two round geometries have lower slopes and therefore require more deformation prior to cutting. This will be examined in the energy analysis portion of the thesis.
35000 30000 25000 :,20000 15000 0 U. 10000 5000 0 1 Distance (In)
Figure 4.6: Data recorded using each of the six types of blades on the 1.5 in. tubing sample. 40000 35000 30000 25000 20000 15000 10000 5000 0 0 0.5 1 1.5 Distance (in)
by 0.156 in. thick coiled
2
Figure 4.7: Data for the 1.75in. sample with 0.175in. wall thickness.
I- - - - __- -25000 20000 1 15000 10000 5U0 5000 0 0 0.5 1 1.5 2 2.5 Distance (In)
Figure 4.8: Data for the.2.0in. sample with 0.109in. wall thickness. - 45x45 -60x45 roundx45 roundx60 Sxylan .:. compound ..
Figure 4.9: Data for the 3.5in. coiled tubing with 0.190in. wall thickness.
By taking this "rough" data and finding the maximum values, it was possible to calculate the forces required by each of the blades to cut each size of coiled tubing. Fig. 4.10 shows the average force required by each of the sets of blades to cut each of the four samples of coiled tubing. As illustrated, the 45 degree blades with the 45 degree rake angle required the least amount of force for all coiled tubing sizes. Conversely, the round geometry blades required the most amount of force for all samples. For the smaller sizes of coiled tubing, the force difference between the blades was found to be 8.5%, 2.7%, and 3.2% for the 1.5in., 1.75in., and the 2.0in., respectively. However, the 3.5in. sample showed a much greater amount of variation. The difference between the roundX60 blade and the 45x45 blade was found to be 31.6%. While the average required cutting force was calculated to be 765331bf with a standard deviation of 11,6881bf. This relatively high standard deviation implies that there is a significant amount of variation between the different sets of blades. For the 1.5in., 1.75in., and 2.0in., these values are 30,251bf with a standard deviation of 12491bf, 36,1601bf with a standard deviation of 4291bf, and 20,7541bf with a standard deviation of 2971bf, respectively. These values are much
I90000UUUUU 90000 70000 2 60000 * 50000 40000 30000 20000 10000 0 - 45x45 60x45 roundx45 .. roundx60 S4--0 - xylan 3 - compound 0 1 2 3 4 Distance (in) ~nnnnn
lower and show that the force is much less dependent on the blade geometry for smaller coiled tubing sizes than for larger sizes.
Figure 4.10: Experimental results of cutting tests using all five sets of cutting blades on all four sizes of coiled tubing.
Since energy is the integral of force times a displacement, the energy necessary to complete each of the cutting processes was calculated by finding the area under each of the "rough data" curves. These values from all of the coiled tubing sizes were then combined into Fig. 4.11. In this analysis, blades requiring less energy were considered more efficient. This classification was given based upon the reasoning that a blade requiring the coiled tubing to undergo more deformation prior to cutting would require a larger amount of energy to accomplish the process. As the figure shows, the energy necessary to cut the samples is very similar for the smaller sizes of coiled tubing. However, for the largest size, the difference was calculated to be 37% with a standard deviation of 937ft lbf. For the 1.5in., 1.75in., and the 2.0in. samples, the differences between the most efficient and least efficient method was 24.8%, 34% and 21%, with standard deviations of 191ft lbf, 282ft lbf and 104ft lbf, respectively. In all conditions, it was shown that the most efficient set of blades was the 45 degree blade with the 45
· IAAAAAT\
-80000
2 60000
- U-m 40000 20000 0 1.5x.156 1.75x.175 2.OX.109 3.5x.190 Coiled Tubing Size-R
o
--RundX45
Roil~RoundX60
S--f-54Co
mpopcund I
--l~045x45
-L7--
ý
-
6 M5-
-,
degree rake angle. The second most efficient arrangement was the compound arrangement. U000 8000 " 7000 6000 CM 5000 w 4000 .S 3000 o 2000 1000
Figure 4.11: Energy required by each of the cutting blades to cut each of the coiled tubing sizes.
Another area of importance for the project is the resulting geometry of the coiled tubing following the shearing process. As previously mentioned, during the recovery of the coiled tubing from the well, it is ideal to have a geometry with very little deformation to ensure that fishing remains possible. In some instances, it may be necessary to grab the coiled tubing from the outside, while in other situations, it may be necessary to use a spear to enter the coiled tubing and grab it from the inside [Riley, 1980]. It is important that the deformation experienced on both the inside and outside of the coiled tubing remain as small as possible. The schematic in Fig. 4.12 shows how this deformation was measured on the experimental samples. For the external deformation (outside of the coiled tubing), the difference between the initial and the final major diameter was calculated. For the internal deformation (inside of the coiled tubing), the minor diameter was used to calculate-the percentage difference. Fig. 4.13 illustrates the resulting change
1.5x.156 1.75x.175 2.0x.109 3.5x.190
in external diameter following the cutting process, while the results from the internal deformation can be found in Fig. 4.14.
As shown in the figures on the following page, the 45 degree blade with the 45 degree rake angle consistently showed less deformation than any of the other five blade arrangements. For the external deformation, the 45x45 blade showed less than 7% deformation for all three of the measured coiled tubing sizes in comparison to the round geometry blades which produced an average deformation of 29% for the three coiled tubing sizes.
Although not quite as effective as the 45x45 blade, the compound blade showed much less deformation than the round geometry blades. On average, the compound blade showed a deformation of just over 15% for the coiled tubing sizes.
All blades showed much higher levels of deformation on the internal calculation shown in Fig. 4.14. Again, the 45x45 blades exhibited the least amount of deformation with an average of just under 20%. This is in comparison to the round blades which had deformations averaging to 69%. The compound blade's internal deformation was almost identical to that of the 60x45 blade, with the 60x45 showing an average of 38.4% deformation compared to the compound blades 36.6%. Data can be seen in Appendix A.
Figure 4.12: Schematic of uncut versus cut samples of coiled tubing. External
Before Cut After Cut
Figure 4.13: External deformation of the coiled tubing following cutting. Values calculated as a percentage of the original size.
70 o 60 50 - - -'- RoundX60 -- RoundX45 0 40 --LU)60X45 O') 30 - .... 45X45 1 4-2 4-2 - -- Compound 20 -1.5x. 156 1.75x. 175 2.0x. 109
Coiled Tubing Size
Figure 4.14: Internal deformation of the coiled tubing following cutting. Values calculated as a percentage of the original internal diameter.
As an additional test, one set of 60x45 blades was coated with an industrial compound known as PTFE, or xylan. PTFE is commonly used to coat parts of oilfield tools which may encounter hostile environments with hydrogen sulfide. Therefore, it would be likely that any final product would require this coating. It was hypothesized that the PTFE coating would reduce the required force and energy necessary for the process because of its common use as a lubricant. The results of the xylan coating
S20 a) C 15 U-e) 10 . 5 U) 0 --- -* Compo 1.5x.156 1.75x.175 2.0x.109
Coiled Tubing Size nr --RoundX6 -- -- RoundX45 60X45 ... 45X45 -I•--Compound! 1.x16 17x15 20.0
experiment are shown in Fig. 4.15. As shown, the PTFE compound did show a minimal difference for each of the coiled tubing sizes tested. This difference in cutting force was calculated to be 3.9%, 6.3%, and 6.1% for the 1.5in., 1.75in., and the 2.0in., respectively. The percentage difference for the 3.5in. sample was calculated to be 5.1%.
80000
a
50000
o 40000 S30000 - -• 20000 - xyla 10000 - - . -- .- .. - - ...-- 60X45 0 .-.--- ,--...--.-4 2.0x.109 1.75x.175 1.5x.156 3.5x.190Coiled Tubing Size
Chapter
5
Discussion and Results
In considering the validity of the theoretical models derived in Section 3, it will be necessary to compare their predictions with those attained in the .laboratory. Both the theoretical and experimental results have been presented in previous sections, however, no reference has yet been made concerning the relationship between the two. This section will look at both of these results and discuss any noticeable trends. The discussion will be presented as follows:
1. Compare the theoretical and experimental values obtained for the cutting force as a function of coiled tubing size.
2. Compare the theoretical versus experimental values obtained for the energy required for the cutting process as a function of coiled tubing size.
5.1 Cutting Force Comparison
For this first comparison, only the maximum required force for each coiled tubing size will be considered. Since both theoretical models predict the same upper bound to the force calculation, the comparison between theoretical and experimental will only be made once.
By comparing the theoretically predicted values for the required cutting force with those actually obtained in the experimental setting, the validity of the models will be
examined. In Fig. 5.1, the theoretical data is plotted on the same graph as the experimental data. As shown, the theoretical data appears to do an excellent job of predicting the required force at small tubing diameters. For the 1.5in. and 1.75in. samples, the theoretical model was within 0.5% and 9.5% of predicting the outcome (values used for the experimental results were the averages of all blades for that coiled tubing size). However, as the tubing size increased, the percentage difference between the sample and model increased from under 1% to 30.4% for the 2.0 in. and 20.6% for the 3.5in. coiled tubing. The large percentages for these two samples may imply that the model is invalid for larger sizes. It is important to note that the standard deviation of the experimental results- for the two sizes were 116881bf and 2971bf. This would then suggest that it is increasingly difficult to predict results for larger sized coiled tubing, a point which will be examined further in the energy comparison.
As stated in the theoretical model's derivation, by approximating the cutting force as the force required to shear the entire cross-section of the coiled tubing, the model was expected to be conservative. In actuality, the model is not only conservative, but is an upper bound to force required to shear the coiled tubing. This is verified by Fig. 5.1. As shown, at all coiled tubing sizes the theoretical force curve is higher than the experimental values. This result is not unexpected. Because the theoretical model does not account for any of the other factors contributing to the failure of the tubing, it should be higher at all sizes. Another explanation for this difference between the theoretical and experimental results may be attributed to the efficiency attained by actually cutting the material versus shearing it. In the laboratory tests, the coiled tubing appeared to have been cut through a limited portion and then experienced failure due to fracture on the
remaining cross-section. Therefore, since the theoretical model assumes only shear, any cutting attributable to a sharpened blade would result in a more conservative estimate.
1ZUUUU -100000 " 80000 S60000 . 40000 o 20000 0
Figure 5.1: Comparison of theoretical model versus experimental results for all cutting blades.
5.2
Energy Comparison
The second comparison is between the theoretically predicted energy requirements versus the energy utilized in the cutting tests. A plot of the theoretical models versus the experimental results can be seen in Fig. 5.2. For all experimental values, the constant force points are constantly within a few percent. For all coiled tubing sizes the theoretical values are consistently less than their experimental counterparts. This therefore implies that the theoretical model is not accounting for a large amount of energy used during the process. Several factors could be responsible for this non-conservative result. First, because the constant force theoretical model approximates the cross section as a rectangular piece of material, it assumes that no deformation takes place. Therefore, any deformation results in increased energy consumption beyond the expected value. This would also explain why the 3.5in.and 2.0in. coiled tubing sizes experience a greater
Coiled Tubing Size[Diameter (in.)xThickness (in.)] I IC·~~A~
difference between the theoretical model and the experimental values and why the smaller diameter coiled tubing is much closer to the predicted values.
Another factor adversely acting on the system is the friction associated with the blades sliding past each other and against the test fixture. In actuality, this friction term can become rather large as the normal forces resulting from the cutting process push the two blades against each other.
Conversely, the non-constant force model predicts a conservative result for each of the four coiled tubing sizes. As shown in fig. 5.1, the points for the non-conservative theoretical model are consistently higher than those of the constant theoretical model and the experimental results.
Several factors can be attributed to this conservative result. During the cutting process, the force necessary to cut the coiled tubing increased until it reached a point where the coiled tubing failed. This failure was almost always a result of fracture. Therefore, because the coiled tubing failed from fracture rather than shear, the model's prediction will always be conservative. This becomes more evident in the larger coiled tubing sizes. As shown, the theoretical model predicts energy requirements more than double the experimental results. However, for smaller coiled tubing sizes, the non-constant theoretical model does an excellent job of predicting the required energy as shown in the figure.
Several conclusions can be drawn from the results regarding further optimization of the cutting blades. As shown from the force and energy comparisons, the cutting tests do show that the 45x45 geometry requires the least amount of force and energy to cut. As the results also show, the variations in cutting geometry produced only minimal
changes in the force and energy requirements. As a result, modifications and further efforts to optimize the cutting blades would probably not contribute to any significant improvements in either force or energy requirements. It is important to note that the blade geometry did contribute significantly to the final shape of the cut sample. Therefore, further optimization could be performed to produce a more ideal cut.
14000
I-
C. Theoretical
12000 a N.C Theoretical -
-2000
--•NZ ' q" q" T Y P (P .P
Coiled Tubing Size [Diameter(in.) x Thickness(in.)]
Figure 5.2: Experimental and theoretical results for energy consumption. In the legend, C. Theoretical is for the Constant Force Theoretical model and N.C Theoretical is for the Non-Constant Theoretical Force model
10000 RoundX45 RoundX60 8000 X Compound L... 0 45x45 6000 + 60x45 4000 PTFE
Chapter 6
SenTree 3 Prototype Cutter
The driving factors behind the design of the SenTree 3 prototype cutter were the requirements earlier established in Chapter 3. The primary requirements of the SenTree 3 cutter were its ability to cut the 2.0inch thick-walled coiled tubing (.194inch thickness) and the ability to do it (the cutting) within five seconds. From both the theoretical and experimental results it was shown that the design would need to generate 40,0001bf to cut the coiled tubing.
This chapter will begin with a review of past work conducted on the cutting of coiled tubing in a subsea environment. It will then focus on the development of key mechanical components for the SenTree 3 cutter and the development of the completed prototype. It will conclude with the prototype test results.
6.1 Prior Work
The novel ideas of cutting coiled tubing, keeping within a tightly constrained space, and with a limited amount of time has been a greatly studied problem at Schlumberger. Within the past two years this problem has been a central issue for much research. Although proposed solutions have been generated, none of them have been able to meet all of the design requirements.
One such design depended on the use of two blades with an M shaped linkage system as shown below in Fig. 6.1[Ribeyre, 1997]. Although the system was tested and
capable of cutting smaller sizes of coiled tubing, the mechanical advantage gained by the linkage arrangement was not exploited until a late point in the stroke. In addition, for the blades to overcome the large ID, the linkages, and piston required to push down on the linkages, were past the vertical height requirement. Another issue concerning this design was the return of the system to pre-cut position. As shown, the only way to return the blades back to the original position would be to attach the linkages to the piston and somehow return the piston to its original position following cutting. This would require an extra line running to the SenTree device. Because much of the intervention device has already been designed with just one extra line for a cutting mechanism, the addition of a second pressure line would require design of other components - an unwanted result.
An interesting aspect of the proposed design is the round geometry of the blades and the cutting over-center. As shown in the following equation, the force generated at the end of the stroke, where 0 approaches 0, approaches infinity as a result of the sin 0 present in the denominator. For this equation, 0 will be defined as the angle between one of the linkages and the horizontal guide. The equation is as follows:
F cos6
F = (6.1)
4 sin6
where F2 is the force available for cutting and F is the force with which the piston is
being pushed downward. This large force is available as a result of the mechanical advantage of this linkage arrangement. Unfortunately, during the cutting of the coiled tubing, failure occurs well before the blades cross over center as shown on the graphs in the previous section, thereby making this result less than ideal.
Figure 6.1: Schematic of M-shaped linkage design.
6.2 SenTree 3 Cutter Design
6.2.1 Piston Design
Initially, the focus for the project turned to a piston arrangement running perpendicular to the SenTree 3 product. The reasoning behind this design was as follows:
1. Simplicity of linear arrangement
2. Due to size allowance, linear pistons would fit within the desired region fairly well.
3. Cutting blade tests had shown that linearly actuated blades could make cuts with
little deformation.
As a result of these three reasons, the linear method was adopted. Initial concept generation dealt with the design of a system capable of generating the 40,000 lbf with a safety factor of 1.5. A basic schematic of the concept is shown in Fig. 6.2.
Piston Used to Create
Piston Face B Piston Face A
Figure 6.2: Schematic of preliminary piston concept.
The first step in the .design of the piston was to set the diameter of Piston Face B to 3.5inches. This was done to ensure that the entire ID was swept during the cutting process. After setting this piston face, the following balanced force equation was used to
solve for the size of piston face A. It is important to note here that there is fluid inside of
the SenTree 3 tool (annulus fluid) which can reach pressure levels up to 5000psi. As a result, the area attained by subtracting piston A's face from that of piston B's is exposed to a maximum pressure of only 5000psi. versus the pressure in the internal diameter which can attain pressures as high as 15,000psi. The equations used to derive the size of
piston A are as follows:
Driving Pressure(Area of Piston A) = Cutting Force + ID Pressure (Area of Piston B)+Annulus Pressure (Area A -Area B)
Substituting in the respective values yields:
10,000
A)
2F Sf +
15[,00
I
+ 5,000 {2
_
-
(6.1)
where A is the diameter of the A face in the schematic, B is the diameter of the B face in the schematic, Fc is the required cutting force, and Sf is the safety factor.