HAL Id: halshs-00586034
https://halshs.archives-ouvertes.fr/halshs-00586034
Preprint submitted on 14 Apr 2011HAL is a multi-disciplinary open access archive for the deposit and dissemination of sci-entific research documents, whether they are pub-lished or not. The documents may come from teaching and research institutions in France or abroad, or from public or private research centers.
L’archive ouverte pluridisciplinaire HAL, est destinée au dépôt et à la diffusion de documents scientifiques de niveau recherche, publiés ou non, émanant des établissements d’enseignement et de recherche français ou étrangers, des laboratoires publics ou privés.
environmental degradation: what consequences for
population’s health?
Alassane Drabo
To cite this version:
Alassane Drabo. Agricultural primary commodity export and environmental degradation: what con-sequences for population’s health?. 2011. �halshs-00586034�
C E N T R E D'E T U D E S E T D E R E C H E R C H E S S U R L E D E V E L O P P E M E N T I N T E R N A T I O N A L
Document de travail de la série Etudes et Documents
E 2011.10
Agricultural primary commodity export and environmental degradation:
what consequences for population’s health?
Alassane Drabo
C E R D I
65 BD.F. MITTERRAND
63000 CLERMONT FERRAND - FRANCE
TEL.0473177400 FAX 0473177428
L’auteur
Alassane Drabo
PhD student, Clermont Université, Université d'Auvergne, CNRS, UMR 6587, CERDI, F-63009 Clermont Fd.
E-mail address: alassanedrabo@hotmail.com / Alassane.Drabo@u-clermont1.fr / DAlassane@uneca.org
La série des Etudes et Documents du CERDI est consultable sur le site :
http://www.cerdi.org/ed
Directeur de la publication : Patrick Plane
Directeur de la rédaction : Catherine Araujo Bonjean Responsable d’édition : Annie Cohade
ISSN : 2114-7957 Dépôt légal : avril 2011
Avertissement :
Les commentaires et analyses développés n’engagent que leurs auteurs qui restent seuls responsables des erreurs et insuffisances.
Abstract
In the economic literature it is generally found that trade openness affects environment through various channels. While the mechanisms through which trade is associated with pollution are largely investigated theoretically and empirically, the role played by each trade component has not yet received enough attention. This paper attempts to bridge this gap by examining the consequences of agricultural primary commodity export on population’s health via physical environment degradation. Using panel data from 1991 to 2009, and instrumental variables technique, the findings suggest that agricultural primary commodity export increases agricultural methane and nitrous oxide emissions as well as water pollution (biological oxygen demand). This environmental degradation from trade worsens population’s health (infant and child mortality rates, and life expectancy at birth). These results are robust to different subcomponents of primary agricultural export, to African sample, and to other environmental variables considered.
Keywords: Agriculture, primary commodity, trade, environment, health, instrumental variables technique
JL classification: C3, F18, I1, Q17, Q5.
Acknowledgements
This paper was made possible with a Young African Professional fellowship at the United Nations Economic Commission for Africa (UNECA). The author is grateful to Emmanuel Nnadozie, Kasirim Nwuke, Adrian Gauci, Chrystelle Tsafack Temah, Taro Boel, Oumar Diallo, Angelica E Njuguna, Selamawit Mussie, Tsega Belai, Meron Assefa, and all the UNECA’s staff members for their helpful contributions. All errors are the author’s responsibility.
1. Introduction
One of the vigorous debates in economic literature since the 1990’s is the association between trade openness and environmental degradation (Copeland and Taylor, 1994, 2004; Copeland, 2005). On the one hand scholars argue that since environmental quality is a normal good, openness to trade may increase demand for a clean environment through its positive effect on income. Thus, firms are encouraged to shift towards cleaner techniques of production. Trade is therefore beneficial to environmental quality. On the other hand, it is argued that trade may deteriorate environment through the expansion of the scale of the economic activities and the localization of pollution-intensive industries in developing countries, since environmental standard is low in these countries. Empirical works generally find a small negative association between trade and environment (Antweiler et al, 2001).
Despite this large interest in the link between trade openness and environment, the role played by different components of trade is less investigated. These components may have different effects. For example, imports are likely to be less harmful to environment than exports, and export component may have different environmental impact. Therefore countries with different trade components do not have to expect the same environmental consequence. Moreover, the assessment of the health effect of the environmental consequences of trade is scarce despite the fact that the ultimate and most important consequences of environmental degradation are damage to human health. Population health is an important economic concern for developing countries. It plays a central role in the development process, since it constitutes a component of investment in human capital and workforce is the most abundant production factor in these countries. It constitutes also a major preoccupation for the international community, especially when it is considered as a public good. The importance given to health status could be illustrated through its relatively high weight among the Millennium Development Goals (MDGs), of which three are related to health preoccupations.
This paper investigates the responsibility of the export of primary agricultural commodities in environmental degradation, and the impact of this pollution on population’s health. The pressure of external primary commodity demand may destroy physical environment through excessive use of agricultural inputs (land, forest, fertilizer, pesticide), and this in turn may degrade physical environmental (soil, water, air, deforestation). This agricultural pollution affects health outcomes of farmers and farm workers, the populations that live in areas
surrounding agricultural farms, and people eating food containing persistent agricultural chemical.
We explore this relationship using some simple econometric models. Our results obtained using instrumental variable methods show that the agricultural primary commodity export increases agricultural methane and nitrous oxide emissions as well as water pollution (biological oxygen demand). This environmental degradation from trade worsens population’s health outcomes (infant and child mortality rates and life expectancy at birth). These results are robust to different subcomponents of primary agricultural export, to the inclusion of openness variable, to the restriction of the estimation to African sample, and to other environmental variables considered.
The rest of the paper is organized in six sections. Section 2 reviews the literature on the association between trade openness and environmental degradation. In this section we explain how trade may affect physical environment. Section 3 shows some stylized facts on export characteristics, primary agricultural export, and environmental indicators. In section 4, we empirically investigate the effects of primary agricultural commodity exports on health via environmental degradation. Section 5 presents empirical results and discussions, and the robustness checks of our results are shown in section 6. Finally, conclusion and recommendations are at the core of the last section.
2. Trade, agriculture, and environmental quality
In this section we review the literature on the association between trade openness and environmental degradation. Then, we explain how agriculture affects the environment, as well as the health consequences of this pollution.
2.1. Trade and pollution
The relationship between international trade and environmental concerns has been largely debated during the last twenty years. Many scholars investigated theoretically as well as empirically how openness to international trade may affect physical environment. If the empirical results are far from consensus, the theoretical mechanisms are well established and
can be classified into three categories. In fact, international trade may impact environment through its effects on: (1) economic growth, (2) trade specialization, and (3) tariff escalation.
2.1.1. The effect of trade channeled by economic growth
The large and positive contribution of trade on economic outcomes is one of the commonly accepted conclusions in the economic literature (Frankel & Romer, 1999). Indeed, export performance is beneficial to economic growth through increasing specialization and the spillover effects of the export sector’s growth, greater capacity utilization, the externality effect of exports in the diffusion of modern technology across other sectors and industries, and the increasing effects of economies of scale, industrialization, and import of capital goods (Michaely, 1977; Tyler, 1981; Feder, 1982; Balassa, 1985; Chow, 1987; Krueger, 1990; Ram 1985, 1987; Sengupta & Espana, 1994; and Vohra, 2001).
This economic progress obtained from trade affects environment through three conflicting mechanisms: scale, technique and composition effects. First, the expansion of the size of the economy (Gross Domestic Product (GDP)) tends to raise pollution level through the increase of the scale of economic activities and the demand for all inputs. Secondly, assuming that environmental quality is a normal good, higher income from trade causes people to increase their demand for a clean environment, and this in turn encourages producer to shift towards cleaner techniques of production. Thus, trade promotes tight pollution policies and spurs pollution reducing innovation and investment, reducing emissions level. Finally, trade openness via economic growth shifts the composition of economic output and this may impact the environment. The composition effect of trade for poor countries is likely to make them dirtier, whereas its effect for rich countries may make them cleaner.
Researchers have largely debated the environmental consequences of trade liberalization through theoretical models (Antweiler et al 2001, Copeland & Taylor, 2004), as well as cross countries (Kellenberg, 2008; Managi et al, 2009; Antweiler et al, 2001), time series (Perroni & Wigle, 1994; Baek et al, 2009), and sub-national (Chintrakarn & Millimet, 2006; Dean, 2002) empirical studies.
The majority of these studies found an overall improvement effect of trade on physical environment quality (Antweiler et al, 2001; Dean, 2002; Frankel & Rose, 2005) while some of them showed that this effect is conditional to the development level (Kellenberg, 2008; Baek et al, 2009) and the pollutant considered (Chintrakarn & Millimet, 2006).
2.1.2. Trade effect through specialization and pollution haven
In addition to its effect on pollution through economic prosperity, openness to international trade may also impact environment via pollution haven hypothesis. According to this hypothesis because environmental quality is a normal good, developing economies tend to adopt weak environmental regulations as compared to developed ones. Then, trade liberalization may lead to more growth of pollution-intensive industries in developing countries since developed countries enforce strict environmental standards, and poor countries do not have the capacity to impose these standards. Low environmental standards will become a source of comparative advantage for poor countries, and thus have a significant adverse effect on environment.
Opponents to this hypothesis argue that many other factors, in addition to pollution regulation, affect trade flows and plants localization and the pollution haven hypothesis depend on the strength of these factors. Empirical works on pollution haven hypothesis found ambiguous results. Tobey (1990), Grossman and Krueger (1993), Jaffe et al. (1995) emit serious doubt on the strength of the simple pollution haven hypothesis since they found that trade flows are primarily determined by factor endowment considerations and apparently not by differences in pollution abatement costs. However recent studies defend the existence of the migration of pollution-intensive plants led by environmental policies (Baek et al, 2009; Kellenberg, 2009).
2.1.3. Tariff escalation and environmental
Another important mechanism through which international trade may lead to a shift in environmental quality is tariff escalation. This concept refers to a characteristic of import duties which rise with the level of processing of the goods purchased. Authors generally argue that tariff escalation is a source of environmental harm to exporting countries (Repetto, 1994; WTO, 1995; French, 1993). Indeed, this discrimination of import duties according to the processing level reallocates the economic activities of exporting countries toward primary production and away from processing. Thus, it leads to excess extraction of natural resources, and then degradation of the resource base. As argued by Hecht (1997), the best way to assess the environmental impact of tariff escalation is to compare environmental degradation from raw materials with that from processing goods. A priori, the relative environmental impacts of primary and processing activities are difficult to evaluate in a given area because different and non-comparable environmental impacts are involved. The impact of primary commodity production affects the long-term sustainability of the resource base, through deforestation, soil
erosion, fertilizer and pesticide residue, habitat destruction, water pollution from agrochemical runoff while Processing activities, in contrast, will result in water and air pollution rather than in destruction of the resource base.
Some commodity studies provided by Hecht (1997) highlights that, environmental controls are more likely to be imposed on processing than primary production, suggesting that processing might be the less harmful activity. In addition, pollution from transport is higher for primary product than processing (WTO, 1995; French, 1993).
Moreover, tariff escalation may affect income growth and thus impact environment through the mechanisms already explained.
2.1.4. Trade liberalization and agricultural pollution
In the specific case of agricultural subsector, some arguments have been developed linking international trade to environmental concerns. The scale, technique and composition effects have been discussed for this sector since agricultural product export obviously leads to economic growth (Krissoff, et al 1996; Antle, 1993). Trade liberalization also modifies the relative price of agricultural inputs such as fertilizer, pesticide, tractors, and thus, has adverse impact on the physical environment. Given that developing countries generally import these inputs, openness to trade leads to pollution haven in agricultural subsector. Because of data scarcity, few studies investigated empirically this hypothesis. Through econometric estimation and simulation, Williams and Shumway, (2000) found that the North American Free Trade Agreement (NAFTA) is expected to increase chemical usage substantially in the United States and lead to greater groundwater contamination. They also showed that in Mexico, the expected effects are a substantial increase in fertilizer use but a decrease in pesticide use.
2.2. Agricultural trade and the environment
2.2.1. How does agricultural sector affect environmental quality?
Agricultural sector may be detrimental for environment in many ways. In fact, the growing demand for agricultural products, the increasing domestic food production by fewer individuals because of rural exodus, and the need of nontraditional export products as a means of increasing income, and earning valuable foreign currency for the country lead farmers to
address this problem is the excessive use of fertilizer and pesticides, and this has adverse effects in terms of environmental degradation. As explained by Ghatak and Turner (1978), fertilizers and pesticides are discharged into the ecosystem by drifting, dripping or leaking into areas surrounding the target area. “The deposited chemical is then transformed by living systems, heat, light and water to form a pesticide residue” (Ghatak & Turner, 1978, pp. 137). These residues are dispersed in the ecosystem through natural forces (biologically, physically), and human activities. They can be transported by fluid movements (wind, rain, etc.) in the environment. “They can vaporize from falling spray particles and from plant, soil and water surfaces; they can be carried physically as vapour or absorbed in wind-borne particles of soil and dust” (Ghatak & Turner, 1978, pp. 142). Thus, the use of these products in addition to animal feedlots, pastures, dairy farming and aquaculture leads agriculture to provoke soil and water pollution through the discharge of pollutants and residue (phosphorus, nitrogen, metals, pathogens, sediment, pesticides, biological oxygen demand, trace elements) to the soil as well as surface and groundwater, through net loss of soil by poor agricultural practices, and salinization. Agriculture is also responsible for a large amount of methane emission (second most important greenhouse gas) and nitrous oxide emission (third most important greenhouse gas).
Another way to address the problem of high agricultural product demand is the excessive use of water through irrigation, the use of mechanized agricultural methods rather than labor-intensive practices and/or extensive use of land. These methods affect physical environment respectively through water shortage, air pollution (CO2 emission) and deforestation. Agriculture is the single largest user of freshwater resources, using a global average of 70% of all surface water supplies according to Ongley (1996).
2.2.2. Agricultural export and environment
In many developing countries, economic growth is largely dependent on agricultural production, and the export of agricultural raw products represents a major source of foreign currency. This increasing demand makes a pressure on production, and therefore degrades physical environment. To assess whether the international trade of primary agricultural commodity is detrimental to environment or not, some important issues have to be addressed: (i) investigation of whether commodities exported are substitutes of local consumption goods in terms of production and then, are replacing them or are additional production, (ii) comparison of the environmental impacts of the production of export commodities and local
consumption goods, and (iii) comparison of the environmental impacts of primary production and processing.
If the production of goods to respond to the foreign demand is an additional source of production, it will create further environmental degradation to the existing ones. But, the answer to this first issue depends on the availability of land and workforce as well as the quality of the soil to produce both of the products, and other factors. In some countries of West Africa (Cote d’Ivoire, Mali, Burkina Faso), farmers produce cotton for export in detriment of some local consumption goods (maize, millet, etc). Other commodities production, such as coffee and cocoa require forest area and thus new lands. It is also possible for some crops, to find in the same field exported and local consumption production. However, if the commodities produced for export are just replacing local consumption goods, it is a priori difficult to anticipate the effect on the environment without further analysis. In this case the comparison of the environmental impacts of the production of export commodities and local consumption goods is required. If the environmental impact of export commodity is more than that of local consumption goods, an increasing production to satisfy foreign market demand will be detrimental in terms of environmental degradation. This comparison depends on the country in question since the commodity exported by a country is likely to be the local consumption production of another country. Many researchers argue explicitly or implicitly that export-crop production degrades more the physical environment since it is very pesticide and fertilizer intensive relative to national market production (Weir & Schapiro, 1981; Barry, 1987; Rosset, 1991; Murray, 1994; Andreatta, 1998; Jorgenson, 2007). The arguments used are generally based on the relatively large financial power of the producers of exported goods, their mechanization, as well as the large size of their farm. But some studies disagree with this point of view through country and product specific studies (Galt 2008).
Another important issue regarding the environmental degradation effect of raw agricultural product exports is the comparison of the environmental impacts of primary production and processing. This debate is largely developed in Hecht (1997), and the arguments are already discussed in tariff escalation subsection.
2.2.3. Health and agricultural pollution
(1993), the immediate and most important consequences of environmental degradation are damage to human health through different forms of diseases. Many authors have assessed how agricultural pollution may be associated to population’s health. Three large groups of people are potentially exposed to agricultural environmental pollution adverse effects. The first is constituted of farmers and farm workers since they are directly in contact with pesticide and fertilizer. The risks of this group is high in developing countries because of the inaccurate use of these chemical products such as careless preparation and application, lack of personal protective equipment, laxity of safekeeping of the chemicals, careless disposal of empty pesticide containers, consumption of food and beverages while working, lack of personal hygiene, deficiencies in safety training, weaknesses in occupational health legislation and regulations (Ecobichon 2001). The second group at risk is the populations that live in areas surrounding agricultural farms. These people are exposed through water and air pollution (biological oxygen demand, methane, nitrous oxide). The last group is people exposed to persistent agricultural chemical accumulated in food. This category includes habitual consumers of fish, livestock, and dairy products, fetuses and nursing infants whose mother’s bodies have accumulated substantial levels of persistent chemicals; and sick people who metabolize pesticide-bioaccumulated fatty tissues while ill (WRI, 1996). Dasgupta et al (2002) find evidence of pesticide contamination of food products. They show that these pesticide residues on agricultural products fall sharply as income increases.
3. Some stylized facts
The importance of trade in general, and that of exports in particular, is well known in development economics since it is the main source of earning valuable foreign currency, and a solution to small local market size. The ability of a country to export its products abroad can be considered as a sign of the good health of its economy given the competitiveness. There are large differences between geographical areas with regard to their exports of goods and services. Figure 1 presents the annual average volume export characteristics of different World Bank geographical regions between 1961 and 2009 as percentage of GDP. A simple observation of exports of goods and services shows that the Middle East and North Africa (MENA) region has the highest ratio with about 43% (top left graph). This region is followed respectively by East Asia and Pacific (EAP) with about 38%, Europe and Central Asia (ECA)
with about 37%, and Latin America and Caribbean (LAC) with about 35%. Sub Saharan Africa (SSA) exported annually during this period about 29% of its GDP on average.
In addition to the quantities exported which are largely led by the natural endowment of the region, the composition is also important since it emphasizes the dynamic of the economy in terms of efforts.
Figure 1: Exports characteristics of different World Bank geographical regions
0 1 0 2 0 3 0 4 0 e x p o rt o f g o o d s a n d s e rv ic e s ( % G D P )
SSA EAP ECA LAC MENA SA NA
0 .5 1 1 .5 2 2 .5 e x p o rt o f p ri m . a g ri . c o m m . (% G D P )
SSA EAP ECA LAC MENA SA NA
0 2 4 6 8 1 0 e x p o rt o f a ll p ri m . c o m m . (% G D P )
SSA EAP ECA LAC MENA SA NA
0 5 1 0 1 5 e x p o rt o f n o n p ri m . co m m . (% G D P )
SSA EAP ECA LAC MENA SA NA
Source: Author’s construction with data from World Bank and United Nations COMTRADE
Indeed, the large exports of MENA and SSA regions are largely led by primary commodities (bottom left graph), while those of EAP and ECA are dominated by processed products (bottom right graph). This is not surprising given the natural endowment of MENA countries in oil products and the economic growth success of the emerging Asian countries largely
enabled by manufactured products. For African countries the exports are largely constituted of agricultural primary commodities in addition to oil products (top right graph).
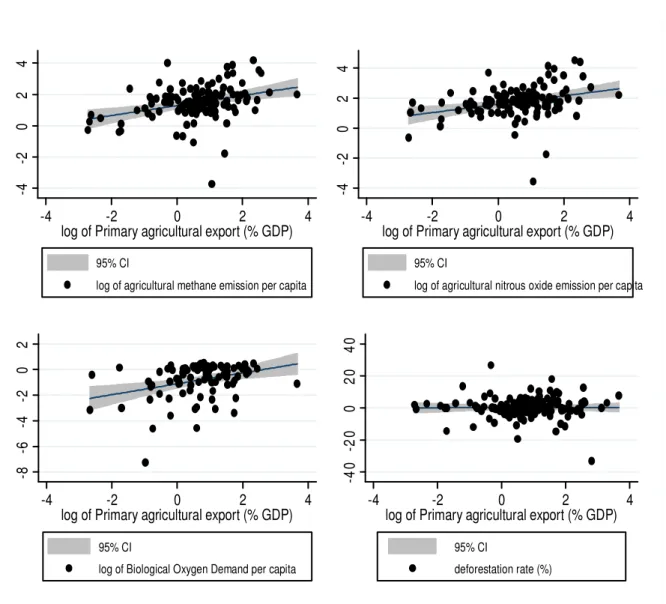
The production of these primary commodities may lead to some environmental adverse problems as explained before. Figure 2 shows the association between agricultural primary commodity export as percentage of GDP and some environmental indicators (agricultural methane emissions, agricultural nitrous oxide emissions, biological oxygen demand, and deforestation rate). For each of these indicators, agricultural raw commodities export is positively associated to environmental degradation, even if the case of deforestation is not clear, and these are simple correlation.
Figure 2: Primary agricultural commodity export and environmental quality
-4 -2 0 2 4 -4 -2 0 2 4
log of Primary agricultural export (% GDP)
95% CI
log of agricultural methane emission per capita
-4 -2 0 2 4 -4 -2 0 2 4
log of Primary agricultural export (% GDP)
95% CI
log of agricultural nitrous oxide emission per capita
-8 -6 -4 -2 0 2 -4 -2 0 2 4
log of Primary agricultural export (% GDP)
95% CI
log of Biological Oxygen Demand per capita
-4 0 -2 0 0 2 0 4 0 -4 -2 0 2 4
log of Primary agricultural export (% GDP)
95% CI
deforestation rate (%)
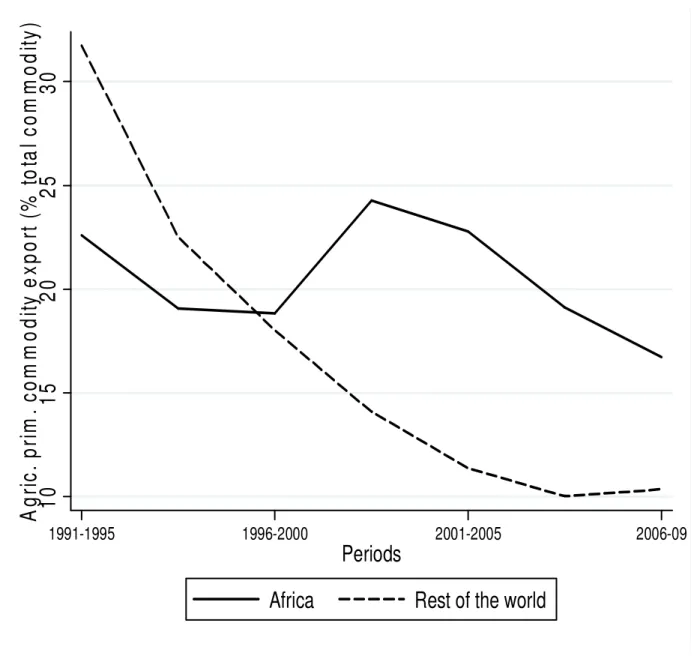
To solve for this issue, one possibility for African countries is to progressively transform their raw products, and thus create value addition before exporting them. Figure 3 emphasizes the evolution of the primary agricultural commodity export in Africa and the rest of the world between 1991 and 2009.
Figure 3: Evolution of primary agricultural export in Africa and the rest of the world
1
0
1
5
2
0
2
5
3
0
A
g
ri
c
.
p
ri
m
.
c
o
m
m
o
d
it
y
e
x
p
o
rt
(
%
t
o
ta
l
c
o
m
m
o
d
it
y
)
2006-09 2001-2005 1996-2000 1991-1995Periods
Africa
Rest of the world
Before 1995, the share of primary commodities in Africa was less than that of the rest of the world. But after this date, on average, Africa exported in percentage of total commodity more agricultural primary commodities than the rest of world. This is mainly due to the large downward trend in the rest of the world (from about 35% in 1991-1996 to about 10% in 2006-2009) and the negligible diminution in African countries during this period. This evolution is not bright with regard to its environmental impact and many efforts need to be done to transform agricultural product in Africa before exporting them.
4. Empirical design
In this section, we present first the econometric models and the estimation methodology before showing the data and variables used in this paper.
4.1. Estimation methodology
This subsection is devoted to the econometric specifications. The analysis is subdivided into three main steps. First, the effect of agricultural primary commodity export on environmental quality is assessed. Then, we evaluate how environmental degradation affects population’s health. Finally, these two effects are examined simultaneously.
4.1.1. Environmental effect of primary agricultural commodity export
The objective of this subsection is to assess the effect of agricultural primary commodity export on environmental degradation. Based on important papers in environmental economics such as Gangadharan & Valenzuela (2001) and Drabo (2010a), we introduce trade variable in existing environmental equation. Thus, the econometric relationship between agricultural raw commodity export and environment can be written as follows:
'
it it it it
environment =αagrprimcom +X β ε+
(1)
Where environmentit represents the environmental degradation of country i in period t. agrprimcom is the indicator of agricultural primary commodity export, X the matrix of control variables commonly used in the literature, and εit is the error term.
α
, our coefficientof interest, is expected to be positive (
α
>0). As control variables, we use: Gross Domestic Product (GDP) per capita and its square: according to environmental economics, thedevelopment level of an economy is associated to environmental degradation through an inverted-U curve. Thus, in the course of economic growth and development, environmental quality initially worsens but ultimately improves with improvements in income level. This relationship is known as Environmental Kuznets Curve hypothesis (Grossman & Krueger, 1995). We also use the population’s density, the urban population as percentage of total population, the level of education, the foreign direct investment, and the agricultural value addition in GDP. All these variables have been used in the literature (Gangadharan & Valenzuela, 2001).
This econometric model (Equation 1) could be estimated through panel data with standard Ordinary Least Squares (OLS). But the application of this estimator to our model suffers from the endogeneity of the primary agricultural commodity variable, leading to biased estimate of
α
. This problem arises because of two main reasons. There is likely a reverse causality in the relationship between environment and agricultural primary commodity export. In fact, good environmental quality may lead to more productions and exports through the increase in farmers’ productivity and soil profitability. This potential simultaneity can be a source of endogeneity. Moreover, Agricultural primary commodity export could also be a proxy of some variables that have significant effect on environment, such as the technology use and the weather (precipitation). In order to solve this problem, we estimate Equation (1) with the Two Stages Least Square (2SLS) method. This method requires instrumental variables for the endogenous explanatory variables. To be a good candidate for instrument, a variable must be correlated with the endogenous explanatory variables, and not correlated with the error terms. That is, the instrument must affect the dependent variable only through the endogenous explanatory variables. Two specification tests check the validity of the instruments. The first is the standard Sargan/Hansen test of over-identifying restrictions. The second test, namely the Fisher statistic of the instrumentation equation, examines the hypothesis of the strength of the instruments in the explanation of the endogenous explanatory variables.Two variables are used as instruments of the agricultural primary commodity, our variable of interest: the agricultural land per total land area and the Agricultural machinery, tractors per 100 square kilometer of arable land. These variables obviously are positively related to agricultural exports since they are inputs of agricultural production function. They are also uncorrelated with the terms of error because they affect environment only via agricultural production.
4.1.2. Health effect of agricultural pollution
In this subsection, the effect of agricultural pollution on population’s health is modelled. Based on some important existing empirical works (white et al., 2003; Gwatkin et al., 2007; Berthelemy & Seban, 2009; Drabo, 2010b, 2011), health status is expressed as a function of environmental quality and other explanatory variables, and the following model is specified:
it i it k kit t it
Health =
η
+γ
environment +θ
Z +ψ
+ω
(2)Where Health represents health status measure and Zit is the matrix of the control variables. i
η
andψ
t represent respectively the country and time fixed effects, andω
it is the error term. We expect our coefficient of interest, γ , to be more than zero (γ >0). We used variables of control already existing in the literature: GDP per capita, immunization rate, education, fertility rate, and income inequality.Equation (2) is estimated with standard fixed effects ordinary least squares since we do not expect any potential source of endogeneity of our variable of interest (environment) that may lead to biased estimate of γ . Indeed, three sources of endogeneity are generally pointed out in the literature. It may firstly be caused by the reverse causality between the variable of interest and the dependent variable. In our model, this seems not to be a problem since we do not expect any mechanism through which population health may affect environment. One could suppose that health may impact environment through its effect on income and development level. Even though this argument seems less relevant, it cannot affect our identification strategy since we control for development level. Another source of endogeneity is omitted variables bias. This problem occurs when there is a third variable, which could simultaneously affect environment and population health. In our model we control for all potential variables of this sort to avoid this problem. Finally, endogeneity may be caused by measurement error. We do not suspect any error in the measure of our variable of interest.
4.1.3. Simultaneous estimation of the two effects
In the previous subsections, we modelled the effect of primary agricultural commodity export on pollution, and this environmental effect on population’s health. Our objective is to show that environmental degradation is a channel through which the export of agricultural primary products impact health. To clearly shed light this effect we estimate in this section Equations (1) and (2) simultaneously.
' it it it it it it k kit it environment agrprimcom X Health environment Z
α
β ε
γ
θ
ω
= + + = + + (3)This model is estimated with Three Stages Least Square method (3SLS). It takes into account the likely correlation between the error terms of the two equations, the endogeneity issue of environmental variable, and the heteroscedasticity as well as the serial correlation of the error terms.
4.2. Data and variables
The data used in this paper cover the period 1991-2009 subdivided into 4 periods of 5 years and we retain for the basic regression 119 developed and developing countries (because of data availability, see Appendix A4). As agricultural primary commodity indicator, we follow the Standard International Trade Classification. In this classification, the first five categories are considered as primary commodities. We keep those of these primary commodities related to agricultural sector, and we express it as percentage of GDP, abandoning the oil and mineral ones. Thus, this variable contains food and live animals, beverages and tobacco, crude materials, inedible, except fuels, and animal and vegetable oils and fats. These data are taken from the United Nations dataset COMTRADE. The instrumental variables, agricultural land per total land area and the Agricultural machinery are taken from WDI.
Environmental variable is represented by three main indicators chosen because of their close link to agricultural activities, and all taken from World Bank dataset World Development Indicators (WDI): agricultural methane emission per capita, agricultural nitrous oxide emissions per capita, and Biological Oxygen Demand (BOD) per capita. Methane (CH4) is a
greenhouse gas that contributes to global warming and ozone air pollution. More than fifty percent of this gas is emitted from agricultural activities. As shown by West et al, (2006), a 20 percent reduction in human methane emissions from current levels would prevent an estimated 370,000 premature deaths worldwide between the years 2010 and 2030, and the large reduction will occur in Africa with 5.59 deaths avoid per 106 habitants. Like methane, the first source of nitrous oxide (N2O) emissions is agriculture through for example heavy
utilization of synthetic nitrogen fertilizers in crop production, livestock manure, and sewage treatment. It is also an important greenhouse gas, and a significant ozone-destroyer that is becoming an increasingly larger fraction of the emissions of ozone-depleting substances.
BOD is a measure of the oxygen used by micro organisms to decompose waste. Micro organisms such as bacteria are responsible for decomposing organic waste. When organic matter such as dead plants, leaves, grass clippings, manure, sewage, or even food waste is present in a water supply, the bacteria will begin the process of breaking down this waste. If there is a large quantity of organic waste in the water supply, there will also be a lot of bacteria present working to decompose this waste. In this case, the demand for oxygen will be high (due to all the bacteria) so the BOD level will be high. We also use deforestation rate, taken from Food and Agriculture Organization (FAO) dataset FAOSTAT as robustness checks for African sample.
Infant mortality rate, under five mortality rate, and life expectancy at birth are used to represent health indicators. For life expectancy, we used a modified version, namely log(80-life expectancy) as used in the economic growth literature. The mortality rates are from UNICEF and World Bank dataset, and the life expectancy is from WDI.
As explanatory variables, we use GDP per capita PPP constant 2005 international $, primary school enrollment (% gross), population density (people per square kilometer), urban population (% of total), foreign direct investment (% GDP), Agriculture value added per worker (constant 2000 US$), Immunization rate against diphtheria, pertussis and tetanus (DPT), fertility rate (total births per woman), and Income share held by highest 10% as income inequality indicator, all taken from World Bank dataset World Development Indicator (WDI).
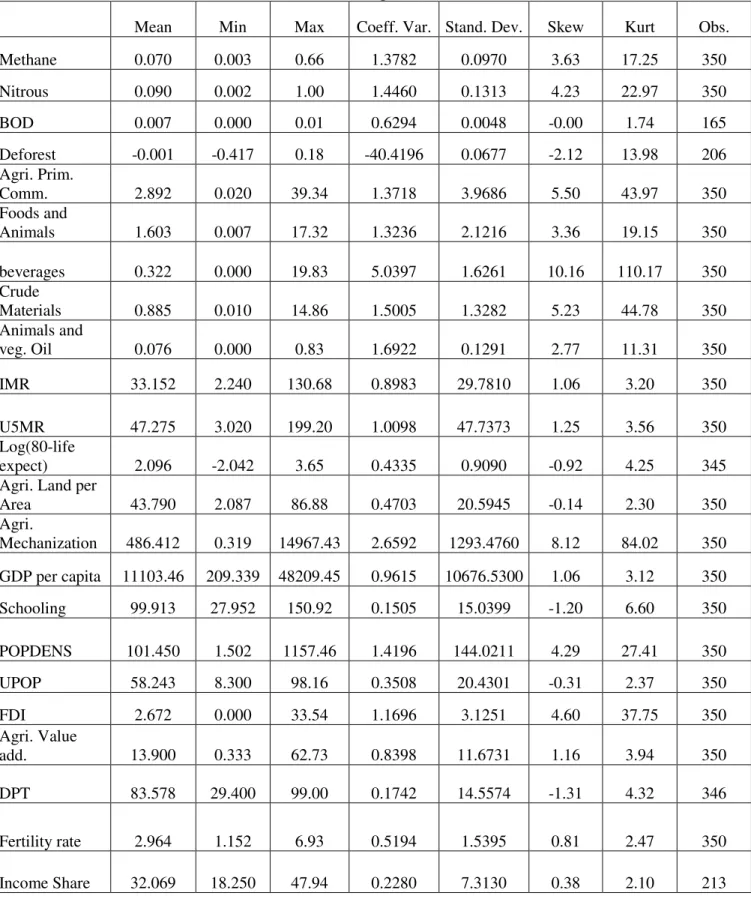
Important descriptive statistics for all these indicators (minimum, the maximum, the mean, etc.) are presented in Table A1, Appendix A. This table is completed by Table A2 and Table A3 which show respectively the correlation between important variables, and the variables list, definitions, and sources.
5. Econometric results and discussions
This section presents and discusses the results obtained through our empirical investigations. It is subdivided into three subsections. First, the results of the effect of agricultural primary commodity export on environmental indicators are presented. Then, the effect of agricultural environmental pollution on health status is discussed. Finally, the results of the simultaneous estimation of the health and environmental equations are presented.
5.1. Agricultural primary commodity export and pollution
The results obtained from the estimation of Equation (1) are presented in Table 1 for two samples: the whole sample in the three first columns and African sample in the last three columns. The dependent variable is environmental quality, measured by three different indicators (the natural logarithmic form of agricultural methane emission per capita, the natural logarithmic form of agricultural nitrous oxide emissions per capita, and the Biological Oxygen Demand (BOD) per capita). This equation is estimated with Two Stages Least Square estimator and the variable of interest, the natural logarithmic form of agricultural primary commodity export, is taken as endogenous and then instrumented by the natural logarithmic form of agricultural land per total land area and the natural logarithmic form of agricultural machinery, tractors per 100 square kilometer of arable land. The quality of these instruments is assessed through the Fisher statistic of the first stage and the Hansen over identification test results presented at the bottom of this table. These tests indicate that our instruments generally satisfy the criteria required. The first stage estimation results, presented in Table A5, Appendix A complement these tests.
The results suggest that agricultural commodity export increases environmental degradation whatever the environmental indicator and the sample considered, since its coefficients are positive and statistically significant, except for BOD in African sample. The agricultural primary commodity export elasticity of agricultural methane and nitrous emissions are respectively 1.165 and 1.29 for the whole sample, and 0.231 and 0.287 for African sample, and for the average country in the sample considered. These results are largely different from the Ordinary Least Square (OLS) estimates presented in Table A6, Appendix A, and in which only the coefficient of BOD for African sample is statistically significant, suggesting a downward bias without instrumentation.
With regard to the variables of control, the lag of GDP per capita has a positive and statistically significant coefficient showing that income growth degrades environmental quality. But the negative and significant coefficient of its square brings more precisions. Indeed, there is an economic development threshold below which economic expansion increases pollution level, and improves environmental quality above it. Moreover an increase in foreign direct investment, urban population, and population density reduces agricultural
pollution, while education level and agricultural value addition do not have any statistically significant effect on this environmental quality.
Table 1: 2SLS results of the environmental effect of agricultural export Dependent variables
Whole sample Africa sample
(1) (2) (3) (4) (5) (6)
Independent variables Methane Nitrous BOD Methane Nitrous BOD
Log Agri. Prim. Comm. export 1.165*** 1.290*** 0.004* 0.231** 0.287*** 0.0004 (4.61) (5.00) (1.90) (2.57) (3.60) (0.46) Log GDP per capita (-1) 2.557** 2.800** 0.018** 5.396*** 3.442** 0.010 (2.16) (2.50) (2.47) (4.42) (2.53) (1.14) Log GDP per capita square (-1) -0.133** -0.139** -0.001** -0.371*** -0.218** -0.001 (2.01) (2.22) (2.13) (4.22) (2.25) (1.26) Log Schooling 0.503 -0.454 -0.004 -0.194 -0.208 0.002 (1.00) (0.92) (1.48) (0.70) (0.72) (1.35) Log POPDENS -0.176*** -0.218*** 0.001*** -0.723*** -0.407*** -0.0004 (3.28) (4.04) (2.99) (6.82) (4.75) (1.32) Log FDI -0.841*** -0.350 -0.003** -0.551*** -0.506*** 0.0002 (2.72) (1.13) (2.14) (2.80) (2.85) (0.10) Log UPOP -0.244*** -0.311*** -0.0004 0.085 0.049 0.00001 (2.83) (3.35) (0.88) (1.61) (0.99) (0.05) Agri. Value add. 0.012 0.016 2.9e-06 -0.006 0.003 -0.00004
(0.90) (1.13) (0.05) (0.73) (0.30) (1.19) Constant -14.03*** -12.7*** -0.059** -17.1*** -12.2** -0.043* (3.19) (3.00) (2.48) (3.62) (2.40) (1.79)
Time dummies yes yes yes yes yes yes
Observations 350 350 201 69 69 32
Fisher statistic of first stage 7.43 7.43 3.70 9.88 9.88 1.67
Hansen OID p-value 0.21 0.08 0.24 0.56 0.43 0.83
Notes: The dependent variables are in natural logarithmic form. Robust absolute t statistics in parentheses, *
The coefficient of population density seems surprising since we expected the opposite sign. It may be explained by the fact that an increase in population density is firstly an urban area concerns rather than agricultural population, mainly based in rural places.
5.2. Agricultural pollution and health
In the previous subsection, we showed that the export of raw agricultural commodities is harmful for environment. Here we present the results of this environmental effect on population’s health in Table 2. The health variable is represented by three indicators: infant mortality rate, under five mortality rate, and the modify life expectancy (log(80-life expectancy)). The variable of interest, agricultural pollution is also measured by three indicators: agricultural methane and nitrous emissions per capita, and the Biological Oxygen Demand (BOD). These results are obtained from OLS fixed effects estimations of equation 2 for the whole sample.
The coefficients of our variables of interest (environmental degradation) have the correct signs and are statistically significant, except for BOD in the modified life expectancy equation. These results suggest that, pollutions from agricultural sector worsen population heath, confirming our theoretical argumentation.
The majority of the variables of control present the expected sign. Indeed, GDP per capita and immunization rate significantly improve population’s health, while fertility rate degrades it. Education level appears not statistically significant and the coefficient of income inequality is unstable.
Equation (2) is also estimated for African sample and the results are presented in Table A7, Appendix A. Because of low sample size, we do not succeed to assess the effect of BOD. This table shows that agricultural methane emissions deteriorate population health, while agricultural nitrous oxide emissions appear not statistically significant. This is likely due to the fact that, only excessive exposure to nitrous oxide may affect health. Given the low amount of fertilizer used in African countries (the main source of agricultural nitrous emissions), the hazardous level is probably not reached.
Table 2: Health impact of environmental degradation Dependent variables: Health status
Log Infant mortality rate Log Under 5 mortality rate Log (80-life expectancy)
Indep. variables (1) (2) (3) (4) (5) (6) (7) (8) (9) Log Methane (-1) 0.273*** 0.263*** 0.145** (3.51) (3.17) (2.52) Log Nitrous (-1) 0.252*** 0.245*** 0.130*** (4.14) (3.51) (3.27) BOD (-1) 62.51** 58.01* 4.128 (2.25) (1.92) (0.24)
Log GDP per capita (-1) -0.398*** -0.440*** -0.701*** -0.427*** -0.469*** -0.742*** -0.485*** -0.505*** -0.460*** (4.14) (4.58) (3.61) (4.00) (4.38) (3.39) (4.74) (5.05) (3.86) Immunization DPT -0.005** -0.006** -0.018*** -0.006** -0.006** -0.017*** 0.000 -0.000 -0.007***
(2.18) (2.37) (3.64) (2.27) (2.47) (3.47) (0.08) (0.05) (2.74) Log Schooling (-1) 0.001 0.002 0.004* 0.001 0.002 0.004 0.001 0.001 0.002 (0.43) (0.89) (1.83) (0.33) (0.76) (1.49) (0.50) (0.79) (1.29) Log Fertility rate 1.023*** 1.099*** 0.754** 1.146*** 1.219*** 0.925*** 0.917*** 0.958*** 1.158***
(6.25) (7.18) (2.60) (6.47) (7.38) (2.84) (7.54) (7.50) (6.58) Log Income share 0.090 -0.053 -0.818** 0.067 -0.071 -0.812** 0.008 -0.067 -0.630***
(0.64) (0.40) (2.37) (0.45) (0.51) (2.26) (0.06) (0.55) (3.33) Constant -0.481 0.124 4.935** 0.022 0.619 5.363** 5.741*** 6.037*** 7.608***
(0.43) (0.11) (2.21) (0.02) (0.51) (2.27) (6.51) (7.06) (6.73)
Time dummies yes yes yes yes yes yes yes yes yes
Observations 252 252 101 252 252 101 252 252 101
Countries 108 108 66 108 108 66 108 108 66
R² 0.71 0.70 0.70 0.72 0.71 0.69 0.66 0.65 0.70
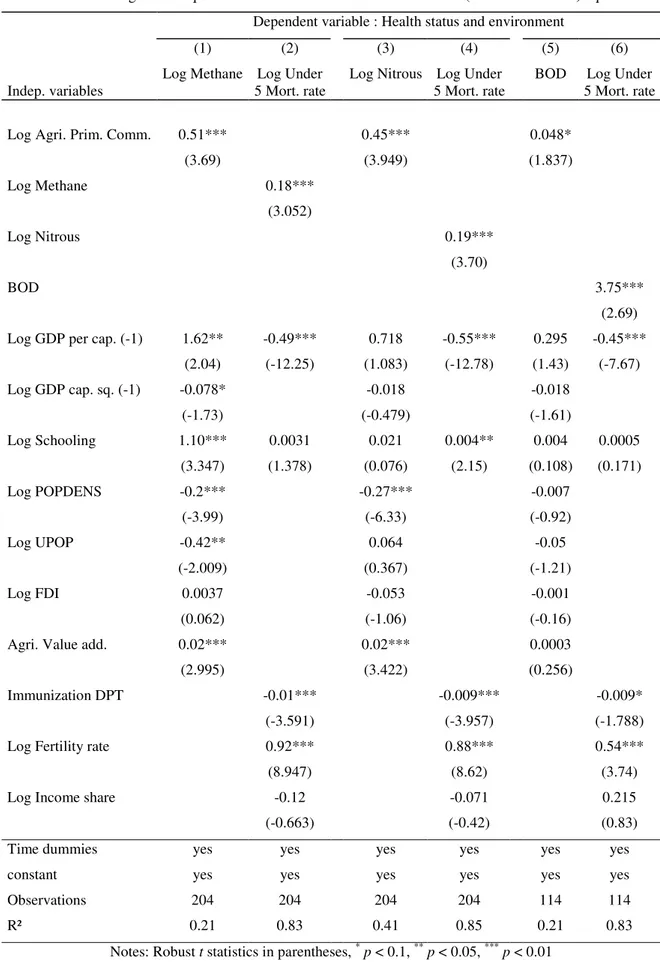
5.3. Results from the simultaneous estimation
To assess the role of environmental degradation as a channel of transmission of the impact of agricultural primary commodity export on health status, Equation (1) and (2) are estimated simultaneously with 3SLS method and the results are presented in Table 3 for health variable measured by under five mortality rate. Agricultural commodity export variable is considered as endogenous and instrumented by the natural logarithmic form of agricultural land per total land area and the natural logarithmic form of agricultural machinery, tractors per 100 square kilometer of arable land. Columns (1), (3) and (5) confirm the results obtained in Table 1, namely the export of agricultural primary products degrade the physical environment. Columns (2), (4) and (6) show that, these pollutions from agricultural sector are harmful for under five mortality rate.
The results obtained when health is measured by infant mortality rate and modified life expectancy are presented respectively in Table A8 and Table A9, Appendix A. They remain similar to those presented in Table 3 for under five mortality rate.
6. Robustness checks
In previous sections, we demonstrated that raw commodity export degrades physical environment. The present section investigates whether this result is robust to (1) different primary commodity subgroup, (2) other environmental indicator, and (3) the inclusion of openness variable.
6.1. Disaggregation of primary agricultural product into subgroups
To see which subgroup of primary agricultural commodity export is detrimental for pollution, we estimate Equation (1) by replacing the export of raw agricultural products by its four subgroups: food and live animals, beverages and tobacco, crude materials, inedible, except fuels, and animal and vegetable oils and fats. Each commodity subgroup is considered as endogenous and instrumented by the natural logarithmic form of agricultural land per total land area and the natural logarithmic form of agricultural machinery.
Table 3: Three stages least square estimation of environmental and health (und. 5 Mort. Rate) equations Dependent variable : Health status and environment
(1) (2) (3) (4) (5) (6)
Indep. variables
Log Methane Log Under 5 Mort. rate
Log Nitrous Log Under 5 Mort. rate
BOD Log Under 5 Mort. rate
Log Agri. Prim. Comm. 0.51*** 0.45*** 0.048* (3.69) (3.949) (1.837) Log Methane 0.18*** (3.052) Log Nitrous 0.19*** (3.70) BOD 3.75*** (2.69) Log GDP per cap. (-1) 1.62** -0.49*** 0.718 -0.55*** 0.295 -0.45***
(2.04) (-12.25) (1.083) (-12.78) (1.43) (-7.67) Log GDP cap. sq. (-1) -0.078* -0.018 -0.018 (-1.73) (-0.479) (-1.61) Log Schooling 1.10*** 0.0031 0.021 0.004** 0.004 0.0005 (3.347) (1.378) (0.076) (2.15) (0.108) (0.171) Log POPDENS -0.2*** -0.27*** -0.007 (-3.99) (-6.33) (-0.92) Log UPOP -0.42** 0.064 -0.05 (-2.009) (0.367) (-1.21) Log FDI 0.0037 -0.053 -0.001 (0.062) (-1.06) (-0.16) Agri. Value add. 0.02*** 0.02*** 0.0003 (2.995) (3.422) (0.256)
Immunization DPT -0.01*** -0.009*** -0.009* (-3.591) (-3.957) (-1.788) Log Fertility rate 0.92*** 0.88*** 0.54*** (8.947) (8.62) (3.74) Log Income share -0.12 -0.071 0.215 (-0.663) (-0.42) (0.83) Time dummies yes yes yes yes yes yes constant yes yes yes yes yes yes Observations 204 204 204 204 114 114 R² 0.21 0.83 0.41 0.85 0.21 0.83
Notes: Robust t statistics in parentheses, * p < 0.1, ** p < 0.05, *** p < 0.01
Table 4: 2SLS results of the methane effect of agricultural export disaggregated Dependent variable: log Methane per capita
Indep. variables (1) (2) (3) (4)
Log Foods and Animals 0.872*** (6.16)
Log beverages 0.726***
(3.87)
Log Crude Materials 1.947**
(2.57)
Log Animals and veg. Oil 1.595*
(1.95) Log GDP per cap. (-1) 1.457* 3.083** 5.987** 4.148 (1.83) (2.07) (2.06) (1.51) Log GDP cap. sq. (-1) -0.073 -0.172** -0.320** -0.237 (1.61) (2.08) (1.98) (1.48) Log Schooling 0.930** -0.881 -0.281 -0.949 (2.26) (1.15) (0.31) (0.60) Log POPDENS -0.330*** -0.503*** 0.244 -0.263* (6.82) (6.13) (0.99) (1.81) Log UPOP -0.488* -0.786** -1.771*** -1.259* (1.90) (2.22) (2.58) (1.65) Log FDI -0.112** -0.147 -0.406* -0.143 (2.10) (1.60) (1.82) (0.58)
Agri. Value add. 0.026** 0.038* -0.011 0.009
(2.24) (1.95) (0.48) (0.32)
Constant -11.354*** -5.883 -21.143** -4.591
(3.56) (1.05) (2.42) (0.62)
Time dummies yes yes yes yes
Observations 356 354 356 350
Fisher statistic of first stage 13.06 7.68 2.44 1.54
Hansen OID p-value 0.26 0.41 0.55 0.34
They show that the instruments significantly predict each subgroup of primary commodity. Table 4 presents the results when agricultural methane is used as environmental variable. The export of each subgroup of primary commodity increases the emissions of this pollutant. The Environmental Kuznets Curve is also verified.
Tables A11 and A12, Appendix A respectively present the results when agricultural nitrous oxide and BOD are used to measure environmental degradation. The results obtained are similar to the case of agricultural methane.
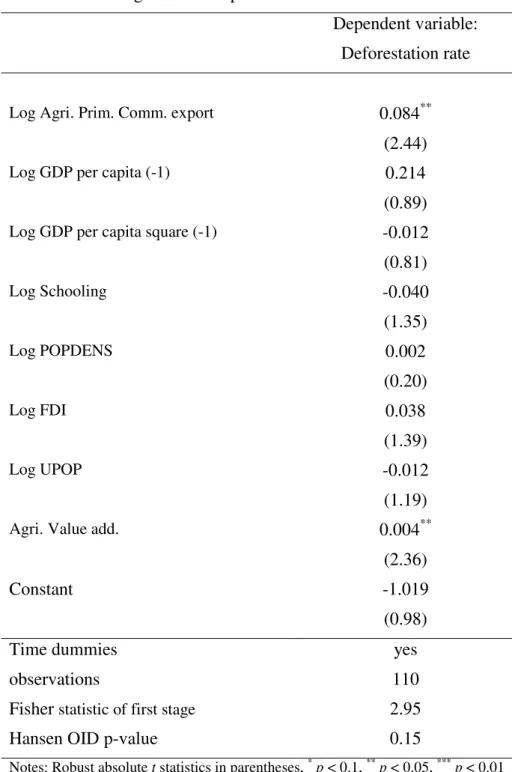
6.2. Deforestation as environmental indicator
The second robustness check concerns the use of deforestation rate as environmental indicator for African sample. In many African countries, a large part of the forest disappeared in less than half a century mainly because of agriculture. To examine the responsibility of agricultural primary commodity export in the lost of these forest areas, we estimate Equation (1) with 2SLS estimator and deforestation rate as environmental indicator. The results obtained are presented in Table 5. The coefficient of commodity export is positive and statistically significant, showing that the export of primary agricultural product is in part responsible for deforestation in Africa.
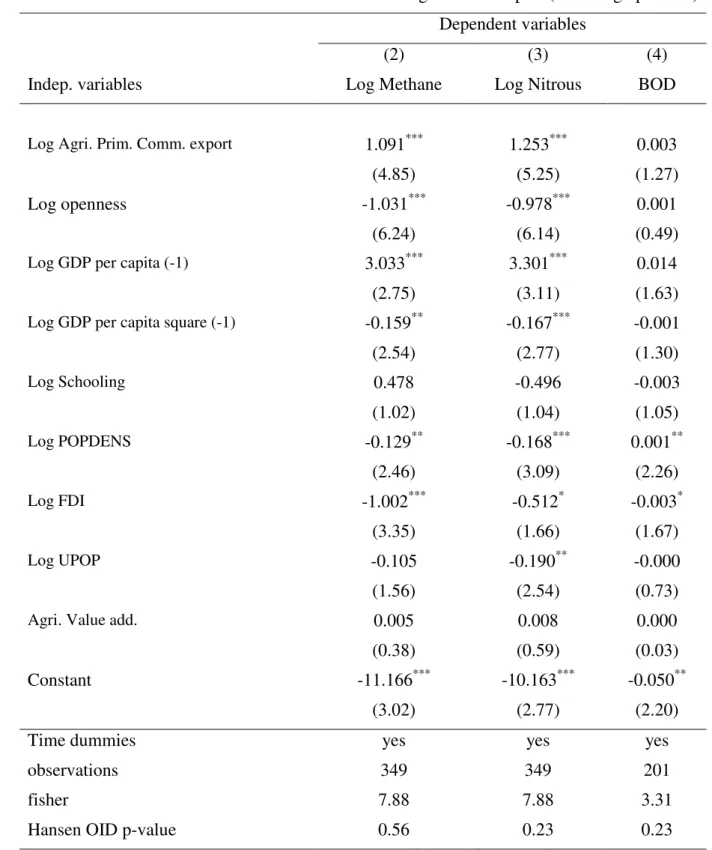
6.3. Inclusion of openness variable
We assess the effect of agricultural primary commodity trade on environment without taking into account trade openness. One could argue that, the results obtained are led by openness rather than a subgroup of export. To correct for that, we include trade openness (export plus import as ratio of GDP) in Equation (1) and we estimate it with 2SLS. The results are presented in Table 6 and they are similar to those already obtained.
Table 5: Agricultural export and deforestation in Africa Dependent variable:
Deforestation rate
Log Agri. Prim. Comm. export 0.084**
(2.44)
Log GDP per capita (-1) 0.214
(0.89)
Log GDP per capita square (-1) -0.012
(0.81) Log Schooling -0.040 (1.35) Log POPDENS 0.002 (0.20) Log FDI 0.038 (1.39) Log UPOP -0.012 (1.19)
Agri. Value add. 0.004**
(2.36)
Constant -1.019
(0.98)
Time dummies yes
observations 110
Fisher statistic of first stage 2.95
Hansen OID p-value 0.15
Table 6: 2SLS results of the environmental effect of agricultural export (including openness) Dependent variables
(2) (3) (4)
Indep. variables Log Methane Log Nitrous BOD
Log Agri. Prim. Comm. export 1.091*** 1.253*** 0.003
(4.85) (5.25) (1.27)
Log openness -1.031*** -0.978*** 0.001
(6.24) (6.14) (0.49)
Log GDP per capita (-1) 3.033*** 3.301*** 0.014
(2.75) (3.11) (1.63)
Log GDP per capita square (-1) -0.159** -0.167*** -0.001
(2.54) (2.77) (1.30) Log Schooling 0.478 -0.496 -0.003 (1.02) (1.04) (1.05) Log POPDENS -0.129** -0.168*** 0.001** (2.46) (3.09) (2.26) Log FDI -1.002*** -0.512* -0.003* (3.35) (1.66) (1.67) Log UPOP -0.105 -0.190** -0.000 (1.56) (2.54) (0.73)
Agri. Value add. 0.005 0.008 0.000
(0.38) (0.59) (0.03)
Constant -11.166*** -10.163*** -0.050**
(3.02) (2.77) (2.20)
Time dummies yes yes yes
observations 349 349 201
fisher 7.88 7.88 3.31
Hansen OID p-value 0.56 0.23 0.23
7. Concluding remarks
In economic literature of the last two decades, the impact of trade openness on environmental degradation has been largely assessed, and scholars generally found a slightly negative association between the two variables. But, empirical assessments of the role played by each component of trade openness are scarce.
This paper bridges that gap by investigating the responsibility of agricultural primary commodity export in environmental degradation, and the association between this pollution variable and population’s health. We introduce respectively primary commodity export and pollution variables in existing econometric environmental and health models. To complete our study, we evaluate the impacts of each subcomponent of agricultural primary commodity export on environmental indicators.
Our results obtained with instrumental variable estimators for the whole and African sample confirm our theoretical hypothesis, namely, the export of agricultural primary products increases agricultural methane and nitrous oxide emissions as well as water pollution (biological oxygen demand). This environmental degradation from trade worsens population’s health outcomes (infant and child mortality rates and life expectancy at birth). These results appear to be robust to different subcomponents of primary agricultural export, to the inclusion of openness variable, and to other environmental variables considered.
The results obtained from this paper point out important policy recommendations for developing countries in general and African ones in particular. Indeed, population’s health is doubtless an important concern for policy makers as well as the international community. This importance is justified by the great number of international conferences focusing on specific or general health preoccupation (the international conference on primary health care held in Alma-Ata, Kazakhstan, is an example), and the dominant place given to health in international development strategies (Millennium Development Goals (MDGs)). Among all the MDGs, the health ones are the farthest from the targets (UNECA, 2010). Our results give additional tools to policy makers, since they may improve health outcomes through the modification of the composition of exports.
Another important issue is climate change. The paper clearly points out the disastrous effect primary agricultural products export on two important greenhouse gas emissions (methane, nitrous oxide). Given the large destructive effect of natural disasters and the low resilience of
poor countries, it is better to avoid such events, and one way to do so is to minimize the share of primary agricultural commodity in export.
These implications raise an important question: how to reduce the export of primary agricultural commodity without affecting the dynamism of the economy. The first possibility is to transform raw products before exporting them. In addition to the creation of value addition and the reduction in unemployment, this will improve environmental quality and population’s health. In Africa the share of processed goods in the export remains very low because of the low level of industrialization. One way to solve for this is to abandon the short term views, and target long term policies in the education and financing systems. Education should target long term development needs through appropriate technology acquisition, research and development, and improvement and implementation of traditional existing knowledge. This will enable the production of manufactures and reduce the dependence to primary commodity export. Another important issue concerns the difficulties faced by Africans to finance their initiatives. Banking systems should be reformed in order to ease the access to credit, and the development of the private sector. Tariff escalation issue also needs to be addressed to encourage the export of processed commodities.
The second possibility is to produce more local consumption products instead of forcing the production of some agricultural products for export. This will reduce the dependence to the rest of the world and improve food security situation. Government could make that possible through programs targeting directly this sector for example. The problems from such policy are the ability to find alternative source of foreign currency, since for many poor countries agricultural sector is the main source.
Despite the importance of the findings of this paper, it does not tell us precisely how primary commodity export increases environmental degradation. Does the pressure of this kind of export increase of agricultural size through the use of additional land? Is the production of export agricultural commodities more environmental harmful than that of local consumption goods? Or/and, is the export of raw products more pollution intensive than processed ones? Next papers on this topic should investigate these questions, and highlight our results.
References
Andreatta, S.L., (1998). “Agrochemical exposure and farm worker health in the Caribbean: a local/global perspective”. Human Organization 57 (3),350–358.
Antle, J. M., (1993). “Environment, Development, and Trade between High- and Low- Income Countries”, American Journal of Agricultural Economics, 75(3), 784-788. Antweiler Werner, Copeland Brian R., Taylor M. Scott, (2001). “Is Free Trade Good for the
Environment? The American Economic Review, 91(4) : 877-908.
Baek Jungho, Cho Yongsung, Koo Won W., (2009). “The environmental consequences of globalization: A country-specific time-series analysis”. Ecological Economics 68 : 2255–2264.
Balassa, B., 1985. "Exports, Policy Choices, and Economic Growth in Developing Countries After the 1973 Oil Shock," Journal of Development Economics, 18, pp. 23-35.
Barry, T., (1987). “Roots of Rebellion: Land and Hunger in Central America”. South End
Press, Boston.
Berthelemy, J.-C. & Seban, J. (2009). “Dépenses de santé et équité dans l’accès aux services de santé dans les pays en développement”. Revue d’économie du développement, 23(1), 33–71.
Brock, William A. and Taylor, M. Scott, 2005. “Economic Growth and the Environment: A Review of Theory and Empirics”. Handbook of Economic Growth, Volume 1B. Edited
by Philippe Aghion and Steven N. Durlauf
Chintrakarn Pandej, Millimet Daniel L., (2006). “The environmental consequences of trade: Evidence from subnational trade flows”. Journal of Environmental Economics and
Management, 52 : 430–453
Chow, P. C. Y., 1987. "Causality Between Export Growth and Industrial Development: Empirical Evidence from the NICs," Journal of Development Economics, 26, pp. 55-63.
Copeland Brian R., Taylor M. Scott, (2004). “North-South Trade and the Environment”. The
Copeland, B.R., (2005). “Policy endogeneity and the effects of trade on the environment”.
Agricultural and Resource Economics Review 34 (1), 1–15.
Copeland, B.R., Taylor, M.S., (2004). “Trade, growth, and the environment”. Journal of
Economic Literature 42 (1), 7–71.
Dasgupta Susmita, Meisner Craig, Wheeler David, Jin Yanhong, (2002). “Agricultural Trade, Development and Toxic Risk”. World Development, 30(8) : 1401–1412.
Dean Judith M., (2002). “Does Trade Liberalization Harm the Environment? A New Test”.
The Canadian Journal of Economics, 35(4): 819-842.
Drabo, Alassane, (2010a). “Environment quality and economic convergence: Extending Environmental Kuznets Curve hypothesis”. Economics Bulletin, 30(2): 1617-1632. Drabo, Alassane, (2010b). “Income inequality and health status: role of institutions quality”.
Economics Bulletin, 30(4) : 2533-2548.
Drabo, Alassane, (2011). Impact of Income Inequality on Health: Does Environment Quality Matter? Environment and Planning A, 43(1) 146 – 165.
Ecobichon, D.J. (2001). “Pesticide use in developing countries”. Toxicology, 160, 27–33 Feder, G., 1982. "On Exports and Economic Growth," Journal of Development Economics,
12, 1982, pp. 59- 73.
Frankel, Jeffrey, and David Romer, 1999. "Does Trade Cause Growth?" American Economic
Review 89, no. 3, June 1999, 379-399.
French, H. (1993). “Costly Trade Offs: Reconciling Trade and the Environment”. Worldwatch Paper 113, Worldwatch Institute, Washington DC.
Galt, R.E. (2008). “Pesticides in export and domestic agriculture: Reconsidering market orientation and pesticide use in Costa Rica”. Geoforum 39, 1378–1392
Gangadharan, L. and Valenzuela M. R., (2001). “Interrelationships between income, health and the environment : extending the environmental Kuznets Curve hypothesis”,
Ghatak, S., and Turner R.K., (1978). “Pesticide use in less developed countries. Economic and environmental considerations”, food policy, May, 136-146
Grossman, G. and Krueger A.B., (1995). “Pollution Growth and the environment”, Quaterly
Journal of Economics, 110, 353-377
Grossman, Gene M. and Krueger, Alan B., (1993). "Environmental Impacts of a North American Free Trade Agreement," in Peter M. Garber, ed., The U.S.-Mexico free trade agreement. Cambridge, MA: MIT Press, 13- 56.
Gwatkin, Davidson R., Rutsein, Shea, Johnson, Kiersten, Suliman, Eldwan, Wagstaff, Adam and Agbessi Amouzou. (2007). “Socio-Economic Differences in Health, Nutrition, and Population Within Developing Countries, An Overview”. Produced by the World Bank in collaboration with the Government of the Netherlands and Swedish International Development Cooperation Agency, Washington DC.
Hanmer, L., Lensink, R., & White, H., (2003), “Infant and Child Mortality in developing countries: Analysing the data for Robust Determinants”. The Journal of Development
Studies, vol. 40, N°1.
Hecht Joy E., (1997). “Impacts of Tariff Escalation on the Environment: Literature Review and Synthesis.” World Development, 25(10) : 1701-1716
Jaffe, Adam B.; Peterson, Steven R.; Portney, Paul R. and Stavins, Robert N., (1995). "Environmental Regulation and the Competitiveness of U.S. Manufacturing: What Does the Evidence Tell Us?" Journal of Economic Literature, 33(1), 132-63.
Jorgenson, Andrew K., (2007). “Foreign direct investment and pesticide use intensity in less-developed countries: a quantitative investigation”. Society and Natural Resources, 20 (1), 73–83.
Kellenberg Derek K., (2008). “A reexamination of the role of income for the trade and environment debate”. Ecological Economics, 6 8 : 106–115
Kellenberg Derek K., (2009). “An empirical investigation of the pollution haven effect with strategic environment and trade policy”. Journal of International Economics, 78 : 242–255