HAL Id: hal-00973076
https://hal-sciencespo.archives-ouvertes.fr/hal-00973076
Preprint submitted on 3 Apr 2014
HAL is a multi-disciplinary open access archive for the deposit and dissemination of sci-entific research documents, whether they are pub-lished or not. The documents may come from teaching and research institutions in France or abroad, or from public or private research centers.
L’archive ouverte pluridisciplinaire HAL, est destinée au dépôt et à la diffusion de documents scientifiques de niveau recherche, publiés ou non, émanant des établissements d’enseignement et de recherche français ou étrangers, des laboratoires publics ou privés.
Are Export Premia Robust to Innovation Statistics?
Flora Bellone, Sarah Guillou, Lionel Nesta
To cite this version:
Flora Bellone, Sarah Guillou, Lionel Nesta. Are Export Premia Robust to Innovation Statistics?. 2009. �hal-00973076�
Are Export Premia Robust to Innovation Statistics?
Flora Bellone∗ Sarah Guillou † Lionel Nesta‡This version: March 2009
Abstract
This paper analyses in what extent innovation contributes to the productivity pre-mium of exporters. We start by performing non parametric tests on TFP distributions on different groups of firms characterized by their export and innovation behavior. We show that the TFP distributions of exporters and innovators stochastically dominate those of non exporters and of non innovators, respectively. We pursue with OLS re-gressions and show that the export premium, defined as the productivity advantage of exporters over non-exporters, is robust to the introduction of innovation statistics. We conclude that export and innovation each have specific mechanisms in their relation-ship with productivity. The contribution of innovation abilities remains however small: once controlled for the firm size, its ownership, and its innovation abilities, the resid-ual export premium is still around 3%. Two additional results are found. First, both process and product innovations are associated with higher productivity when process innovation is strictly defined. Second, when accounting for distance to export mar-kets, the export premium remains significant for global exporters only, whereas that of intra-Europe exporters vanishes. From these findings, we conclude that, beyond inno-vative abilities and mere size advantage, specific export-related competencies, such as specific managerial competencies or specific human capital, takes an important part in the success of Global exporters.
Keywords: Export premium, Innovation, Firm-level data, Productivity JEL Classification: F1, F31, F32, F4
∗University of Nice - Sophia Antipolis, GREDEG UMR n◦6227. E-mail: Flora.Bellone@gredeg.cnrs.fr
†Corresponding author: Sciences-Po Paris - OFCE-DRIC, Observatoire Fran¸cais des Conjonctures
´
Economiques, D´epartement de Recherche sur l’Innovation et la Concurrence, 250 rue Albert Einstein, 06560 Valbonne, France. sarah.guillou@ofce.sciences-po.fr, Tel:+33 493954345
‡Observatoire Fran¸cais des Conjonctures Economiques, D´epartement de Recherche sur l’Innovation et
1
Introduction
Over the last twenty five years, the relationship between trade and innovation has been one of the most lively and debated issue within the frame of the new trade and the new growth theories. Several models, starting from Krugman (1980) and Grossman and Helpman (1991), have investigated the interdependence between export and innovation. Basically, exporters have to innovate to satisfy quality differentiation demanded by foreign consumers; innovators have to export to benefit from increasing returns associated to R&D activity. Hence innovation and export behaviors are strongly intertwined. The consensual conclusion let a wide research field aiming to disentangle the relationship between trade and innovation.
By considering firms heterogeneity, the ”new new trade theory” (Baldwin and Forslid, 2004, p1) may offer new insights. Empirical analyzes of the characteristics of exporters have clearly demonstrated the productive superiority of exporters over their non-exporting counterparts. This so-called export premium has been documented as existing before firms start to export. Hence it has been mainly interpreted as supporting the self-selection hypothesis according to which only the most productive firms should find rational to export as only them can cope with the additional trade costs associated with an export strategy. The existence of such a mechanism has been demonstrated in two different theoretical settings by Melitz (2003) and Bernard et al. (2003). However none of these models explain why, at the first place, some firms outperform others. How firms reach their ex ante productivity advantage is the concern of the most recent theoretical contribution in the field (see, among others, Emami Namini and Lopez (2006); Yeaple (2005); Costantini and Melitz (2008)). In these papers, technological inputs are the key variable that entails firms heterogeneity and specifically the differences in efficiency between exporters and non exporters.
From this new literature, a lot of new questions emerge about the relationship between export strategies and technological choices. Are firms that want to export compelled to innovate before? Are export and innovation decisions joined as a result of a mere growth strategy? Does export behavior influence the path of future innovation decisions? Is it only because they innovate that exporters are more productive? Our paper makes a first step in the direction of answering these questions by investigating to which extent the traditional measures of export premia are sensitive to the introduction of innovation statistics.
In our paper, export premia are computed from a multilateral firm-level total factor productivity (TFP)index. Similar to Cassiman and Golovko (2007), we compare the entire TFP distributions rather than the first two moments of the distribution for different groups of firms depending on their export and innovation behavior. Second, we perform OLS and
quantile regressions explaining productivity levels in terms of both export and innova-tion behavior. We distinguish between firms active in European markets (Intra-Europe exporters) from firms active outside Europe (global exporters).
Our main results are as follows.
First, we show that the export premium is robust to the introduction of innovation statistics. We conclude that export and innovation each have specific mechanisms in their relationship with productivity. The contribution of innovation abilities remains however small: once controlled for the firm size, its ownership, and its innovation abilities, the residual export premium is still around 3%. Moreover, two additional results are found. First, both process and product innovations are significant when process innovation is restricted to patenting firms. Second, we find a ”super” premium for global exporters: once accounting for distance to export markets, the export premium vanishes for intra-Europe exporters, whereas the premium remains highly significant for global exporters. This result supports the hypothesis of fixed entry costs into distant markets (outside Eu-rope). From these findings, we conclude that, beyond innovative abilities and mere size advantage, specific export-related competencies, such as specific managerial competencies or specific human capital, takes an important part in the success of Global exporters.
The rest of the paper is organized as follows. In Section 2, we briefly review some relevant theoretical and empirical literature. Section 3 presents the dataset which merge innovation data from the French Innovation Survey 2005 (CIS4) and financial statements from the Annual Firm Survey (EAE) for French manufacturing industry over 1990-2005. Section 4 displays basic summary statistics about exporters and innovators. Section 5 describes our empirical strategy and methods to measure the export premium conditional on the firm innovation strategy. Results are presented in Section 6.
2
Background literature
In the empirical literature on international trade and firm heterogeneity, the positive as-sociation between exports and firm productivity has been well-documented (see the large literature triggered by Bernard and Jensen (1995; 1999) and recently reviewed in Wag-ner (2007)). Moreover, it has been shown that the productivity superiority of exporters over their non-exporting counterparts was usually observed ex-ante, namely several years actually before the firm start exporting. The positive correlation between ex ante firm pro-ductivity and its propensity to export has found strong and clear theoretical foundations in the recent models of international trade with heterogeneous firms by Melitz (2003) and Bernard et al. (2003). In both models, this is the presence of specific exports costs which explain why only the most efficient firms find profitable to export. Less efficient firms find
rational to concentrate only on the domestic market, while the least productive firms may simply exit the market. This mechanism is known in the literature as self-selection into export markets.
Heterogeneity in firm productivity raises an important question about the sources of the exporting firm’s high productivity. How do firms obtain higher productivity that allows them to target export markets? The models of Melitz (2003) and Bernard et al. (2003) are both silent on this issue. Both theories assume that firms’ productivity heterogeneity is exogenously given as a firm’s initial productivity is determined by a random draw from a certain distribution function. None of them are causal theories between a firm decision to improve its productivity and its decision to export. More recent advances in the theory of international trade and firm structure as Yeaple (2005), Emami Namini and Lopez (2006), and Costantini and Melitz (2008), have started to investigate how firms make specific investments in order to improve both their productivity and export performance. Each of these models emphasizes the innovative choice along with the training of the workforce and investment in human capital as the main drivers of the productivity improvements which may cause exports .
On the empirical side, there is a long list of papers connecting innovation to firm ex-ports (Hirsh and Bijaoui, 1985; Wakelin, 1998; Starlachcini, 1999; Lefebvre and Lefebvre, 2001; Basile, 2001; Roper and Love, 2002; Lachenmaier and Wassmann, 2006). Moreover, some of those papers explicitly investigate the causality between innovation and exports. Most notably, Salomon and Shaver (2005) show that exporting is related to ex post in-crease in innovation using Spanish patent applications data.Harris and Li (2008) rather emphasize the reverse causality. Using UK firms, they show that (endogeneous) R&D spending significantly decreases the barriers to export. Despite its richness, in particular to highlight which dimensions of the innovation strategy (R&D spending, process or prod-uct innovation, patent, etc...) are the more closely related to a firm export performance, this literature still lacks from a convincing theory to explain the relationship between innovation and exports. Does innovation helps to export only through its impact on pro-ductivity? (This would be in line with the recent firm heterogeneity and international trade models cited above). Or has innovation a direct positive impact on the propensity to export as for instance in models where demand factors rather than supply ones drives the sales expansions of a firm (Vernon 1966 and more generally product life cycle theory as Klepper (1996)? Do different types of innovation impact differently the propensity to export? Along the product-life cycle theory we could conjecture that process innovations help to export only indirectly through the productivity channel while product innovation impact directly the propensity to export, i.e. opening new markets.
In order to shed more light on these issues, some recent papers have started to connect innovation to export and productivity (and not to export only). First, Bernard and
Jensen (2004) find evidence which can be interpreted as supporting the idea of a direct effect of product innovation on the propensity to export. For a large sample of U.S. plants, they show that the introduction of new products (change in primary SIC codes for manufacturing plants) significantly enhances the probability of exporting even once controlled for a host of variables including productivity which impact export decisions. Aw et al. (2007) using Taiwanese data jointly analyze a firm’s decisions to export and invest in R&D and-or training. They apply a bivariate probit framework that recognizes the interdependence of the exporting and R&D or training decisions. They find that exporting firms not investing in R&D or training have lower productivity growth rates than firms investing in R&D. They conclude that exporting firms need to produce effective R&D or training in order to generate efficiency gains. This evidence is used to argue that exports and R&D are important and complementary source of productivity growth, with R&D activity facilitating the benefits from export markets .
Cassiman and Golovko (2007) use a panel of Small and Medium (SME) Spanish manu-facturing firms for the period 1990-1998. They measure by non parametric tests the TFP premium of exporters over non exporters among different subsamples of firms classified according to their innovation strategy. In their methodology, the innovation variables are lagged by one year relatively to the productivity and export variables, the conjecture being that innovation are likely to impact productivity and export with a lag. Their main result is that an export premium (in terms of TFP) exists only within the sample of (small) non innovating and only process innovating firms: for the sample of (small) product innovat-ing firms, exporters do not exhibit on average higher TFP than non exporters. From this finding, they tentatively conclude that product innovation is a main driver of exports at the firm level as, their argument goes, once accounted for product innovation, productivity is no more related to the export status. In Cassiman and Golovko (2008), the authors in-vestigate further the role of product innovation as a key driver of the firm export decision. They show that product innovation significantly impacts the decision to start exporting even once controlled by TFP and a host of other variables which might impact the export decision (age, size,...).1
In this paper we follow Cassiman and Golovko (2007) methodology with three notable amendments. First, we work on both SME and large and very large firms. This advantage of our dataset allows us to investigate to which extent the results reached by Cassiman and Golovko are biased by the firm size. Second, we distinguish between European and non-European markets noting that the former are more easily accessible than the later. In
1
Becker and Egger (2007) reach a similar conclusion even after controlling for the endogeneity of in-novation decisions. Specifically, they apply matching for multiple binary treatments to account for the self-selection of firms into process and/or product innovations. However, Becker and Egger (2007) do not use TFP as a control variable.
consequence, French firms exporting only to European markets (intra-Europe Exporters) should be characterized by lower export premia than French firms exporting also on non-European markets (Global Exporters) . Moreover, we investigate by which channel a firm innovation strategy impacts the firm ability to export. Is it only through its impact on the firm productivity or does innovation has a direct impact on the ability to export, especially on non European markets? Finally, we investigate if a correlation exists between the type of innovations a firm is undertaking (Process or Product) and its export strategy (intra-Europe or Global).
3
Data
3.1 Data sources
We use data from two main sources. The first one is the Enquˆete Annuelle d’Entreprises (EAE), a survey conducted by the French Ministry of Industry which gathers information from the financial statements and balance sheets of all individual manufacturing firms with at least 20 employees. In the EAE survey, the surveyed unit is the legal (not the productive) unit, which means that we are dealing with firm (not plant)-level data . 2
Our unbalanced EAE sample covers around 23000 firms over the 1990-2005 period which accounts for 25% of the total number of French Manufacturing firms but no less than 85% of total value added in Manufacturing. The second source is the French Innovation Survey 2005 as part of the fourth iteration of the wider Community Innovation Survey-CIS4-covering EU countries. This survey refers to the period 2002-2004. It samples over 20 000 French firms with 10 or more employees, and had a wide sectoral coverage including both Manufacturing and service sectors.
Merging the EAE and the CIS4 datasets yields a dataset of 5131 firms for which we have both information on their inputs and outputs including exports (from 1990 to 2005) and on their innovation activities over the 2002-2004 period. As a first step, we choose to restrict our attention to the 4266 active firms in 2005. We relate the 2005 firm performance measured through a Total Factor Productivity (TFP) index and the 2005 firm exports to the innovation activities undertaken by the firm from 2002 to 2004. Our implicit assumption is that innovation is unlikely to drive a firm performance in the same year.3
Compared to the EAE dataset, the merged EAE-CIS sample is biased in favor of large firms: the average firm size in the CIS-EAE merged dataset is twice as large as the average
2
To investigate the relationship between firm performance and strategic decisions such as to innovate and/or to export, firm level data seem more appropriate as the firm rather than the plant is the place where strategic decisions are taken.
3
All the results presented in this paper are robust to using 2004 instead of 2005 to measure firm exports and productivity. In further works, we plan to exploit more fully the panel dimension of our dataset.
firm size in the EAE dataset; Moreover in the CIS-EAE dataset only 30% of firms have less than 50 employees (against 51% in the EAE) while another 30% of firms have more than 250 employees (against 10% in the EAE dataset). As the propensity to export is higher for larger firms , we can expect a positive bias of the CIS-EAE merged dataset in favor of exporting firms.4
3.2 Relevant variables
In this paper, as in most of the previous literature on CIS 5
, we use an output-based definition of innovators and non-innovators, based on the characterisation of innovation as the market introduction of a new product or the implementation of a new process (see also D’Este et al., 2008, using UK CIS4). This definition is the result of an international consensual work on innovation statistics clarified in the Oslo Manual (OECD, 2005). In accordance with this definition, a firm is an innovator if, during the period 2002-2004, it introduced a new or significantly improved product (or service) and/or any new or significantly improved processes for producing or supplying products.
We also use the types of innovation to further discriminate across innovators. We first distinguish product from process innovations as we conjecture that product innovation could have a specific impact on the decision to export which does not pass through a cost advantage. On the other hand, process innovations should impact a firm export performance mainly through their impact on the relative productivity of the firm. Second, we further discriminate among product innovations as we distinguish innovations which are new to the market (Market product innovations) from innovations which are new to the firm only (Firm product innovations). Here again, we are interested in knowing if product innovations which are new to the market have a stronger impact on a firm export performance than product innovations which are new to the firm only.
We then use three dummies as markers for different types of innovators: 1)Process innovators include all the firms which state in CIS4 that they innovate in processes during the period of reference (2002-2004). 2)Firm Product innovators include all the firms which state in CIS4 that they innovate in product new to the firm during the period of reference 3) Market Product innovators include all the firms which state in CIS4 that innovate in product new to the market during the period of reference We purposely allow these 3 categories of innovators to be non-exclusive, i.e. a same firm which simultaneously states that it performed Process and Market product innovations during the period of reference will belong to both type 1 and type 3 innovators.
A commonly stressed limit of the CIS4 survey is that the ”innovator” type of a firm
4
Bellone et al. (2006) show evidence on the relationship between firm size and export propensity for French Manufacturing firms.
5
is based on the firm self-assessment which can lead to an overestimation of innovative behaviors. Indeed, it is likely that some managers will overestimate their innovative ”atti-tude”. For instance, it has been stressed in the literature that some firms declare to have processes innovation while they simply buy a new machine. Obviously, this type of firms is not ”true” innovator. By including those firms in the group of innovators could then strongly biased the estimates of innovation and export premia.
In order to overcome this potential bias, we systematically check the robustness of our results to the restriction of our innovators to patenting firms only. We indeed consider that to get a patent a firm must confront some objective statement (from the patent office) rather than simply self-assessing that it innovates. Of course, in doing so, we are likely to suffer from the opposite bias, i.e we are likely to under-estimate the number of true innovators.6
That is the reason why, we keep both definitions (i.e. the one based on self-assessment and the one based on patenting activity) in the present study.
4
Summary Statistics
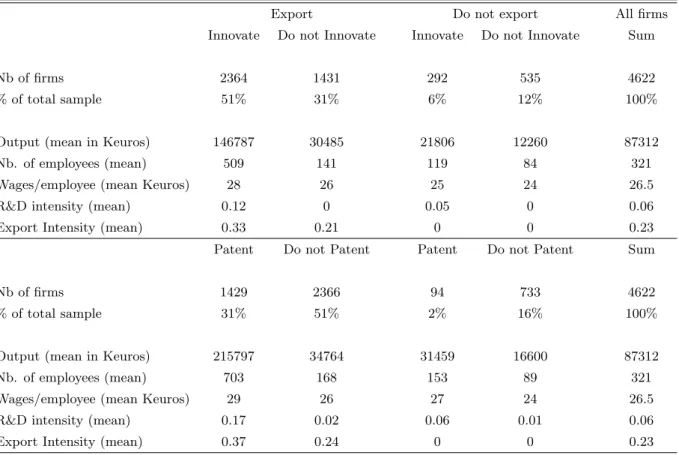
We start by presenting the distribution of exporters/non exporters and innovators/non innovators in the EAE-CIS merged dataset. For each sub-sample, Table 1 shows the average main characteristics in terms of variables of interest: sales, employment, export intensity, R&D intensity.
Table 1 shows a clear ranking across the four categories of firms. The sub-sample of Exporting Innovators displays on average the most favourable characteristics. Second is the sub-sample of Non-innovating Exporters. Non exporting innovators come only in third position while the non-exporting non-innovating firms represent the sub-sample of firms with the less favourable characteristics. This ranking suggests that both innovation and export are key factors of business performance. Moreover, a hierarchy seems to exist between both factors. In 2005, exports have been even more important to business performance than innovations.
Nonetheless, the main stylized fact which emerges from Table 1 is that innovation and export are complements rather than substitutes as factors of firm performance. On the one hand, within the group of Exporters, the firms which are most involved in export activity are the innovators: their export intensity is 33% (against 21% for the non innovators). On the other hand, within the group of Innovators, the firms which are most involved in innovation activity are the exporters: their R&D intensity is 12% (against 5% for the non-exporters).
Finally, Table 1 shows that all these findings are robust to changing the definition of
6
Patent statistics are also not an enough measure to grasp innovators but is a good control of an innovation activity (see (Griliches, 1990).
Table 1: Summary Statistics on Exporters, Innovators, and Patenting Firms
Export Do not export All firms
Innovate Do not Innovate Innovate Do not Innovate Sum
Nb of firms 2364 1431 292 535 4622
% of total sample 51% 31% 6% 12% 100%
Output (mean in Keuros) 146787 30485 21806 12260 87312
Nb. of employees (mean) 509 141 119 84 321
Wages/employee (mean Keuros) 28 26 25 24 26.5
R&D intensity (mean) 0.12 0 0.05 0 0.06
Export Intensity (mean) 0.33 0.21 0 0 0.23
Patent Do not Patent Patent Do not Patent Sum
Nb of firms 1429 2366 94 733 4622
% of total sample 31% 51% 2% 16% 100%
Output (mean in Keuros) 215797 34764 31459 16600 87312
Nb. of employees (mean) 703 168 153 89 321
Wages/employee (mean Keuros) 29 26 27 24 26.5
R&D intensity (mean) 0.17 0.02 0.06 0.01 0.06
Export Intensity (mean) 0.37 0.24 0 0 0.23
A firm is classified as an ”Exporter” according to its 2005 exports.
A firm is classified as an ”Innovator” or as a ”patenting firm” according to its innovation activities between 2002-2004.
innovators/non innovators towards patenting/non patenting firms. Two further noticeable features about patenting firms are as follows. First, as expected, the number of patenting firms is far below the number of (self-assessed) innovative firms. Second, the average patenting firm is larger and more oriented towards export markets than the average (self-assessed) innovative firm.
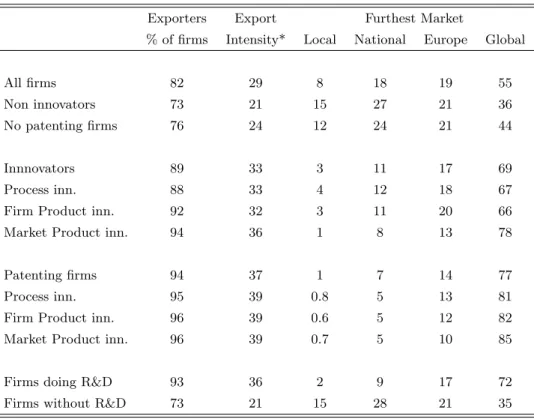
To investigate further the relationship between a firm’s export and innovation strate-gies, we discriminate in Table 2 firms according to the localization of their furthest cus-tomers (local, national, European, Non-European) and use this information to distinguish two types of exporters: intra-Europe exporters and Global exporters.7
We also
discrimi-7
As Table 2 shows, there is not a perfect overlapping between the number of firms which reports in the EAE survey positive values of exports and the number of firms which state in CIS4 that they sell to foreign markets (either European or non-European ones). Actually, the number of exporters is underestimated in CIS4 compared to EAE. This mismatch can have at least two sources: 1) misleading self-assessments by firms in CIS4; 2) a frontier effect: some firms operating close to a frontier can state in CIS4 that their relevant market is local while they are exporting to the next country and consequently have positive value
nate innovators not only according to different definition of innovative activity (Do Patent or Not, Do spend on R&D or not...) but also, within innovators, according to the type of innovations they undertake (Process, Firm product or Market Product). Table 2 below shows how the different types of exporters relate to the different types of innovators.
Table 2: Export strategies conditional on Innovation (Figures in %)
Exporters Export Furthest Market
% of firms Intensity* Local National Europe Global
All firms 82 29 8 18 19 55
Non innovators 73 21 15 27 21 36
No patenting firms 76 24 12 24 21 44
Innnovators 89 33 3 11 17 69
Process inn. 88 33 4 12 18 67
Firm Product inn. 92 32 3 11 20 66
Market Product inn. 94 36 1 8 13 78
Patenting firms 94 37 1 7 14 77
Process inn. 95 39 0.8 5 13 81
Firm Product inn. 96 39 0.6 5 12 82
Market Product inn. 96 39 0.7 5 10 85
Firms doing R&D 93 36 2 9 17 72
Firms without R&D 73 21 15 28 21 35
*Export on sales (average of exporting firms)
5
Empirical Strategy and Methods
Our empirical strategy follows Cassiman and Golovko (2007). We start by reproducing the results existing in the literature and identify the positive association between productivity and export status in our sample. Next, we compare the productivity levels of innovating versus non-innovating firms in order to show that innovation activity adds to firm pro-ductivity. Finally, we check whether the differences in the productivity of exporters and non-exporters persist when firm innovation status is accounted for. In other words, we wonder if the export premium is robust to the introduction of innovation statistics. of exports reported in the EAE survey.
5.1 Productivity Measure
In what follows, we compute Total Factor Productivity using the so-called Multilateral Productivity Index first introduced by Caves et al. (1982) and extended by Good et al. (1997). This methodology consists of computing the TFP index for firm at time as follows:
ln T F Pit = ln Yit+ t P τ =2 ¡ln Yτ− ln Yτ−1¢ − N P n=1 1 2 (Snit+ Snt) (ln Xnit− ln Xnt) − t P τ =2 N P n=1 1 2 (Snτ + Snτ−1) (ln Xnτ − ln Xnτ−1)
where Y denotes the real gross output using the set of N inputs X, where input X is alternatively capital stocks (K), labor in terms of hours worked (L) and intermediate inputs (M ). Variable S is the cost share of input X in the total cost (see Appendix A for a full description of the variables). Subscripts t and n are indices for time and inputs, respectively, and upper bars denote sample means. This index makes the comparison between any two firm-year observations possible because each firm’s inputs and outputs are calculated as deviations from a reference firm. The reference firm is a hypothetical firm that varies across industries with outputs and inputs computed as the geometric means of outputs and inputs over all observations and input cost-based shares computed as an arithmetic mean of cost shares over all observations.8
This non parametric measure of relative productivity has been popularized in the export-productivity literature by the contributions of Aw, Chung and Roberts (2000) and Aw, Chen and Roberts (2001). Bellone et al (2008) have used these measures to investigate the export-productivity relationship for French Manufacturing firms.
5.2 Methods for comparing firm productivity levels
Following Delgado et al (2002), we compare the productivity distributions of two different samples of firms by using the non parametric test of Kolmogorov-Smirnov. This test is based on the concept of first order stochastic dominance. Considering two probability distributions, f and g, characterised by cumulative distribution functions F and G, dis-tribution f is said to dominate disdis-tribution g stochastically at first order if, for all z in the union of the supports of the two distributions F (z) − G(z) 6= 0 with strict inequality for some z. Let Z1, ..., Zn, be a random sample of size n, which corresponds to a group
of, firms, from the distribution function F , and let Zn+ 1, ..., Zn+ m, denote a random
sample of size m, independent of the first one, which corresponds to a different group of
8
Firms are allocated to one of the following 14 two-digit industries: Clothing and footwear; Printing and Publishing; Pharmaceuticals; House equipment and furnishings; Automobile; Transportation Machinery; Machinery and Mechanical equipment; Electrical and electronic equipment; Mineral industry; Textile; Wood and paper; Chemicals; Metallurgy, Iron and Steel; Electric and Electronic components.
firms, from the distribution function G; where Zi represents either the productivity level
(or the productivity growth) of firm i. The testing procedure requires performing the two following tests:
1. Two-sided test : H0 : F (z) − G(z) = 0 for all vs.HA : F (z) − G(z) 6= 0 for some can be rejected.
2. One-sided test : H0 : F (z) − G(z) 6= 0 for all vs. HA : F (z) − G(z) > 0 for some cannot be rejected.
To give a more intuitive explanation let us suppose that F and G represent the pro-ductivity distributions for exporters and non-exporters respectively. On one hand, the two-sided test allows us to determine whether both distributions are identical or not. On the other hand, the one-sided test permits us to determine whether or not a distribution dominates the other. Particularly, when the two sided test is rejected and the one-sided test cannot be rejected, it indicates that F is to the right of G. In other words, it implies that exporters’ productivity distribution stochastically dominates non-exporters’ produc-tivity distribution.
6
Results
We start with a graphical description of the TFP distributions of exporting versus non exporting firms for the 2005 year. Next, we present simple comparisons of the means and the variances of the TFP levels distributions of exporters and non exporters. Finally we present the results of the Kolmogorov-Smirnov tests. We repeat the same tests to compare the productivity levels on innovators and non innovators. Then, we compare the exporting and non exporting groups accounting for firm’s innovation strategy using the same battery of test. Finally, we run OLS and quantile regressions of productivity levels on export variables and several controls in order to investigate differences in the TFP levels of exporters and non exporters in more details.
6.1 Graphical description
Following Figures represent the cumulative distribution functions of TFP of different groups of firms. Figures 1 and 2 present the results for different groups of exporters/non exporters and innovators/non innovators.
As expected, the distribution of performers (exporters or innovators) lies to the right of the distribution of non-performers, which suggests first-order stochastic dominance.
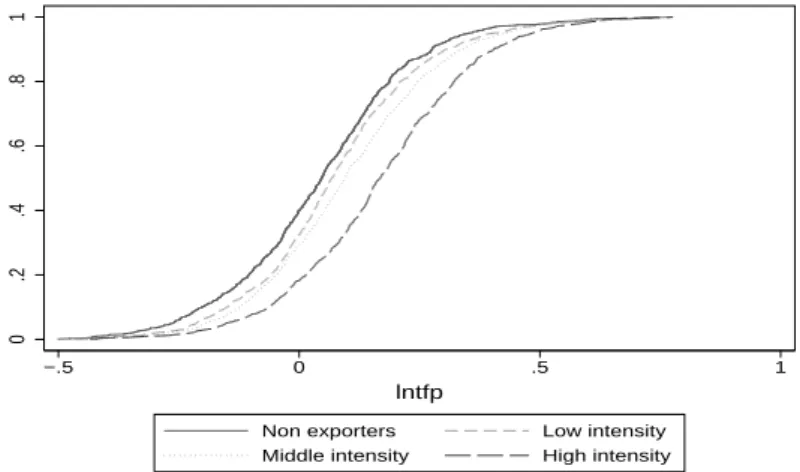
Figures 3 and 4 respectively discriminate firms according to their relative commitment into export or innovation strategies respectively. Figures 3 and 4 show that the advantage
Figure 1: TFP distribution of exporters and non exporters 0 .2 .4 .6 .8 1 −.5 0 .5 1 lntfp
Exporters Non Exporters
Figure 2: TFP distribution of innovators and non innovators
0 .2 .4 .6 .8 1 −.5 0 .5 1 lntfp
Innovators Non innovators
of Exporters (respectively Innovators) appears larger for firms intensively committed into their export strategy (respectively innovation strategy).
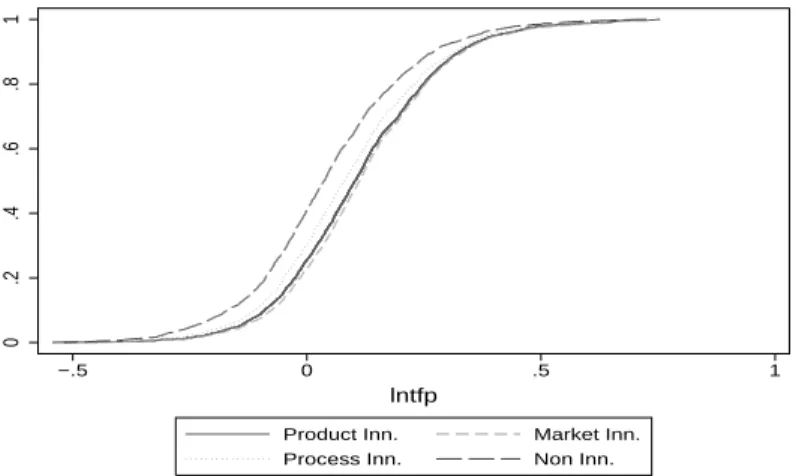
Finally, Figures 5 and 6 discriminate firms respectively according to their furthest customer and according to their innovation strategies (Process, Firm product and Market product Innovators). Two interesting features emerge. First, when exporting firms are ranking according to their furthest relevant market, only the firms selling globally (outside Europe) appears to out-perform non exporters (i.e. firms selling locally or nationally). The cumulative TFP distribution of firms exporting only to Europe is not distinguishable from the one of firms selling nationally. Second, when the type of innovation is accounted for, firms doing product innovations which are new to the market seem to be the best
Figure 3: TFP distribution of firms conditional on export intensity level 0 .2 .4 .6 .8 1 −.5 0 .5 1 lntfp
Non exporters Low intensity Middle intensity High intensity
Figure 4: TFP distribution of firms conditional on R&D intensity level
0 .2 .4 .6 .8 1 −.5 0 .5 1 lntfp
No R&D Low intensity Middle intensity High intensity
performing innovators9
.
6.2 Distribution comparisons
Tables 3 and 4 list the results for tests on differences in means and in variances and for the Kolmogorov-Smirnov tests for different groups of firms. In these tables, first column indicates the reference population from which two subsamples will be extracted. Second column identifies the two subsamples of firms (namely Group A and Group B) that will
9
Actually, we found in unreported results that the TFP distribution of firms which undertake only process innovation is not distinguishable from the one of non-innovators. This result comforts the idea that those firms are more likely technology adopters (i.e. buyers of new advanced machines) rather that true innovators.
Figure 5: TFP distribution of firms conditional on furthest customers 0 .2 .4 .6 .8 1 −.5 0 .5 1 lntfp Global Europe National Local
Figure 6: TFP distribution of firms conditional on types of innovation
0 .2 .4 .6 .8 1 −.5 0 .5 1 lntfp
Product Inn. Market Inn. Process Inn. Non Inn.
be compared. All the results are robust to a change of the current year (2004 instead of 2005) .
Both the difference in means test and the Kolmogorov-Smirnov test in Tables 3 confirm the graphical intuitions:
1. Exporters (respectively Innovators) outperformed non Exporter (respectively non-Innovators)
2. Global Exporters have higher productivity than intra Europe Exporters ( 10% higher on average) while the TFP distribution of intra-Europe Exporters is not significantly different from the one of non-exporters.
cor-Table 3: Difference in 2005 TFP Level Distributions between different groups of firms (Full sample) Group A/Group B Number of firms Diff in means M eanA < M eanBa K-S test K-S test for
(A-B) f orequalityb
F(A)dominatesG(B)c
Group A Group B t-stat P-value D P-value D P-value Export strategies Exporters/Non exporters 3795 827 0.077 8.96 0 0.151 0 -0.004 0.975 Europe/National 856 850 0.006 0.549 0.292 0.043 0.382 0.0418 0.226 Global/Europe 2525 856 0.1 12.245 0 0.262 0 -0.0012 0.99 Innovation strategies Innovators/Non innovators 2656 1966 0.077 11.743 0 0.168 0 -0.0007 0.99 Patenting /Non patenting Firms 1523 3099 0.115 16.91 0 0.255 0 -0.0017 0.99 Process Innovators/Non innovators 2107 1966 0.053 8.009 0 0.154 0 -0.006 0.99 Firm Product Innovators/Non innovators 587 1966 0.069 6.824 0 0.149 0 -0.001 0.99 Market Product Innovators/Non innovators 1433 1966 0.106 13.67 0 0.248 0 -0.0018 0.99 Market Innov& Patent/Non innovators 909 1966 0.143 15.96 0 0.338 0 -0.0023 0.99 a: H0 is the hypothesis that the difference in means is negative.
b: H0is the hypothesis that sup |F (z) − G(z)| = 0, where F is the distribution of group A and G is the distribution of group B; D is the largest difference
in absolute value between F and G
c: H0 is the hypothesis that sup{F (z) − G(z)} = 0,D is the largest difference between F and G.
Table 4: Difference in 2005 TFP Level Distributions between different groups of firms (Subsamples of Innovators)
Sample Group A/Group B Number of firms Diff in means H0 : Mean A¡ Mean Ba K-S testb K-S test for (A-B) f orequalityb F(A)dominatesG(B)c
Group A Group B t-stat P-value D P-value D P-value Export strategies conditional on innovation strategies
Innovators Exporters/Non Export. 2364 292 0.085 6.213 0 0.21 0 -0.0168 0.863 Patenting Firms Exporters/Non Export. 1429 94 0.063 2.552 0.0054 0.2304 0 -0.0396 0.758 Process Innovators Exporters/Non Export. 1850 257 0.087 6.2199 0 0.211 0 -0.0158 0.894 Firm Product Innovators Exporters/Non Export. 522 65 0.099 3.916 0 0.263 0 -0.0233 0.855 Market Product Innovatiors Exporters/Non Export. 1341 92 0.067 2.742 0.003 0.23 0 -0.0345 0.814 SuperStars (Market Innov + Patent) Exporters/Non Export. 870 39 0.027 0.717 0.473 0.231 0.024 -0.0834 0.595
Innovators Global/Europe 1816 449 0.092 8.447 0 0.256 0 -0.0028 0.995 Patenting Firms Global/Europe 1171 219 0.096 6.28 0 0.296 0 -0.0043 0.993 Process Innovators Global/Europe 1409 371 0.09 7.43 0 0.262 0 -0.0035 0.993 Firm Prod. Innovat. Global/Europe 389 118 0.085 4.283 0 0.238 0 -0.0027 0.997 Market Prod. Innovat. Global/Europe 1117 177 0.087 0 0.09 0.234 0 -0.0054 0.991 Market Innov & Patent Global/Europe 768 89 0.066 2.945 0.353 0.2545 0 -0.0117 0.978 a: H0 is the hypothesis that the difference in means is negative.
b: H0is the hypothesis that sup |F (z) − G(z)| = 0, where F is the distribution of group A and G is the distribution of group B; D is the largest difference
in absolute value between F and G
c: H0 is the hypothesis that sup{F (z) − G(z)} = 0,D is the largest difference between F and G.
responds to the groups of firms which patent on product innovations new to the market. On average, those firms outperform their non-innovating counterparts by 14.3 %.10
6.3 Export premia
We start by replicating Cassiman and Golovko (2007) in measuring Export Premia by regressing TFP levels on the export dummy, using both OLS method and quantile regres-sions. In all regressions, we control for industry by adding 2-digit industry dummies and for the affiliation of the firm to a group by adding a group dummy equal to 1 if the firms belongs to a group (either national or foreign owned) and 0 otherwise11
.
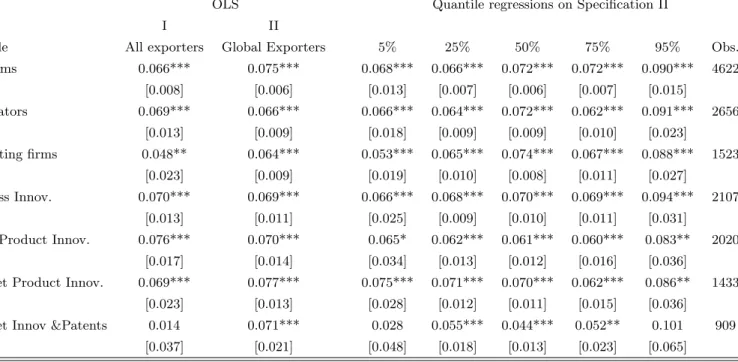
Table 5 presents the results of these regressions for the whole sample of firms and for different sub-samples of innovators.
These results simply state differently the existence of strong export premia. As ex-pected, their magnitude is very similar to what was initially revealed by the mean difference test and KS tests in Table 3b. Interestingly, in juxtaposing the Export premium for all Exporters and for Global exporters only, Table 4 allows to comfort the finding, that once accounted for the export destination, the advantage of Global exporters is strong (around 7%), and stable across the different sub-samples of non innovators and innovators. For the sub-sample of superstars innovators, this premium is 7.7% which is even larger than what were founded in table 3b (i.e. 6,6% on average). 12
We also comfort our previous finding according to which the lack of statistically significant export premium for all exporters within the group of superstars is simply due to the fact that the number of observations for the control group is too small (only 39 firms over 909). Compared to the previous literature, we found that our estimates of export premium are quite higher than those of Cassiman and Golovko (2007). There are also more stable along the different points of the conditional distribution of productivity level as shown by quantile regressions. For each group of firms, the export premia for Global Exporters are very stable over the different quintiles although they tend to be systematically higher for the highest quintiles. 13
They range between 8.3% and 10.1% for the highest quintiles of each group of innovators. Interestingly, the highest premium is found within the most productive superstars innovators.
All in all, the main difference between our results in 5 and the previous literature (i.e. (Cassiman and Golovko, 2007)) is that an export premium remains for each group of
10
Firms belonging to the same 2-digit sector.
11
Cassiman and Golovko (2007) include control variables as foreign capital ownership, high-tech sector and year dummies. Whereas these authors use 8 years (1991-1998), we instead consider only the year 2005.
12
The difference between the values reported in table 4 and the mean values reported in Table 4 comes from the fact that we included a group dummy in table 5.
13
Table 5: The TFP Premium of Exporters, different samples of firms
OLS Quantile regressions on Specification II
I II
Sample All exporters Global Exporters 5% 25% 50% 75% 95% Obs. All firms 0.066*** 0.075*** 0.068*** 0.066*** 0.072*** 0.072*** 0.090*** 4622 [0.008] [0.006] [0.013] [0.007] [0.006] [0.007] [0.015] Innovators 0.069*** 0.066*** 0.066*** 0.064*** 0.072*** 0.062*** 0.091*** 2656 [0.013] [0.009] [0.018] [0.009] [0.009] [0.010] [0.023] Patenting firms 0.048** 0.064*** 0.053*** 0.065*** 0.074*** 0.067*** 0.088*** 1523 [0.023] [0.009] [0.019] [0.010] [0.008] [0.011] [0.027] Process Innov. 0.070*** 0.069*** 0.066*** 0.068*** 0.070*** 0.069*** 0.094*** 2107 [0.013] [0.011] [0.025] [0.009] [0.010] [0.011] [0.031]
Firm Product Innov. 0.076*** 0.070*** 0.065* 0.062*** 0.061*** 0.060*** 0.083** 2020 [0.017] [0.014] [0.034] [0.013] [0.012] [0.016] [0.036]
Market Product Innov. 0.069*** 0.077*** 0.075*** 0.071*** 0.070*** 0.062*** 0.086** 1433 [0.023] [0.013] [0.028] [0.012] [0.011] [0.015] [0.036]
Market Innov &Patents 0.014 0.071*** 0.028 0.055*** 0.044*** 0.052** 0.101 909 [0.037] [0.021] [0.048] [0.018] [0.013] [0.023] [0.065] Standard errors in brackets
* significant at 10%; ** significant at 5%; *** significant at 1% All regressions include 2-digit industry dummies and a group dummy.
innovators including the sub-sample of Market Product Innovators. We can think of two possible explanations for this discrepancy. First, a methodological difference: Cassiman and Golovko (2007) are working on a sample of small and medium size Spanish firms (i.e. only firms with less than 200 employees) while we are working on a sample which includes both small and large firms. Second, differences in exports strategies between Spanish and French firms: Spanish exporting firms (especially SME ones) could be more intensively dedicated towards European markets compared to French exporting ones. If among innovating firms, a premium exists only for Global exporters, than the supposed higher proportion of Spanish innovating firms selling on European market only could explain why the TFP premium vanish in the Spanish case and not in the French ones.
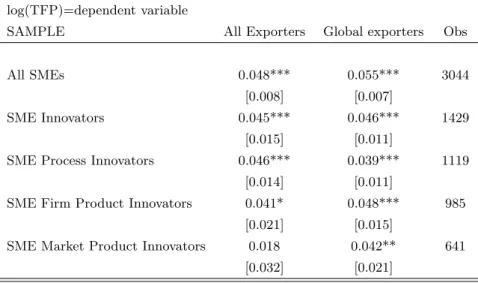
In order to check if a size bias affects the results by Cassiman and Golovko (2007), we repeat some of our regressions on a truncated sample where large firms (more than 200 employees) have been dropped.
Table 6: TFP premium of exporters for different samples of SMEs* log(TFP)=dependent variable
SAMPLE All Exporters Global exporters Obs
All SMEs 0.048*** 0.055*** 3044
[0.008] [0.007]
SME Innovators 0.045*** 0.046*** 1429
[0.015] [0.011]
SME Process Innovators 0.046*** 0.039*** 1119
[0.014] [0.011]
SME Firm Product Innovators 0.041* 0.048*** 985
[0.021] [0.015]
SME Market Product Innovators 0.018 0.042** 641
[0.032] [0.021]
*SMEs are defined as firms <200 employees All regressions include 2-digit industry dummies.
Table 6 confirms the presence of a size bias: When our own sample is restricted to the SMEs only, the premium in favour of exporters vanishes for the sub sample of Market Product innovators as in CG(2007). On the other hand, the TFP premium of Global ex-porters remains positive and significant for the group of SME’s Market product innovators. Finally note that on average the magnitudes of the export premia for SME’s are reduced by half compared to the ones reported for the whole sample of firms in Table 4. This reveals that export premia partly encompass the fact that larger firms are simultaneously more productive and more likely to export than smaller firms.
In summary, our results so far suggest that while innovation variables are of paramount importance to explain a firm performance, they do not explain all the variance of produc-tivity. Indeed, a firm export strategy is (positively) linked to its productivity even once accounted for the firm innovation activities.
6.4 Univariate and Multivariate Regressions of TFP levels
To pursue the investigation on the relative importance of innovation and export strategies in characterizing a firm performance, we next regress the firm TFP levels on different innovation and export variables.
We start by univariate regressions. Table 7 displays OLS and quantile results for 4 explicative variables, each introduced separately. As expected, innovative activities are significantly correlated with a firm productivity. This result is clearly in accordance with the literature about R&D-Productivity link. Among the different innovation variables, the patent dummy is the one which is the more strongly related to a firm TFP (the coefficients are respectively 0.085 and 0.09 for patenting firms and for Superstars innovators, i.e. firms which patent and innovate in product new to the market) . Such a high positive coefficient (0.09) is also associated to an export variable. It is the coefficient linked to the ”Global strategy” variable indicating whether or not a firm is exporting towards non-European markets. This result suggests that the export strategy of a firm could be at least as important as its innovation strategy in driving its economic performance.
Finally, we choose to go one step further in running multivariate regressions of the TFP levels. We run 12 different specifications in order to investigate to which extent Export premia are robust to the introduction of explanatory variables including innovation strate-gies and other firm-level characteristics as the group dummy and the firm size (measured in terms of the number of hours worked). Specification I to IX simply decompose the row Export premium into the three components of the export status: the one linked to the mere Export status, the one linked to the market destination (Global or not) and the one linked to the export intensity. At each time we introduce a new variable of the export status, we introduce innovation dummy to test the robustness of the export premium.
Specifications X to XII include each variables of the export status and each variable of innovation. Specification XII is a robustness check in which we retain a more strict definition of innovators in considering only patenting firms. OLS regressions results are presented in Table 8. Quantile regressions (only for specification XI) are presented in Appendix A.
Our main results can be summarized as follows.
1. The export premium is robust to the introduction of innovation statistics. A firm relative TFP is positively correlated to its innovation strategy and to its export
Table 7: TFP levels as a function of different X variables (Univariate regressions)
X variable OLS Quantile regressions
5% 25% 50% 75% 95%
Innovate 0.053*** 0.053*** 0.051*** 0.043*** 0.047*** 0.060***
[0.006] [0.013] [0.006] [0.006] [0.007] [0.015]
Innovate in Process only -0.014 -0.008 -0.015* -0.020** -0.025** 0.001
[0.009] [0.016] [0.009] [0.008] [0.010] [0.023]
Innovate in Process 0.028*** 0.032*** 0.037*** 0.028*** 0.033*** 0.042***
[0.006] [0.013] [0.006] [0.006] [0.007] [0.015]
Innovate in Product 0.062*** 0.061*** 0.060*** 0.054*** 0.060*** 0.063***
new to the firm [0.006] [0.013] [0.007] [0.006] [0.008] [0.016]
Innovate in Product 0.065*** 0.063*** 0.065*** 0.062*** 0.063*** 0.089***
new to the market [0.007] [0.013] [0.006] [0.006] [0.007] [0.014]
Patent 0.085*** 0.073*** 0.073*** 0.072*** 0.081*** 0.125***
[0.007] [0.014] [0.006] [0.007] [0.007] [0.014]
Patent & Innovate 0.093*** 0.112*** 0.088*** 0.089*** 0.089*** 0.117***
in Market Product [0.008] [0.015] [0.008] [0.008] [0.009] [0.018]
Do R&D 0.055*** 0.049*** 0.051*** 0.050*** 0.056*** 0.069***
[0.006] [0.012] [0.007] [0.005] [0.007] [0.016]
Export Globally 0.086*** -0.189*** -0.009 0.065*** 0.168*** 0.446***
[0.015] [0.030] [0.015] [0.013] [0.016] [0.038]
Standard errors in brackets.* significant at 10%; ** significant at 5%; *** significant at 1% All regressions include 2-digit industry dummies and a group dummy
strategy. More, the export premium is not affected by the introduction of the inno-vation dummy. We conclude that export and innoinno-vation are independent sources of productivity even if implemented jointly. In other words, to innovate help to export but cannot be the whole story of a successful export strategy.
2. The dimension of export strategies that matters the most for a firm TFP is its scope, namely the destinations to which the firm is selling to. Indeed, to export out of Europe (Global dummy) is significantly and positively associated with TFP. Noticeably, the export status and the export intensity are no more relevant variables once firm size has been controlled for whereas the Global dummy is still significant. This suggests that sunk entry costs into export markets are distance-sensitive and that barriers to entry into intra-European trade are low.
3. Process innovation does not impact significantly a firm TFP when defined commonly (based on the self assessment) while it remains highly significant when innovators are also patenting firms. This result supports the idea that patent activity is a good cri-teria to grasp ”real” innovators and not just ”technology adopters”, i.e. firms which
Table 8: Firm TFP and export and innovation strategies (Multivariate regressions)
Dependent var: log(tfp) I II III IV V VI VII VIII IX X XI XIIa
Export dum. 0.033*** 0.030*** 0.028*** 0.022*** 0.020** 0.016* 0.015* 0.012 0.011 0.01 0.011 0.012 [0.008] [0.008] [0.008] [0.008] [0.008] [0.008] [0.008] [0.009] [0.009] [0.009] [0.009] [0.009] Global dum. 0.044*** 0.041*** 0.039*** 0.036*** 0.035*** 0.034*** 0.033*** [0.007] [0.007] [0.007] [0.007] [0.007] [0.007] [0.007] Export Intensity 0.051*** 0.047*** 0.026** 0.025* 0.024* 0.021 0.018 [0.012] [0.012] [0.013] [0.013] [0.013] [0.013] [0.013] Innovation dum. 0.023*** 0.021*** 0.016** 0.016** [0.006] [0.006] [0.006] [0.006]
Product innov. dum. 0.028*** 0.020*** 0.019*** 0.020**
[0.007] [0.007] [0.007] [0.010]
Process innov. dum. 0.004 0.002 0.002 0.028***
[0.007] [0.007] [0.007] [0.011] Group dummy 0.020*** 0.020*** [0.007] [0.007] Firm size 0.054*** 0.051*** 0.050*** 0.051*** 0.048*** 0.049*** 0.047*** 0.048*** 0.046*** 0.046*** 0.043*** 0.040*** [0.002] [0.003] [0.003] [0.003] [0.003] [0.003] [0.003] [0.003] [0.003] [0.003] [0.003] [0.003] Observations 4610 4610 4610 4610 4610 4610 4610 4610 4610 4610 4610 4610 R-squared 0.25 0.25 0.25 0.25 0.25 0.26 0.26 0.26 0.26 0.26 0.26 0.26 Standard errors in brackets, * significant at 10%; ** significant at 5%; *** significant at 1%
All regressions include 2-digit industry dummies and a group dummy
simply invest in new machines. Indeed, once controlled for the existence of a patent activity, the process innovation dummy impacts positively the firm TFP. Product innovation still matters but has a smaller coefficient than the process innovation dummy (0.2 against 0.28).
7
Conclusion
The results from stochastic dominance study show that export premium is robust to the introduction of innovative activity variables. The TFP cumulative distributions of exporters always dominate the TFP cumulative distribution of non exporters when firms are restricted to innovative firms (whatever the measure of innovative activity). This result contrasts with the one by Cassiman and Golovko (2007) according to which no export premium is found in the subsample of Spanish SME’s innovators. The stochastic dominance study also show a clear difference between global and local exporters that remains in different subsamples of innovating firms.
A deeper investigation of what explains the TFP level leads to more precise results. First, we show that the export premium is robust to the introduction of innovation statis-tics. This introduction does not decrease significantly the size of the export premium. We conclude that export and innovation are independent sources of productivity. More-over, two additional results are found. First, both process and product innovations are significant when considering process innovators with patent. Second, we find a ”super” premium for global exporters: once we specify the export status, the export premium vanishes for intra-Europe exporters, whereas the premium remains highly significant for global exporters. This result supports the hypothesis of fixed entry costs into distant markets (outside Europe) and is consistent with the presence of managerial competencies specific to the activity of exporting.
All in all, our results suggest that being an exporter and/or an innovator is not a signal of efficiency as such. The type of markets you are selling to, and the types of innovations you are undertaking is what matters. In the present study, only Global Exporters and/or Patenting firms outperform their non exporting (respectively non-innovating) counter-parts. We then conclude that the TFP advantage of firms which export globally is not fully accounted by the fact that they innovate more (especially in patentable New Prod-ucts) or by the fact that they are larger. Some other ”abilities”, more specifically linked to export abilities, allow those firms to cumulate the additional costs advantages which help them to succeed on foreign markets.
References
Aw, B. Y., M. J. Roberts, and T. Winston (2007). The complementary role of exports and r&d investments as sources of productivity growth. The World Economy 30 (1): 83–104.
Baldwin, R. and R. Forslid (2004). Trade liberalisation with heterogeneous firms (4635). Basile, R. (2001). Export behavior of italian manufacturing firms over the nineties : the
role of innovation. Research Policy 1185–1201.
Becker, S. O. and P. H. Egger (2007). Endogenous product versus process innovation and a firm’s propensity to export (1906): 28.
Bellone, F., P. Musso, L. Nesta, and M. Qu´er´e (2006). Caract´eristiques et performances des firmes exportatrices fran¸caises. Revue de L’OFCE 98: 183–212.
Bernard, A. B., J. Eaton, B. J. Jensen, and S. Kortum (2003). Plants and productivity in international trade. American Economic Review 93 (4): 1268–90.
Bernard, A. B. and B. J. Jensen (1995). Exporters, jobs, and wages in u.s. manufacturing: 1976-1987. Brookings Papers on Economic Activity Microeconomics.
Bernard, A. B. and B. J. Jensen (1999). Exceptional exporter performance: cause, effect, or both? Journal of International Economics 47: 1–25.
Bernard, A. B. and J. B. Jensen (2004). Why do some firms exports. Review of economic and Statistics 86 (2): 561–569.
Cassiman, B. and E. Golovko (2007). Innovation and the export-productivity link (688). Cassiman, B. and E. Golovko (2008). Product innovation and exports: Evidence from
spanish manufacturing. mimeo IESE Business School University of Navarra.
Costantini, J. and M. J. Melitz (2008). The dynamics of firm level adjustment to trade liberalization. In E. Helpman, D. Marin, and T. Verdier, eds., The organization of firms in a global Economics. Boston, Mass.: Harvard University Press.
D’Este, P., S. Lammarino, M. Savona, and v. Tunzelman (2008). What hampers innova-tion: Evidence from the uk cis4. SPRU Electronic Working Paper Series 168.
Emami Namini, J. and R. A. Lopez (2006). Random versus conscious selection into export markets–theory and empirical evidence .
Griliches, Z. (1990). Patent statistics as economic indicators: a survey. Journal of Eco-nomic Literature VII: 1661–1707.
Grossman, G. M. and E. Helpman (1991). Innovation and growth in the global economy. Cambridge, Mass. and London: MIT Press.
Harris, R. and Q. C. Li (2008). Exporting, r&d, and absorptive capacity in uk establish-ments. Oxford Economic Papers (March): 2–30.
view. Weltwirstschaftliches Archiv 121: 138–251.
Klepper, S. (1996). Entry, exit, growth and innovation over the product life cycle. Amer-ican Economic Review 86: 562–583.
Krugman, P. (1980). Scale economies, product differentiation, and the pattern of trade. The American Economic Review 70 (5): 950–959.
Lachenmaier, S. and L. Wassmann (2006). Does innovation cause exports? evidence from exogneous innovation impulses and obstacles using german micro data. Oxford Economic Papers 58: 317–350.
Lefebvre, E. and L. Lefebvre (2001). Innovative capabilities as determinants of export performance and behaviors: A longitudinal study of sme’s. In A. Kleinknecht and P. Mohnen, eds., Innovation ands Firms performance: Econometric Exploration of Sur-vey Data. London: Palgrave MacMillan Press.
Melitz, M. J. (2003). The impact of trade on intra-industry reallocations and aggregate industry productivity. Econometrica 71 (6): 1695–1725.
Monhen, P. and J. Mairesse (2007). What do we learn from innovation survey. mimeo . OECD (2005). Oslo manual. http://www.oecd.org/dataoecd/35/61/2367580.pdf .
Roper, S. and J. H. Love (2002). Innovation and export performance: evidence from the uk and german manufacturing plants. Research Policy 31: 1087–1102.
Salomon, R. M. and J. M. Shaver (2005). Learning by exporting: new insights from examining firm innovation. Journal of Economics and Management Strategy 14 (2): 431–460.
Starlachcini, A. (1999). Do innovative activities matter to small firms in non-r&d intensive industries ? an application to export performance. Research Policy 28: 819–832. Wagner, J. (2007). Exports and productivity: A survey of the evidence from firm-level
data. The World Economy 30 (1): 60–82.
Wakelin, K. (1998). Innovation and export behavior at the firm level. Research Policy, 26: 829–841.
Yeaple, S. R. (2005). A simple model of firm heterogeneity, international trade, and wages. Journal of International Economics 65: 1–20.
Table A1: Quantile regression on specification XII Quantile regression LnTFP (IX) 5% 25% 50% 75% 95% Export Dum. 0.044*** 0.007 0.008 -0.006 -0.004 [0.017] [0.008] [0.007] [0.010] [0.023] Global dummy. 0.035** 0.030*** 0.030*** 0.032*** 0.039** [0.014] [0.007] [0.006] [0.008] [0.018] Export Intensity -0.03 0.022* 0.031*** 0.063*** 0.059* [0.025] [0.012] [0.011] [0.015] [0.036] Innovation dum. 0.023* 0.021*** 0.021*** 0.021** 0.002 [0.013] [0.006] [0.006] [0.008] [0.020] Prod. innovation dum. -0.017 0.012* 0.022*** 0.032*** 0.033* [0.014] [0.006] [0.006] [0.008] [0.017]
Proc. innovation dum. 0.016 0 -0.003 -0.009 -0.013
[0.012] [0.006] [0.005] [0.008] [0.017] Group dummy 0.061*** 0.046*** 0.038*** 0.034*** 0.042*** [0.006] [0.003] [0.002] [0.003] [0.008] Firm size 0.044*** 0.007 0.008 -0.006 -0.004 [0.017] [0.008] [0.007] [0.010] [0.023] Observations 4610 4610 4610 4610 4610
Figure A1: TFP premium by quintiles for each explicative variable (Spec. XII) −.1 −.05 0 .05 .1 0 .2 .4 .6 .8 1 Export Status −.1 −.05 0 .05 .1 .15 0 .2 .4 .6 .8 1 Export Intensity −.04 −.02 0 .02 .04 .06 0 .2 .4 .6 .8 1 Product Innovation −.04 −.02 0 .02 .04 0 .2 .4 .6 .8 1 Process Innovation 0 .02 .04 .06 .08 0 .2 .4 .6 .8 1 Global Customers .03 .04 .05 .06 .07 0 .2 .4 .6 .8 1 Firm Size