HAL Id: hal-02870577
https://hal.archives-ouvertes.fr/hal-02870577
Submitted on 16 Jun 2020
HAL is a multi-disciplinary open access
archive for the deposit and dissemination of
sci-entific research documents, whether they are
pub-lished or not. The documents may come from
teaching and research institutions in France or
L’archive ouverte pluridisciplinaire HAL, est
destinée au dépôt et à la diffusion de documents
scientifiques de niveau recherche, publiés ou non,
émanant des établissements d’enseignement et de
recherche français ou étrangers, des laboratoires
dust
T Claquin, M Schulz, Yves Balkanski, O Boucher
To cite this version:
T Claquin, M Schulz, Yves Balkanski, O Boucher. Uncertainties in assessing radiative forcing by
mineral dust. Tellus B - Chemical and Physical Meteorology, Taylor & Francis, 1998, 50 (5),
pp.491-505. �10.3402/tellusb.v50i5.16233�. �hal-02870577�
Uncertainties in assessing radiative forcing by mineral dust
By T. CLAQUIN1,2*, M. SCHULZ1, Y. BALKANSKI2 and O. BOUCHER3, 1Institut fu¨r Anorganische und Angewandte Chemie, Universita¨t Hamburg, Germany; 2L aboratoire des Sciences du Climat et de
l’Environnement, CEA-CNRS, Saclay, France;3L aboratoire d’Optique Atmosphe´rique, Universite´ de L ille 1, France
(Manuscript received 4 March 1998; in final form 18 June 1998)
ABSTRACT
The assessment of the climatic effects of an aerosol with a large variability like mineral dust requires some approximations whose validity is investigated in this paper. Calculations of direct radiative forcing by mineral dust (short-wave, long-wave and net) are performed with a single-column radi-ation model for two standard cases in clear sky condition: a desert case and an oceanic case. Surface forcing result from a large diminution of the short-wave fluxes and of the increase in down-welling long-wave fluxes. Top of the atmosphere (TOA) forcing is negative when short-wave backscattering dominates, for instance above the ocean, and positive when short-wave or long-wave absorption dominates, which occurs above deserts. We study here the sensitivity of these mineral forcings to different treatments of the aerosol complex refractive index and size distribution. We also describe the importance of the dust vertical profile, ground temperature, emissivity and albedo. Among these parameters, the aerosol complex refractive index has been identified as a critical parameter given the paucity and the incertitude associated with it. Furthermore, the imaginary part of the refractive index is inadequate if spectrally averaged. Its natural variability (linked to mineralogical character-istics) lead to variations of up to±40% in aerosol forcing calculations. A proper representation of the size distribution when modelling mineral aerosols is required since dust optical properties are very sensitive to the presence of small particles. In addition we demonstrate that LW forcing imply a non-negligible sensitivity to the vertical profiles of temperature and dust, the latter being an important constraint for dust effect calculations.
1. Introduction sources are very different. Anthropogenic activities
produce sulfate, nitrate, soot, and organic par-ticles, biomass burning is responsible for smoke Aerosol particles are known to affect the
radi-(composed of soot and organics), whereas mineral ation balance of the Earth through scattering,
dust outpours downwind the main arid and semi-absorption, and emission of radiation (the direct
arid regions of the Earth. The direct short-wave effect) and because they can act as cloud
condensa-effect of sulfate has been estimated within the tion nuclei, thereby modifying cloud albedo and
range−0.3 to −1 W m−2 (Charlson et al., 1992, lifetime (the indirect effect, Twomey et al., 1984).
Kiehl and Briegleb, 1993, Boucher and Anderson, There is a growing body of evidences that aerosols
1995). Penner et al. (1992) showed that biomass are responsible for a significant climate forcing
burning has an effect of similar magnitude and since the pre-industrial times although the
magni-same sign. Estimation of the radiative forcing by tude of these effects is very uncertain (IPCC,
mineral dust is complicated by additional factors. 1995). Aerosol concentration and composition
First and in contrast to ‘‘pure’’ sulfate particles, vary widely from region to region because aerosol
absorption of solar radiation and effect on long-wave radiation (greenhouse effect) have to be
considered. Second, the large space and time vari- wind of Asian and south Hemispheric sources. We assume then that this sensitivity study can be done ability of aerosol concentration and composition
with a one dimensional radiative code and two requires that calculations be accurate for a large
cases representative of dust natural variability. range of aerosol optical depths and particle sizes.
Having in mind that the Atlantic plume extending Third, we need a good description of local
para-from the Sahara well out to America may be the meters, such as surface short-wave albedo, R
s, and most important region when considering mineral long-wave emissivity, e, as well as surface and
dust effects and variability, we take the two stand-atmospheric temperatures.
ard cases along this plume. The desert case, above The knowledge of aerosol parameters
(distribu-the Sahara, is chosen because (distribu-the largest dust tion and composition) and radiative fluxes is
pro-concentrations and particles with large radii occur vided by in-situ measurements (Fouquart et al.,
there, having potentially a large radiative impact. 1987; Ackermann and Chung, 1992) with limited
The ocean case represents the globally largest coverage. Satellite instruments (such as Meteostat,
uniform surface over which dust can be encoun-AVHRR (Advanced Very High Resolution
tered and accounts for a background dust effect Radiometer) or POLDER) can provide estimates
far from the source. Other situations of interest of dust optical depth over ocean surfaces devoid of
can be inferred from tables and figures. It is clouds (Tanre´ et al., 1988; Dulac et al., 1992; Husar
nowadays impossible to distinguish natural from and Stowe, 1997), but particle non-sphericity,
accu-human-influenced dust, especially because the racy of aerosol model and discrimination between
knowledge of the historical evolution of dust cloudy and dusty pixels are clearly an issue. The
sources is poor. Representative values for each use of modelling therefore appears to be necessary
parameter in the two cases are therefore chosen to provide a global coverage of dust geographical according to present-time observations.
and altitude distribution that satellite are not able to provide yet. Global simulations of the mineral
2.1. Atmospheric properties dust transport and radiative impact have been
Our set of parameters for the desert and the initiated by Tegen et al. (1996) and Tegen and
oceanic cases are described in Table 1. According Lacis (1996). They concluded to an average
to the literature, surface SW albedo, Rs, is 0.3 over 1 W m−2 loss of radiation at the surface but found
the desert (Cabot, 1995) and 0.06 over the ocean a small change in flux at the top of the atmosphere
(Payne, 1972), and the LW surface emissivity,e, (TOA). To facilitate such a calculation on a global
is 1 (Legrand et al., 1992). We do not account for scale, Tegen and Lacis (1996) resorted to discretisize
spectral dependence in R
sore. We took a mean the size distribution in 8 bins and chose a constant
annual surface temperatures T
surf of 27 and 24°C refractive index. However, measurements of this
over the desert and the ocean, respectively. The refractive index show large scatter (Sokolik et al.,
seasonal variation of these temperatures was intro-1993), which might pose problems for a precise
duced by a sinusoidal adjustment. The diurnal description of the dynamics of optical properties.
amplitude of surface temperature is 30°C over the The scope of this paper is to outline some critical
desert (Legrand et al., 1992) and is neglected over points in the global modelling of dust climatic
the ocean. This diurnal variation in temperature impact. We investigate the sensitivity of its forcing
is attenuated with height over desert and vanishes (SW, LW and net — TOA and surface) to a set of
at the top of the boundary layer (Riehl, 1954). We critical parameters like aerosol size distribution,
represent in Fig. 1 the temperature decrease with refractive index and atmospheric column proper- height over the desert and a temperature inversion ties. The accuracy of the above-mentioned para- between 980 and 900 hPa over the ocean (Carlson meters needed to achieve a realistic dust forcing is and Benjamin, 1980).
determined from the sensitivity tests.
2.2. Aerosol properties
2. Model and method Particles are distributed following a log-normal
function: The evaluation of dust radiative effect require a
global dust distribution, but results of transport n(r)= N0 앀2prs0exp
A
−(ln r−ln mnr)2
2s20
B
, (1) models still need to be refined, especiallydown-t0 the aerosol optical depth and p0 the mean pressure of the dust cloud. The distribution is normalised so that the integrated optical depth between the ground and 573 hPa ist0. The dust vertical distribution is presented in Fig. 1. We use the 11 levels vertical resolution of typical global models (GCM or chemical transport model ). Over the desert, dust is homogeneously mixed in the boundary layer (Carlson and Benjamin, 1980), which can be represented with a large value of sheight such as 10. The optical depth t550 measured by sun photometers reaches 2 near source regions (Moulin et al., 1997), but goes down to an average of 0.2–0.3 at Sal Island, which is situated down-wind but close to the source region. To account
Fig. 1. Dust vertical distributions simulated with the for a continental region which would not be too
normal distribution (see text) for different values of specific of a dust storm situation, we chose the sheight. Concentrations are given in relative unit since the value 0.5. Over the eastern tropical Atlantic Ocean,
distributions are normalised to a same total optical depth
the Saharan air layer is simulated withsheight=2,
t0 between the surface and 573 hPa. Vertical profiles of and p
0=840 hPa. The IPCC report gives a global
temperature are also given for the two standard cases
value of 0.023 for dust optical depth, while Husar
(desert and oceanic with inversion).
et al. (1997) measured an annual value of 0.2 above the West Atlantic, this value accounting for where n(r) dr is the number of particle radius
the whole aerosol burden. According to Moulin between r and r+dr, s
0=lnsg the standard devi- et al. (1997), an optical depth of 0.2 is more ation,sg being the geometric standard deviation,
specific for regions closer to the source. For this mnr the mean number radius, and N
0 the total study we chose the low value of 0.05 to account number of particles. Such a distribution is
for a ‘‘background’’ dust downwind and far from adequate for mineral dust (Gomes et al., 1990).
the source. It is noticeable that the optical depth-We consider a size distribution of mineral dust
forcing relationship is almost linear and well with sg=2 and mnr=0.7 mm (mmr=2.95 mm) in
described (Coakley et al., 1983), and therefore the the desert (d’Almeida, 1987) and 0.2 mm (mmr=
choice of a constant optical depth does not modify 0.84 mm) over the ocean (Schu¨tz, 1979). Associated
our conclusions. to the refractive indices described later, these
One of the most important parameters to evalu-distributions produce Angstro¨m coefficients of
ate the radiative properties of dust is the complex −0.09 (ocean case) and −0.15 (desert case), which
refractive index, m(l)=n∞(l)−in◊(l), n∞ being the are realistic for pure dust cloud (Schu¨tz, 1980;
ratio of the light velocity in the medium to the Dulac, 1992; Chiapello, personal communication).
light velocity in vacuum while n◊ characterises the Gomes et al. (1990) showed that a submicron
absorption of the medium. On the one hand, mode sometimes appears in aerosol source regions,
the real part n∞ is not thought to experience great but to facilitate comparisons in this sensitivity
variations with dust composition (Sokolik et al., study, we will only consider one mode in the
1993; Patterson, 1981), we therefore use n∞(l) as desert case.
described in Volz (1973) and Patterson (1981). On The distribution of dust optical depth with
the other hand, the imaginary part n◊ varies over height is idealised following a normal distribution:
a wide range as a function of the mineralogy. Since there are no complete measurements of m(l) throughout the spectrum, we define for the rest of t( p)= t0 exp
A
−( p−p0)2 2s2heightB
P
573 hPa 1013 hPa expA
−( p−p0)2 2s2heightB
dp , (2)the study three comprehensive cases representing realistic mineralogical compositions. For the remote oceanic case, where clay dominates (Volz, 1973), we use an index built on the Volz (1973) where p is pressure,sheight the standard deviation,
and Patterson (1981) measurements from an issue for flux calculations. The parameters (Q
ext,v, g) are spectrally averaged over all spectral Barbados samples ( hereafter ‘‘remote’’). Such a
composite refractive index has already been used intervals and tabulated for 9 values of the standard deviation and 64 values of mnr. Interpolation from in Tegen and Lacis (1996) and in d’Almeida (1987).
For source regions, samples are supposed to con- the tabulated values of (Q
ext,v, g) leads to max-imum errors of 1%, which is satisfactory in view tain more quartz (Lindberg and Gillepsie, 1977,
Patterson, 1981), that sharpens and shifts the Si–O of the large saving of computing time that is achieved. Aerosol optical depth,ti, is evaluated in stretching vibration around 9.2 mm. Measurements
on source region samples reproduce these features each spectral interval i from only for a limited wavelength range (Grams et al.,
1974, Lindberg and Gillepsie, 1977), or do not t
i≈t550QQext−550ext−i , (3) show clearly these features (Sokolik et al., 1993).
We use therefore in the desert case the composite
where t550 is the optical depth at the 550 nm refractive index ( hereafter ‘‘source’’) of Ivlev and
wavelength, Qext-i and Qext−550 are the extinction Popova (1973) linked in the visible to the 4 mm coefficient averaged over interval i and at 550 nm, diameter category of Lindberg and Gillepsie
respectively. (1977) and linked over 15 mm to the quartz results
Forcings are integrated daily and yearly at the from Toon et al. (1977). For comparisons, we also
latitude 20°N where dust outbreaks occur above use measurements of Sokolik et al. (1993) referred
the Atlantic ocean. We compute the forcing for in the text as ‘‘source 2’’. The ‘‘remote’’, ‘‘source’’
every 1° of solar zenith angle and make a weighted and ‘‘source 2◊ indices are presented over the
average to account for the diurnal and seasonal whole spectrum in Fig. 2.
variations in solar zenith angle. Our forcings are therefore an annual mean except for the ‘‘winter’’ and ‘‘summer’’ forcing in Fig. 6 where forcings are 2.3. Optical and radiative codes
computed for the winter and summer solstice We calculate the radiative effect of mineral dust
respectively. using the radiative code developed by Fouquart
and Bonnel (1980) and Morcrette (1989) and presently used in the ECMWF forecast model. It
uses a two stream formulation in the solar range 3. Forcing for the ‘‘ocean’’ and ‘‘desert’’ cases
with two spectral intervals (0.25–0.68 mm and
0.68–4.0 mm), and a broad band flux emissivity Dust forcings for these 2 cases are presented in Table 3. The mineral dust effect is significant both method in 6 spectral intervals between 0 and
2620 cm−1 in the infrared range. With the Delta- for short-wave (SW) and long-wave (LW) radi-ation, at the top of the atmosphere (TOA) and at Eddington approximation, aerosol optical depth,
t0, single scattering albedo, v, and asymmetry the surface.
At the surface, the net forcing is the result of parameter, g, are sufficient to compute the solar
fluxes when combined with Rayleigh scattering short-wave loss of sunlight by absorption and back-scattering during the daytime, and of the and molecular absorption. The short-wave code
has been compared with many others (Boucher permanent long-wave gain of energy by emission of dust. The surface forcing is therefore negative et al., 1997), and is proven to overestimate, in
absolute values, the positive and negative forcings during the daytime and positive during the night. At the ocean surface, the SW reduction dominates of sulfate aerosols (between 10 and 20%). In the
infrared spectrum, the atmosphere is assumed to and we find a yearly negative forcing. On the other hand, the desert case shows a positive forcing be non-scattering and an optical depth is sufficient
to describe aerosol effects. Aerosol optical para- at the surface produced by the LW effect. The occurrence of this positive forcing is opposite to meters (Qext, v, g) are calculated following Mie
theory from mnr,sg, and m(l) under the assump- the conclusions of Sokolik and Golitsyn (1993) and to the common idea that aerosols always tion of a log-normal size distribution of
homogen-eous spherical particles. According to Mishchenko reduce energy fluxes at the surface. Since this feature depends mainly on the aerosol size distri-et al. (1995), non-sphericity of dust particles is not
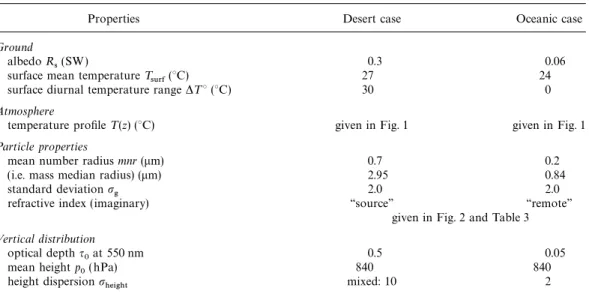
Table 1. Atmospheric, surface, and particle properties for the desert and the oceanic standard cases; references are given in the text
Properties Desert case Oceanic case
Ground albedo R
s(SW) 0.3 0.06
surface mean temperature Tsurf(°C) 27 24 surface diurnal temperature range DT° (°C) 30 0 Atmosphere
temperature profile T (z) (°C) given in Fig. 1 given in Fig. 1 Particle properties
mean number radius mnr (mm) 0.7 0.2
(i.e. mass median radius) (mm) 2.95 0.84
standard deviationsg 2.0 2.0
refractive index (imaginary) ‘‘source’’ ‘‘remote’’ given in Fig. 2 and Table 3 Vertical distribution
optical deptht0 at 550 nm 0.5 0.05
mean height p
0( hPa) 840 840
height dispersionsheight mixed: 10 2
bution for a fixed surface albedo, we will discuss Table 2. Spectrally weighted averages of the two it in details in Subsection 4.2.
ref ractive indices used in the two standard cases With regard to the TOA, dust heats the Earth in trapping long-wave radiation (‘‘greenhouse
Refractive index
effect’’) while the short-wave effect is a negative forcing (‘‘white-house effect’’, Schwartz, 1996) or a
imaginary part: n◊
positive forcing depending on surface albedo and
real
remote source part particle properties. In the oceanic standard case, we find a negative variation in the radiation
0.3–4 mm 6.57e-3 7.59e-3 1.534 budget at the TOA, which confirms the previous 4–100 mm 0.465 0.462 1.996
results of Carlson and Benjamin (1980). The desert case shows a strong positive forcing at the TOA.
0.3–0.7 mm 6.66e-3 4.43e-3 1.562
Tegen and Lacis (1996) found that large positive
0.7–2 mm 4.81e-3 9.36e-4 1.527
2–4.5 mm 1.01e-2 3.31e-2 1.482 forcing above deserts compensate, on a global
4.5–8 mm 6.24e-2 0.141 1.414 scale, the small negative forcing above oceans.
8–12 mm 0.424 0.402 1.945 Measurements of dust forcings with the same 12–100 mm 0.564 0.552 2.134
surface and atmospheric parameters are seldom. Nevertheless, our results are qualitatively consist-ent with observations of Ackerman and Chung (1992) at the TOA and of Cautenet et al. (1992) Table 3. Forcings in the 2 standard cases (W m−2)
at the surface.
TOA forcing Surface forcing
4. Sensitivity to aerosol properties
SW LW Net SW LW Net
Ocean case 4.1. T he imaginary part of the ref ractive index n◊
−1.54 +0.15 −1.39 −3.89 +0.97 −2.92
The imaginary part of the refractive index is
Desert case
known to have a large variability, essentially
+8.4 +11.9 +20.4 −33.3 +47.7 +14.4
different mineralogy (Fig. 2, upper panel). Sokolik The absolute variability of the imaginary part n◊(l) is reflected in the ‘‘maximum’’ and ‘‘min-and Toon (1996) outlined its influence on radiative
parameters but did not separate its effect from the imum’’ envelope of known refractive indices (Fig. 2, lower panel ). Using these two indices, the size distribution effect. We want here to quantify
the importance of the refractive index variability standard cases shows large differences in the obtained dust forcing: for instance at the TOA in on forcing calculations independently from the
size distribution. the ocean case, the ‘‘maximum’’ envelope is responsible for a large SW absorption (+0.95 W m−2) and therefore for a net positive forcing (1.16 W m−2), contrary to the standard case (−1.39 W m−2). In the same way, in the desert case, the net SW surface forcing goes down to −60 W m−2 with the ‘‘maximum’’ envelope, which represents a 100% difference to the standard case. The refractive index absolute variability is therefore responsible for an uncertainty on the amplitude and on the sign of desert dust radiative forcings. In order to reduce these uncertainties, we focus in the following on two major sources of variability: differences in the mineralogical com-position of dust samples, but also large uncertain-ties (40%) in refractive index measurements (Patterson, 1981; Sokolik et al., 1993).
The variability with the mineralogy of the ima-ginary part n◊(l) is reflected in the ‘‘remote’’, ‘‘source’’ and ‘‘source 2’’ indices defined previously as representative cases of real mineralogical situ-ations, we therefore apply them to the standard cases (Table 4, first lines). It is noteworthy that these two new cases are not unrealistic: a ‘‘remote’’ dust model can occur above a continent far from the sources (e.g., above Europe) and a ‘‘source’’ mineral aerosol could be observed above the east Atlantic during large dust outbreaks. This variabil-ity in the mineralogy is responsible for an uncer-tainty between±11 and ±16% at the TOA and between±8 and ±40% at the surface (Table 4). For instance, the ‘‘remote’’ clay-rich absorbs more solar energy than the ‘‘source’’ quartz-rich samples because n◊ is higher in this range. This can be seen above the desert where the TOA forcing increases by 7.7 W m−2 (from 20.4 to 28.1 W m−2), when we apply the ‘‘remote’’ dust composition.
Measurements on the imaginary part of
refract-Fig. 2. Imaginary part of refractive indices. In the upper
panel are shown existing measurements from Toon et al. ive index are known to have an uncertainty of
(1977), Sokolik et al (1993), Ivlev and Popova (1973), 40% (Patterson, 1981, Sokolik et al., 1998). Since Patterson (1981), Volz (1973), Carlson and Benjamin we do not know how this error is distributed with (1980), Levin et al. (1979), Grams et al. (1974) and
wavelength, we chose to make a maximum
Lindberg and Gillepsie (1977). In the lower panel are
assumption and raised or reduced the refractive
presented the composite refractive indices defined in the
index linearly by 40% throughout the spectrum.
text, and the maximum and minimum envelope also used
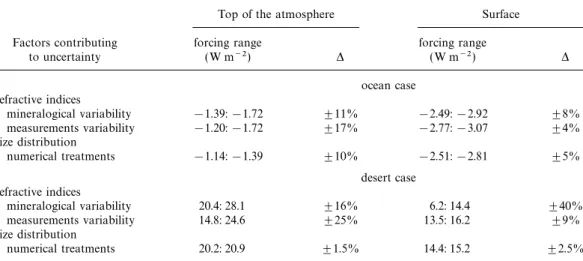
Table 4. Optical factors contributing to the uncertainties in calculations of dust radiative eVect
Top of the atmosphere Surface Factors contributing forcing range forcing range
to uncertainty (W m−2) D (W m−2) D ocean case refractive indices mineralogical variability −1.39: −1.72 ±11% −2.49: −2.92 ±8% measurements variability −1.20: −1.72 ±17% −2.77: −3.07 ±4% size distribution numerical treatments −1.14: −1.39 ±10% −2.51: −2.81 ±5% desert case refractive indices mineralogical variability 20.4: 28.1 ±16% 6.2: 14.4 ±40% measurements variability 14.8: 24.6 ±25% 13.5: 16.2 ±9% size distribution numerical treatments 20.2: 20.9 ±1.5% 14.4: 15.2 ±2.5% Net forcings at the surface and at the top of the atmosphere are ranked and an uncertainty factor is given for each parameter. We test the mineralogical variability of the refractive index with the ‘‘source’’, ‘‘source2’’ and ‘‘remote’’ indices defined in the text, and the variability in indices measurements is tested by rising or reducing the indices from 40% throughout the spectrum. For the size distribution, a gamma, a log-normal and a ‘‘bins’’ numerical treatments are used.
are around ±20% at the TOA and are under (visible and infrared), since such indices are some-times used, and a six interval weighted average. ±10% at the surface.
From these 2 experiments, the variability in The latter discretisation was chosen to catch min-eralogical variability: 0.3–0.7 mm for the visible, forcing calculations due to the only refractive
index variability reaches±40% at the TOA. This 0.7–2 mm for the near infrared which is seldom measured, 2–4.5 mm for the 3 mm absorption peak point brings 2 conclusions: first extensive
measure-ments of the dust refractive indices with reduced (quartz, sulfates, water, etc), 4.5–8 mm for the 7 mm carbonate peak, 8–12 mm for the silicate signature uncertainties are necessary, and second a
minera-logical understanding and modelling of dust out- and 12–100 mm for the far infrared. Averages of the refractive indices are shown in Table 2. In the breaks should be developed since the use of one
refractive index for all situations lead to large ocean case, the two averaging method are satisfact-ory with variations within 6% compared to the uncertainties. On the other hand, the mineralogical
modelling of desert dust is probably very difficult reference case, whereas the desert case is poorly represented even with the six intervals scheme, since it requires a knowledge of sources, transport,
mixing and refractive index of all species. with variations with the reference case up to 32%. This difference is explained by the internal variab-Nevertheless, the calculation would be easier if
the wavelength dependence of n◊(l) could be neg- ility of the refractive indices: the ‘‘source’’ index is very variable, with changes of orders of magnitude lected, i.e., if the averaging of n◊(l) and of the
optical parameters over the wavelength spectrum along the spectrum. Such variations bring import-ant non-linearities inside Mie calculations. These would eliminate the non linearity of the Mie
calculations. This would reduce the number of tests clearly show that the whole wavelength dependency needs to be considered.
variables and allow comparisons with measure-ments which are often limited or integrated on a spectral band. Such a discretisation of the
refract-4.2. Sensitivity to aerosol size distribution ive index was used by Carlson and Benjamin
(1980) who chose 13 intervals. To go further, we In order to calculate optical properties, the population of particles can be described by the test here two cases: a two interval weighted average
two first moments of its size distribution (Hansen and Travis, 1974). We focus here on the mean number radius mnr and on the geometric standard deviation sg, and show how they influence dust radiative impact. Then we outline the ability of the different size distribution schemes used in global models to reproduce the optical properties of the two standard cases.
It is important to emphasise that our study is made with a constant optical depth and not for a constant aerosol mass loading: when the nmr rises the total mass rises too. This approach is justified because satellite measurements provide a con-straint on aerosol optical depth. The variations of radiative parameters as a function of the mean radius for different sgare shown in Fig. 3.
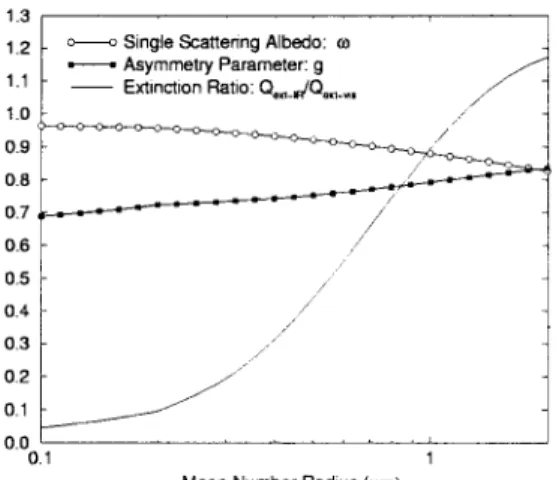
4.2.1. Sensitivity to the mean number radius mnr. The importance of mnr on the radiative parameters is evident from Fig. 3, upper panel. With a greater mnr, the visible absorption and forward scatter-ing increase, but also the extinction ratio Qext−IR/Q
ext−550. The latter implies that the LW forcing takes more importance when large par-ticles are included in the size spectrum. The influ-ences of these variations on radiative forcings are presented in Fig. 4 where we vary mnr based on the two standard cases, the standard deviation of the size distribution being fixed to the reference value of 2.
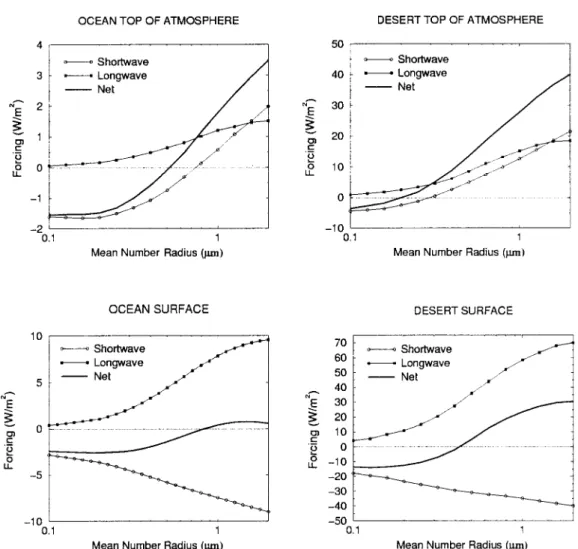
At the top of the atmosphere (Fig. 4, upper panels), the long-wave forcing is positive and the short-wave forcing is negative for small, backscatt-ering, particles and positive for large, absorbing, particles. These two components are both slowly increasing with the mnr for small distributions and
Fig. 3. Single scattering albedo,v, and asymmetry
para-steeply increasing when mnr is over 0.3 mm (mmr
meter, g, in the visible range as a function of mean
above 2.1 mm). As a result, a 20% uncertainty in number radius (mm). Also shown is the ratio of the the mnr is responsible for a negligible variation extinction efficiency in the infrared to that at 550 nm, (under 1%) in the forcing calculation above the Qext
−IR/Qext−550. In the upper panel, results are given for a geometric standard deviation of the size distribution
ocean, where mnr=0.2mm, and for a 22%
uncer-sg=2. In the lower panel, results for Qext−IR/Qest−550 are
tainty in the forcing calculation above the desert
given for 3 different values of s
g(1.6, 2 and 2.4 ). The
where mnr=0.7mm. One should also notice that
refractive index is the ‘‘remote’’ one (see text and Fig. 2).
the net TOA forcing turns from a negative to a positive value for a mnr around 0.5 mm above the
ocean (mmr=2.1 mm), and for mnr around 0.2 At the surface (Fig. 4, lower panels), the LW positive forcing is opposite to the SW forcing. above the desert (mnr=0.84 mm). The change of
the TOA forcing from positive to negative is an With increasing mnr, the larger absorption (LW and SW) in the dust layer is responsible for a important feature that we discuss in Section 5
together with the surface albedo dependence of positive LW forcing and a negative SW forcing. Nevertheless the LW effect increases more steeply the forcing.
Fig. 4. Mineral dust forcing (short-wave, long-wave, and net in W m−2) at the TOA (upper panels) and at the surface ( lower panels) as a function of mean number radius, mnr. The results are presented for the oceanic case ( left panels, t=0.05) and the desert case (right panels, t=0.5), the geometric standard deviation of the size distribution is s
g= 2. in both cases. Note the different scales for the forcings.
and the net radiative budget at the ground rises close to 0.55 in the Sahara, all these values being representative of a dust ‘‘background’’ loading. In with mnr from negative values over the ocean to
significant positive values over the desert. As our desert case, k is equal to 0.6 because we study here a pure dust cloud. One should note that previously at the TOA, surface forcings are much
more sensitive to the mnr when large particles are Fouquart et al. (1980) and Carlson and Benjamin (1980) estimated k between 0.1 and 0.3 but with involved ( large mnr). To understand how such a
positive forcing can occur at the desert surface, smaller mnr. In fact, the relationship between mnr and k is very sensitive when mnr is larger than the determinant parameter is Qext−IR/Qext−550,
hereafter k. Measurements of k made in 0.3 mm (mmr=1.26 mm) (see Fig. 3): for example, k=0.3 corresponds to a mnr close to 0.35 mm Tadzhikistan during the USSR-USA campaign
gave values between 0.3 and 0.5 (Sokolik and (mmr=1.48 mm, desert ‘‘background’’) while k= 0.55 corresponds to a mnr equal to 0.6 mm (mmr= Golitsyn, 1993) and d’Almeida (1987) found a k
2.5 mm, dust outbreak). In their one dimension study, Sokolik and Golitsyn (1993) resorted to use k=0.3 and concluded then to a systematic negative forcing at the surface. This result is also shown on Fig. 4: forcing at the surface are negative when mnr is under 0.41 mm (mmr=1.72 mm), but a significant gain of energy also appears at the ground for larger mnr, i.e., in dust storm condi-tions, and since these events are probably respons-ible for a large dynamic response, such a result is noteworthy.
4.2.2. Sensitivity to the standard deviationsg of the size distribution. If we go back to Fig. 3, lower panel, we see that the standard deviationsg of the size distribution has a strong effect on the extinc-tion ratio Q
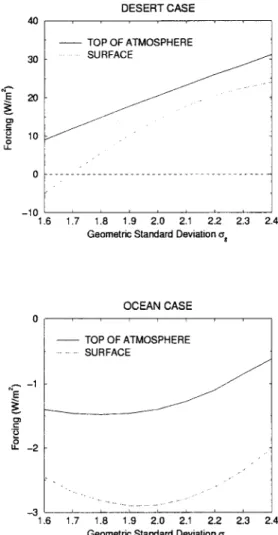
ext−IR/Qext−550. The effect of sg on parameters in the visible (g and v) is small and not shown. An increase insg brings large particles in the size distribution. Their large surface, together with a large extinction coefficient, is responsible for an increase of Qext−IR (and a decrease of v), and therefore of tIR/t550. The influence ofsg is then the composition of a growing LW influence and, to a smaller extent, of a larger SW absorption. As reflected in Fig. 5, results are mainly an increase in forcings at the surface and at the TOA, both for the desert and oceanic cases. The quasi-linearity and the low sensitivity of the sg-forcing relationship around sg=2 is note-worthy: ifsg remains close to 2 (d’Almeida, 1987), the use of an average value for sg is sufficient. Only for large variations of sg, effects on the visible radiative parameters bring noticeable
non-Fig. 5. Net dust forcing (W m−2) at TOA and at the
linearities (Fig. 5). For example, with a sg=3.2
surface as a function of the geometric standard deviation
(Shettle, 1984) the TOA forcing above the desert
sg of the size distribution. Results are for the desert case
increases by more than 20 W m−2. But such a ( left panel ) and the oceanic case (right panel ) as defined largesg is seldom observed. in Tables 1, 2. Mean number radius is 0.7 and 0.2 mm,
respectively.
4.3. Sensitivity to the numerical treatment of the size distribution
the first case and the arbitrate choice of shape for the distribution for the second case are both One can handle the aerosol size distribution by
two numerical treatments: a ‘‘bin’’ scheme, where responsible for uncertainties in the calculations. We aim to assess here if these uncertainties are particles are distributed into size classes which are
then used as tracers, and a ‘‘spectral’’ scheme significant for radiative calculations. The quality of spectral scheme representation in transport where the evolution of the population is described
by the variation of its first moments (e.g., the mean models has been discussed in Schulz et al. (1998). The application of a ‘‘bin’’ scheme to dust mass diameter and the standard deviation)
assum-ing any regular type of distribution. The assump- radiative calculations has been initiated by Tegen and Lacis (1996). Each of their 8 bins has constant tion of constant optical properties in each bin for
optical properties assuming for each bin a gamma and includes a temperature inversion between 980 and 900 hPa for the oceanic case. The influence distribution withseff=0.2, seff being the effective
standard deviation. That means that radiative of temperature profile on forcing is closely linked to dust distribution with height because these two parameters are fixed for each bin and used after
transport to evaluate properties for the whole profiles both act on LW fluxes. Note that the dust forcing at the TOA depends on the difference population. We applied this approach to the two
standard cases in redistributing the log-normal between the ground temperature and the aerosol temperature while the surface forcing depends on distribution in the eight bins defined in Tegen and
Lacis (1996), spanning from 0.1 to 10 mm. Both in the aerosol layer temperature. In this section, we will often consider the energy deposition in the the desert and in the ocean case, results are very
close (within 10%) to the calculations with the dust layer (net forcing at the TOA−net forcing at the surface). This deposition is necessary to evalu-log-normal distribution (Table 4).
On the other hand, if one would use a spectral ate any atmospheric response to a forcing and depends on the column distribution of temperature representation of the size distribution, one would
need to decide the shape of its size distribution. and dust. One should note that this energy depos-ition is around 1.5 W m−2 in the ocean case and To test the importance of this choice, we applied
gamma distributions to our standard cases, keep- 6 W m−2 in the desert case.
The TOA forcing increases with the surface ing constant the effective radius and effective
variance (Hansen and Travis, 1974) and we mean temperature Tsurf since LW fluxes are linked to T4surf. In fact, T
surfcontrols also the temperature observe the difference with log-normal
distribu-tions used previously. There are no significant in the dust layer, therefore, the surface forcing increases with Tsurf. But even for the desert case differences between these numerical treatments of
the size distribution (Table 4). Nevertheless, for where surface temperature are subject to large variations, a 5°C error in T
surf only leads to a the ocean case, where the SW forcing dominates,
a large part of the variability is explained by 2 W m−2 in the TOA forcing and 3 W m−2 at the surface. Therefore, since surface temperatures are differences in the LW forcing which goes from
0.15 to 0.20 W m−2 with the gamma distribution, usually well known, they should not be responsible for large errors in dust forcing calculations. especially because of differences in the treatment
of small particles. This finding temperates the However, one has to remember that a dust cloud influences the soil temperature (Cautenet et al., conventional view that the effective radius and
effective radiance of an aerosol population are 1992), and that the occurrence of a positive feed-back is therefore possible.
sufficient to predict the aerosol optical properties.
The dust height at mean pressure level p0 deter-mines the temperature of the dust layer. The higher the dust layer is, the larger the TOA forcing
5. Sensitivity to column and surface
properties is and the smaller the surface forcing: a high layer
traps more energy in the dust cloud. In the ocean case, if the mean height of the dust layer goes In this section, we focus on the column
proper-ties, i.e. the distribution of temperature and dust from 926 to 717 hPa, the energy kept in the atmosphere raises from nearly from 1.5 to with height, but also LW emissivity and SW
albedo. 2.5 W m−2 (60% difference). This points out that the evaluation of a climatic impact of dust may need a precise knowledge of its vertical 5.1. Sensitivity to the column distribution
distribution.
The shape of the temperature profile andsheight, In our model, the temperature profile is
deter-mined by three parameters: the surface daily- i.e. the ‘‘physical’’ depth of the dust cloud, act together on the dust radiative forcing because they averaged temperature, Tsurf, its diurnal amplitude,
DT
surf, and the shape of the vertical temperature influence the dust layer mean temperature. For example above the desert, ifsheight goes from 10 profile. The surface temperature influences the
whole boundary layer following a given profile to 2 (Fig. 1), the dust height being constant, the energy deposition in the dust layer raises from 6 which decreases with height for the desert case
to 8 W m−2 (+33%). This proves that the surface negative forcing of high dust is not completely compensated by the positive forcing of low dust, therefore the average height of the dust layer is not enough to assess its LW effect. The non-validity of an ‘‘average height’’ in radiative calcula-tion is noticeable for mineral dust which is often distributed in many thin layers (Swap et al., 1992). The diurnal temperature range does not play a significant role. The daytime high LW forcing compensates for the nighttime low LW forcing. If we neglect a possible dynamic effect, a daily average of the temperature is enough to evaluate a radiative forcing.
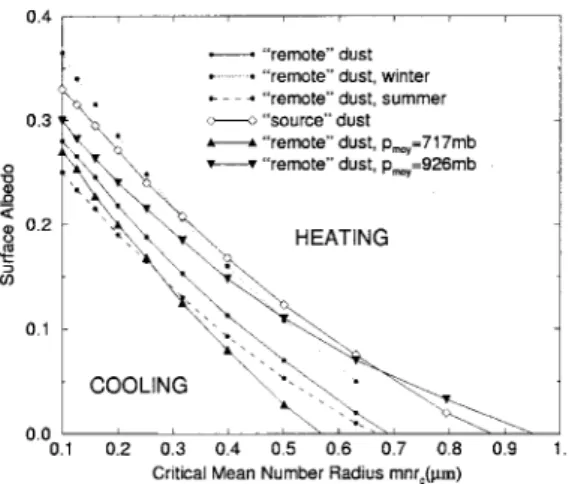
Fig. 6. Regions of net positive/negative forcing at the
5.2. Sensitivity to surface L W emissivity and SW
TOA as a function of the surface albedo, R
s, and the
albedo
mean number radius, mnr. In the region of the graph above each curve, the dust heats the Earth/Atmosphere
Following Legrand et al. (1992), the LW
emis-system, while under each curve the system is cooled.
sivity of the surface emissivitye varies in the desert
Results are presented for two refractive indices (clay rich:
between 0.9 and 1. Applyinge=0.9 in the desert
‘‘remote’’, and clay and quartz: £source’’), and then with
case reduces the TOA by 2 W m−2 and the surface the ‘‘remote’’ dust for two seasonal extrema (winter and forcing by 5 W m−2. Since e acts linearly on the summer solstice) and for two different heights of the dust
emission of LW radiation by the ground, it also layer (p
0of 926 and 717 hPa). We use the parameters of the oceanic case defined in Table 1 except for the mean
has a linear impact on the forcing, therefore
number radius and surface albedo which are varied
averages are sufficient for global calculations.
between 0.1 to 1.mm and 0 to 0.4, respectively.
The SW forcing is known to increase linearly with (1−R
s)2 (Charlson, 1992), but only for Rs
under 0.4 (Boucher et al., 1997). At the top of the close to the mean global albedo, it appears in Fig. 6 that mnrc is always under 0.45 mm. This atmosphere, the dust forcing evolves with this
albedo from negative values over oceans to posi- difference is mainly due to the vertical distribution: with a dust cloud extending up 3600, the mnr
cis tive values over highly reflecting surfaces (e.g, ice
sheets or clouds). But the sign of the TOA forcing between 0.35 and 0.52 mm. One should also notice that a R
s=0.15 also corresponds to a ‘‘dark contin-also depends on the solar zenith angle (Weare
et al., 1974, Haywood and Shine,1995), and on ent’’ situation. In such a region, e.g in Asia, where data on the vertical distribution and on the dust the dust vertical distribution (Tegen and Lacis,
1996). Sokolik and Toon (1996) also noticed the mineralogy are sparse, it is therefore very difficult to determine the sign of the TOA dust forcing. importance of the ‘‘aerosol model’’ to determine
the sign of the forcing but did not separate the These experiments shows that the refractive index and the vertical distribution of the dust are the size distribution effect from the refractive index
effect. In Fig. 6, we compare the importance of all most sensitive parameters for the determination of a dust radiative effect.
these parameters and it appears that the refractive has a large impact on the sign of the TOA forcing independently from the mnr. Tegen and Lacis
(1996) found that the sign of the TOA forcing 6. Conclusion
changes for a critical mnr, hereafter mnr
c, equal to
0.54 mm (after conversion from the effective radius A sensitivity study on the net climate forcing by mineral dust in clear sky conditions has been to the mean number radius) for a dust cloud
between 0 and 3000 m. Their results are hardly developed with a single-column model to deter-mine how various parameters have to be taken comparable to ours since they use a modelled
distribution, nevertheless, if we focus on R
cases (desert and ocean) are assumed to account the dynamic response. Third, the knowledge of the mean radius of the size distribution is needed for a significant fraction of the variability found
to determine the amplitude of forcings when large over the North African-Atlantic region where
particles are involved. In contrast, assumptions globally most of the dust loading occurs. Both the
made for numerical treatments of the size distribu-short-wave and the long-wave contributions are
tion (‘‘bins’’, log-normal, gamma distribution) do studied, the latter being found to be never
negli-not introduce significant uncertainties in respect gible because of the large LW absorption of
to radiative calculations. desert dust.
The aim of our study was not to describe the We can summarise our conclusions in three
forcing on a global scale, but rather to document points: first, the refractive index appears to be a
two standard cases that are representative of dust critical parameter in determining a global effect
occurrence. For instance, above the ocean, net as expected from the study by Sokolik and Toon
radiative fluxes are reduced at the top of the (1996). The largest uncertainty comes from the
atmosphere and at the surface, leading to a global mineralogical variability of dust samples: in the
cooling. On the other hand above the desert, the desert case, between two realistic indices for
min-forcing exceeds frequently+ 24 to 28 W m−2 at eral dust, forcings exhibit a ±16% variation at
the top of the atmosphere with a high energy the TOA and±40% at the surface. This refractive
deposition in the aerosol layer, while the surface index has a large variability with the wavelength
gains energy because of the LW effect. This implies and averaging it brings large errors in radiative
that the boundary layer stability could be modified fluxes calculations. Since the mineralogy changes
by such a dust layer and underscores the possibil-with sources and during the transport, one of the
ity of a large local dynamical response. challenging problem for radiative calculations will
therefore be to model dynamically this complex
refractive index. Besides, index measurements are 7. Acknowledgement old and imprecise, reaching a 40% uncertainty.
This is responsible for a ±25% uncertainty in This work would not have been possible without the desert TOA radiative fluxes determination. the radiative code provided and explained by Secondly, the importance of the long-wave com- Jean-Jacques Morcrette. Our money support came ponent in the net forcing gives a large influence from the German-French cooperation fund to the vertical distribution of dust, and, to a PROCOPE, the EU-ENVIRONMENT AND smaller extend, to the vertical profile of temper- CLIMATE project SINDICATE (contract atures. As described by Tegen et Lacis (1996), this EV5V–CT92–122) and project MEDUSE (con-has a crucial effect of the sign of the TOA forcing, tract ENV4–CT95–0036) both supported by the but it also determines the amplitude of the energy European Commission (DG XII). This is the
LSCE contribution number 69. deposition inside the dust layer which may control
REFERENCES
Ackerman, S. and Chung, H. 1992. Radiative effect of Wang, M., Wong, J. and Yang, F. 1998. Intercompar-ison of models representing short-wave radiative for-airborne dust on regional energy budgets at the top
of the atmosphere. J. Appl. Meteo. 31, 223–233. cing by sulfate aerosols. J. Geophys. Res., in press. Cabot, F. 1995. Estimation de l’albe´do de surface a` l’e´ch-Boucher, O. and Anderson, T. L. 1995. GCM assessment
of the sensitivity of direct climate forcing by anthropo- elle globale a` l’aide de mesures satellitaires. The`se d’uni-versite´, Universite´ d’Orsay Paris Sud.
genic sulfate aerosols to aerosol size and chemistry.
J. Geophys. Res. 100, 26117–26134. Carlson, T. B. and Benjamin, S. G. 1980. Radiative heat-ing rates for Sahara dust. J. Atmos. Sci. 37, 193–213. Boucher, O., Schwartz, S. E., Ackerman, T. P., Anderson,
T. L., Bergstrom, B., Bonnel, B., Chy´lek, P., Dahlback, Cautenet, G., Legrand, M., Cautenet, S., Bonnel, B. and Brogniez, G. 1992. Thermal impact of Saharan dust A., Fouquart, Y., Fu, Q., Halthore, R. N., Haywood,
J. M., Iversen., T., Kato, S., Kinne, S., Kirkeva˚g, A., over land. Part I: simulation. J. Appl. Meteo. 31, 166–180.
Knapp, E., Lacis, A., Laszlo, I., Mishchenko, M. I.,
Nemesure, S., Ramaswamy, V., Roberts, D. L., Russel, Charlson, R. J., Schwartz, S. E., Hales, J. M., Cess, R. D., Coakley, J. A., Hansen, J. E. and Hofmann, D. J. 1992. P., Schlesinger, M. E., Stephens, G. L., Wagener, R.,
Climate forcing by anthropogenic aerosols. Science Mishchenko, M. I., Lacis, A. A., Carlson, B. E. and Travis, L. D. 1995. Non-sphericity of dust like tropo-255, 423–430.
Coakley, J. A., Cess, R. D. and Yurevich, F. B. 1983. The spheric aerosol. Implications for aerosol remote sens-ing and climate modellsens-ing. Geophys. Res. L ett. 22, effect of tropospheric aerosols on the Earth’s radiation
budget. A parameterization for climate models. 1077–1080.
Morcrette, J. J. 1989. T echnical memorandum 165: J. Atmos. Sci. 40, 116–138.
D’Almeida, G. A. 1987. On the variability of desert aero- Description of the radiation scheme in the ECMW F model. ECMWF, Reading, U.K.
sol radiative characteristics. J. Geophys. Res 92,
3017–3026. Moulin, C., Dulac, F., Lambert, C. E., Chazette, P., Jankowiak, I., Chatenet, B. and Lavenu, F. 1997. Long Dulac, F., Tanre´, D., Bergametti, G., Buat-Me´nard, P.,
Desbois, M. and Sutton, D. 1992. Assessment of the term daily monitoring of Saharan dust load over marine areas using meteosat ISCCP-B2 data (2). African airborne dust mass over the Western
Mediter-ranean Sea using Meteosat data. J. Geophys. Res. 97, Accuracy of the method and validation using sun photometers measurements. J. Geophys. Res. 102, 2489–2506.
Fouquart, Y. and Bonnel, B. 1980. Computations of solar 16959–16968.
Patterson, E. M. 1981. Optical properties of the crustal heating of the Earth’s atmosphere. A new
parameteriz-ation. Beitr. Phys. Atmos. 53, 35–62. aerosol. Relation to chemical and physical character-istics. J. Geophys. Res. 86, 3236–3236.
Fouquart, Y., Bonnel, B., Roquai, M. C., Santer, R. and
Cerf, A. 1987. Observations of Saharan aerosols. Payne, R. E. 1972. Albedo of the sea surface. J. Atmos. Sci. 29, 959–970.
Results of ECLATS field experiment. Part I. Optical
thicknesses and aerosol size distributions. J. Clim. Penner, J. E., Dickinson, R. E. and O’Neill, C. A. 1992. Effects of aerosol from biomass burning on the global Appli. Meteor. 26, 28–37.
Gomes, L., Bergametti, G., Coude´-Gaussen, G. and radiation budget. Science 256, 1432–1434. Riehl, H. 1954. T ropical meteorology. McGraw-Hill. Rognon, P. 1990. Submicron desert dusts. A
sandblast-ing process. J. Geophys. Res 95, 13929–13935. Schulz, M., Balkanski, Y., Dulac, F. and Guelle, W. 1998. Treatment of aerosol size distribution in a global trans-Grams, G. W., Blifford, I. H., Gillette, D. A. and Russel,
P. B. 1974. Complex index of refraction of airborne port model: validation with satellite-derived observa-tions for a Saharan dust episode. J. Geophys. Res. 103, soil particles. J. Appl. Meteo. 13, 459–471.
Hansen, J. E. and Travis, L. D. 1974. Light scattering in 10579–10592.
Schu¨tz, L. 1979. Sahara dust transport over the North planetary atmospheres. Space Sci. Rev. 16, 527–610.
Haywood, J. M. and Shine, K. P. 1995. The effect of Atlantic Ocean. Model calculations and measure-ments. In: Saharan dust, pp. 267–277. John Wiley. anthropogenic sulphate and soot aerosol on the
clear sky radiation budget. Geophys. Res. L ett. 22, Schu¨tz, L. 1980. Long range transport of desert dust with special emphasis on the sahara. Ann. N. Y. Acad. 603–606.
Husar, R. B., Prospero, J. M. and Stowe, J. M. 1997. Sci. 338, 15–20.
Schwartz, S. E. 1996. The whitehouse effect. Shortwave Characterization of the tropospheric aerosols over the
oceans with the NOAA Advanced Very High Radio- radiative forcing of climate by anthropogenic aerosols. An overview. J. Aer. Sci. 27, 359–382.
meter optcial thickness operational product. J.
Geo-phys. Res. 102, 16889–16910. Shettle, E. P. 1984. Optical and radiative properties of a desert aerosol model. In Proceedings of the Symposium IPCC1995. Summary for policymakers. Cambridge
Uni-versity Press. on Radiation in the atmosphere, edited by G. Fiocco, pp. 74–77. A. Deepak, Hampton, Va.
Ivlev, L. S. and Popova, S. I. 1973. The complex refractive
indices of substances in the atmospheric-aerosol dis- Sokolik, I., Andronova, A. and Johnson, T. C. 1993. Complex refractive index of atmospheric dust aerosols. persed phase. Izv. Atmosph. and Ocean. Phys. 10,
1034–1043. Atmos. Env. 27A, 2495–2502.
Sokolik, I. and Golitsyn, G. 1993. Investigation of optical Kiehl, J. T. and Briegleb, B. P. 1993. The relative role of
sulfate aerosols and greenhouse gases in climate for- and radiative properties of atmospheric dust aerosols. Atmos. Env. 27A, 2509–2517.
cing. Science 260, 311–314.
Legrand, M., Cautenet, G. and Buriez, J. C. 1992. Ther- Sokolik, I. N. and Toon, O. B. 1996. Direct radiative forcing by anthropogenic airborne mineral aerosol. mal impact of Saharan dust over land. Part II.
Application to satellite IR remote sensing. J. Appl. Nature 381, 681–683.
Sokolik, I. N., Toon, O. B. and Bergstro¨m, R. W. (1998). Met. 31, 181–193.
Levin, Z. and Lindberg, J. D. 1979. Size distribution, Modeling the radiative characteristics of airborne min-eral aerosols at infrared wavelength. J. Geophys. Res. chemical composition and optical properties of urban
and desert aerosols in Israel. J. Geophys. Res. 84, 103, 8813–8826.
Swap, R., Garstang, M., Greco, S., Talbot, R. and Gac, 6941–6950.
Linberg, J. D. and Gillepsie, J. B. 1977. Relationship J. Y. 1992. Sahara dust in the Amazon bassin. T ellus 44B, 133–149.
between particle size and imaginary refractive index
J. Y.1988. Radiative properties of desert aerosols by properties of the particles composing the martian dust storm of 1971–1972. Icarus 30, 663–696.
optical ground based measurements at solar
wave-lengths. J. Geophys. Res. 93, 14223–14231. Twomey, S. A., Piepgrass, M. and Wolfe, T. 1984. An assessment of the impact of pollution on global cloud Tegen, I. and Lacis, A. A. 1996. Modeling of particle size
distribution and its influence on the radiative proper- albedo. T ellus 36B, 243–249.
Volz, F. E. 1973. Infrared optical constants of ammonium ties of mineral dust aerosol. J. Geophys. Res. 101,
19237–19244. sulfate, Sahara dust, volcanic pumice and flyash. Appl. Optics 12, 564–568.
Tegen, I., Lacis, A. A. and Fung, I. 1996. The influence
of mineral aerosols from disturbed soils on the global Weare, B. C., Temkis, R. L. and Snell, F. M. 1974. Aerosol and climate: some further modifications. Science 186, radiation budget. Nature 380, 419–422.