HAL Id: hal-01858815
https://hal.univ-cotedazur.fr/hal-01858815
Submitted on 25 Sep 2018
HAL is a multi-disciplinary open access archive for the deposit and dissemination of sci-entific research documents, whether they are pub-lished or not. The documents may come from teaching and research institutions in France or abroad, or from public or private research centers.
L’archive ouverte pluridisciplinaire HAL, est destinée au dépôt et à la diffusion de documents scientifiques de niveau recherche, publiés ou non, émanant des établissements d’enseignement et de recherche français ou étrangers, des laboratoires publics ou privés.
Treadmill Sprinting under Heat Stress
Olivier Girard, Franck Brocherie, Jean-Benoît Morin, Sébastien Racinais,
Grégoire Millet, Julien Périard
To cite this version:
Olivier Girard, Franck Brocherie, Jean-Benoît Morin, Sébastien Racinais, Grégoire Millet, et al.. Mechanical Alterations Associated with Repeated Treadmill Sprinting under Heat Stress. PLoS ONE, Public Library of Science, 2017, 12 (2), �10.1371/journal.pone.0170679�. �hal-01858815�
Mechanical Alterations Associated with
Repeated Treadmill Sprinting under Heat
Stress
Olivier Girard1,2*, Franck Brocherie2,3, Jean-Benoit Morin4, Se´bastien Racinais1, Gre´goire P. Millet2, Julien D. Pe´riard1
1 Aspetar Orthopaedic and Sports Medicine Hospital, Athlete Health and Performance Research Centre,
Doha, Qatar, 2 ISSUL, Institute of Sports Sciences, University of Lausanne, Lausanne, Switzerland,
3 Laboratory Sport, Expertise and Performance (EA 7370), Research Department, French Institute of Sport
(INSEP), Paris, France, 4 Universite´ Coˆte d’Azur, LAMHESS, Nice, France *[email protected]
Abstract
Purpose
Examine the mechanical alterations associated with repeated treadmill sprinting performed in HOT (38˚C) and CON (25˚C) conditions.
Methods
Eleven recreationally active males performed a 30-min warm-up followed by three sets of five 5-s sprints with 25-s recovery and 3-min between sets in each environment. Constant-velocity running for 1-min at 10 and 20 km.h-1was also performed prior to and following sprinting.
Results
Mean skin (37.2±0.7 vs. 32.7±0.8˚C; P<0.001) and core (38.9±0.2 vs. 38.8±0.3˚C; P<0.05) temperatures, together with thermal comfort (P<0.001) were higher following repeated sprinting in HOT vs. CON. Step frequency and vertical stiffness were lower (-2.6±1.6% and -5.5±5.5%; both P<0.001) and contact time (+3.2±2.4%; P<0.01) higher in HOT for the mean of sets 1–3 compared to CON. Running distance per sprint decreased from set 1 to 3 (-7.0±6.4%; P<0.001), with a tendency for shorter distance covered in HOT vs. CON (-2.7
±3.4%; P = 0.06). Mean vertical (-2.6±5.5%; P<0.01), horizontal (-9.1±4.4%; P<0.001) and resultant ground reaction forces (-3.0±2.8%; P<0.01) along with vertical stiffness (-12.9
±2.3%; P<0.001) and leg stiffness (-8.4±2.7%; P<0.01) decreased from set 1 to 3, indepen-dently of conditions. Propulsive power decreased from set 1 to 3 (-16.9±2.4%; P<0.001), with lower propulsive power values in set 2 (-6.6%; P<0.05) in HOT vs. CON. No changes in constant-velocity running patterns occurred between conditions, or from pre-to-post repeated-sprint exercise. a1111111111 a1111111111 a1111111111 a1111111111 a1111111111 OPEN ACCESS
Citation: Girard O, Brocherie F, Morin J-B, Racinais
S, Millet GP, Pe´riard JD (2017) Mechanical Alterations Associated with Repeated Treadmill Sprinting under Heat Stress. PLoS ONE 12(2): e0170679. doi:10.1371/journal.pone.0170679
Editor:Øyvind Sandbakk, Norwegian University of Science and Technology, NORWAY
Received: August 22, 2016 Accepted: January 9, 2017 Published: February 1, 2017
Copyright:© 2017 Girard et al. This is an open access article distributed under the terms of the Creative Commons Attribution License, which permits unrestricted use, distribution, and reproduction in any medium, provided the original author and source are credited.
Data Availability Statement: The data are
restricted, as per the Ethics approval from this study by the Shafallah Medical Genetics Center Ethics committee. Requests for the data may be sent to Olivier Girard ([email protected]).
Funding: This project was funded by QNRF (NPRP
4 – 760 – 3 – 217) and Aspire Zone Foundation Research Grant (AF/C/ASP1905/11). The funder had no role in study design, data collection and analysis, decision to publish, or preparation of the manuscript.
Conclusions
Thermal strain alters step frequency and vertical stiffness during repeated sprinting; how-ever without exacerbating mechanical alterations. The absence of changes in constant-velocity running patterns suggests a strong link between fatigue-induced constant-velocity decre-ments during sprinting and mechanical alterations.
Introduction
Accelerating over short distances is crucial in many team sports, where short-duration efforts (e.g., accelerated runs over 10–30 m or 3–5 s) are commonplace [1]. This is in turn associated with important moments in a game, such as gaining an advantage over an opponent or creat-ing scorcreat-ing opportunities. Durcreat-ing football match play for instance, a straight sprint is most often observed prior to a goal being scored [2]. The ability to maintain sprint performance as maximal or ‘all out’ efforts are repeated (i.e., repeated-sprint ability) during a game is thereby
crucial for athletes engaged in these disciplines.
An instrumented treadmill modified for sprint use, which allows athletes to run and freely dictate velocity (i.e., with no predetermined belt velocity imposed), is now available for the
measurement of both valid [3,4] and reproducible [5] tri-dimensional ground reaction forces during each step of a sprint run. Continuous measurement of the kinetics/kinematics and cal-culation of spring-mass model characteristics have been performed using this treadmill to elu-cidate some of the biomechanical correlates of fatigue when sprinting repeatedly in temperate conditions [6–8]. These studies demonstrated an increase in contact time along with reduc-tions in step frequency and vertical stiffness during a single series of repeated running sprints.
However, single-set repeated-sprint exercise (RSE) may not adequately reflect the complex match activity patterns observed in team sports. Consequently, the use of multiple-set RSE has recently been introduced in the repeated-sprint ability literature and shown to more accurately reflect the most intense phases of a game [8,9]. Utilizing this multiple-set RSE approach, Morin et al. [8] reported that all the mechanical variables reflecting force production and the effectiveness of force application progressively deteriorated across sets. That said, it is difficult to ascertain to which extent RSE-related alterations in running mechanics such as an increase in contact time, decrease in step frequency and vertical stiffness [6,8], result from the fatigue induced by running, or via changes in performance (i.e., mean running velocity and/or
pro-pulsive power). For example, in fresh or unfatigued conditions, increases and decreases in run-ning velocity are accompanied by modifications in stride kinetics/kinematics and in spring-mass parameters [10,11]. As such, identifying the intrinsic effect of RSE-induced fatigue on mechanical alterations also requires pre-to-post assessments to be conducted at similar con-stant velocities.
When exercising under heat stress, there is compelling evidence to suggest that elevations in whole-body temperature increase cardiovascular strain [12,13] and alter neuromuscular function [14,15], thus hampering repeated-sprint exercise (RSE) performance (for review see [16]). Although the influence of heat stress on performance during RSE has been explored in cycling [17,18], there appears to be a paucity of data describing the alterations in running mechanics when sprinting repeatedly in a hot environment. Moreover, whether an accentu-ated thermal strain exerts a negative impact on stride kinematics and spring-mass parameters during constant-velocity running performed prior to and following multiple-set RSE remains to be determined.
Competing Interests: The authors have declared
Therefore, the aim of this study was to comprehensively investigate the effect of heat stress on i) fatigue-induced changes in performance and the associated alterations in running mechanics during multiple-set RSE and ii) on constant-velocity running mechanics and spring-mass behaviour after multiple-set RSE. This was accomplished by measuring tri-dimen-sional ground reaction forces with the use of a modified instrumented sprint treadmill. It was hypothesized that the development of thermal strain (i.e., elevated core and skin temperatures)
under heat stress would exacerbate the magnitude of stride mechanical alterations (both dur-ing sprintdur-ing and runndur-ing at constant velocity), due to the multiple-set nature of the RSE.
Methods
Participants
Fourteen male volunteers (mean±SD age, 31.3±4.5 years; stature, 176.2±4.7 cm; body weight, 74.5±8.5 kg) who were recreationally active (4.8±2.7 h.wk-1) in intermittent sports (i.e.,
foot-ball, futsal, tennis, squash) took part in the study. All participants were free of musculoskeletal pain or injuries. In the 6 months preceding the study, their training included activity-specific (i.e., technical and tactical skills), aerobic (i.e., continuous and intermittent) and anaerobic
(i.e., strength, sprints, change of direction) exercise sessions. Participants were also asked to
avoid strenuous exercise in the 48 h preceding their visits to the laboratory, as well as refrain from caffeine for 12 h and alcohol for 24 h. Although the study took place in Qatar, the partici-pants were not accustomed to sprinting in the heat, as the study was conducted in the winter (mean ambient temperature of 20–25˚C). Participants wore standardized personal athletic training attire (T-shirt, shorts, socks, and running shoes). Written informed consent was obtained from all participants. The study was approved by theShafallah Medical Genetics Cen-ter Ethics committee (IRB Project Number 2011–011) and conducted according to the
Decla-ration of Helsinki.
Protocol overview
Familiarization. Approximately 1 week prior to testing, participants completed a
pre-experi-mental session in temperate conditions including habituation runs of ~30 s at 10 and 20 km.h-1, followed by short (<5 s) familiarization treadmill sprints at increasing velocities with full recov-ery, until feeling comfortable with the running technique expected (this generally required 7–10 sprints). Then, they performed three maximal 5-s sprints, separated by 2 min of passive rest. All participants satisfied the criteria of having a coefficient of variation <2.2% for distance covered across three successive trials [5]. After 10 min of rest, they completed the RSE protocol in full (seeExperimental trials). Strong verbal encouragement was given during all maximal efforts.
Experimental trials. Participants performed a multiple-set RSE protocol composed of
three sets of five 5-s sprints with 25 s of passive rest between sprints and 3 min between sets in HOT (37.6±2.3˚C; 21.4±3.1% relative humidity) and CON (24.9±0.6˚C; 45.3±7.8% relative humidity) conditions. The trials were conducted in a randomized order at the same time of day (±1h) and separated by at least 4 days. Upon arrival to the laboratory, participants were instrumented for physiological measurements (seeResponses to exercise). Thereafter,
partici-pants performed a standardized ~30 min warm-up on the instrumented treadmill, which included 10 min of running (10 km.h-1), 15 min of athletic drills (skipping, high heels and butt-kicks), 3× short burst accelerations (subjective “sense of effort” of 7, 8 and 9 over 10) [19], 2× 3-s sprints (“sense of effort” of 8 and 9 over 10), and finally 3 × 5-s maximal sprints separated by 2 min of passive rest. The best of these three maximal sprints (greatest distance covered in 5 s) was used as the criterion score for the subsequent series to ascertain that no pacing occurred (SeeData analyses). Afterwards, participants were required to perform 1-min
runs at 10 km.h-1then at 20 km.h-1including an evaluation of stride mechanical patterns (see below). They were then allowed 5 min to rest in a standing position prior to undertaking the RSE protocol. Lastly, 3 min after the termination of RSE protocol, participants repeated the 10 and 20 km.h-1runs whereby stride mechanical patterns were re-evaluated. The delay was nec-essary to allow sufficient recovery for successful completion of both the low and high velocity runs post-RSE, as well as a comparison to previous data [20]. Exposure to HOT conditions before commencement of the RSE protocol was ~40 min. The total duration of the testing session (i.e., from the beginning of the warm-up until the submaximal runs following the
repeated-sprint ability test) was ~1 h and conducted in each respective environmental condition.
Instrumented sprint treadmill. All running was performed on an instrumented sprint
treadmill (ADAL3D-WR, Medical Development–HEF Tecmachine, Andre´zieux-Bouthe´on, France). Briefly, it is mounted on a highly rigid metal frame fixed to the ground through four piezoelectric force transducers (KI 9077b; Kistler, Winterthur, Switzerland) and installed on a specially engineered concrete slab to ensure maximal rigidity of the supporting ground. This motorized treadmill allows participants to sprint due to the use of constant motor torque [3,5]. The motor torque, set to 160% of the default torque necessary to overcome the friction on the belt due to participant’s body weight [3], allows participants to sprint in a comfortable manner and produce their maximal effort without risking loss of balance.
A belt attached to a stiff rope (1 cm in diameter, ~2 m in length) was used to tether subjects to the 0.4-m vertical rail anchored to the wall behind them. An additional overhead safety har-ness with sufficient slack not to impede natural running mechanics was fastened to the partici-pants to support them in the event of a fall. When correctly attached, participartici-pants could lean forward in a typical crouched sprint-start position with their left foot forward. This starting position was standardized and used in all sprint efforts. Following a 5-s verbal and visual countdown, the treadmill was released and the belt began to accelerate as participants applied a positive (i.e., propulsive) horizontal force.
Mechanical variables. Data were continuously sampled at 1000 Hz. After appropriate
fil-tering (Butterworth-type 30 Hz low-pass filter; Adirun, Tecmachine, Andre´zieux-Bouthe´on, France), instantaneous vertical, net horizontal and total (i.e., resultant) ground reaction forces
were averaged for each support phase (vertical force above 30 N) over the 5-s sprints and the 1-min runs at low (i.e., 10 km.h-1) and high (i.e., 20 km.h-1) constant velocities, and expressed in units of the body’s weight (BW). These data were completed by measurements of the main step kinematic variables: contact time (s), aerial time (s), swing time (s), step frequency (Hz) and step length (m). Lastly, for each 5-s sprint, horizontal forces were used with the corre-sponding average belt velocity to compute net power output in the horizontal direction (pro-pulsive power = horizontal force× running velocity, W.kg−1).
A linear spring-mass model of running was used to investigate the main mechanical parameters characterizing the lower limb behavior during running [21,22]. Vertical stiffness (kN.m-1) was calculated as the ratio of peak vertical forces (N) to the maximal vertical down-ward displacement of center of mass (m), which was determined by double integration of ver-tical acceleration of center of mass over time during ground contact. Leg stiffness (kN.m-1) was calculated as the ratio of peak vertical forces to the maximum leg spring compression [maximal vertical downward displacement + L0
-p
L02–(0.5× running velocity × contact
time)2, m], both occurring at mid-stance. Initial leg length (L0, great trochanter to ground
dis-tance in a standing position) was determined from participant’s stature as L0= 0.53× stature
[23]. During the 1-min runs, vertical mean loading rate was calculated as the mean value of the time-derivate of vertical force signal within the first 50 ms of the support phase, and expressed in body weight.s-1.
Responses to exercise. Hydration and temperature measurements. Upon arrival on
testing days, participants provided a urine sample for the measurement of urine specific grav-ity (Pal-10-S, Vitech Scientific Ltd. West Sussex, UK). A telemetric temperature pill (Vital-Sense1, Mini Mitter, Respironics, Herrsching, Germany) used to monitor core temperature was then inserted the length of a gloved index finger beyond the anal sphincter. Skin tempera-tures of the chest, upper arm, thigh and lower leg were monitored via temperature monitor/ data loggers (iButtons, maxim integrated, USA) and used to calculate mean skin temperature with the weighted coefficient proposed by Ramanathan [24]: chest 30%, upper arm 30%, thigh 20%, and lower leg 20%. All temperatures were recorded at 1 min intervals. Participants were permitted to drink water (20–22˚C)ad libitum during the trials. Body weight changes,
cor-rected for fluid ingested and sweat trapped in clothing, were evaluated at the conclusion of each trial.
Physiological and perceptual measurements. Heart rate was monitored telemetrically
with a Polar transmitter-receiver (T-31; Polar Electro, Lake Success, NY, USA) and recorded every 5 s. Thermal comfort [25] scores were recorded on a seven-point scale, and ratings of perceived exertion (RPE) on the Borg 6–20 scale [26] exactly 10 s after each sprint. A capillary blood sample was taken from the fingertip and analyzed for blood lactate concentration with the Lactate Pro (LT-1710, Arkray, Japan) portable analyzer at baseline, after warm-up and at end-exercise (~2 min post-RSE).
Data analyses
To prevent pacing effects occurring during the RSE protocol, participants were required to achieve at least 95% of their criterion score (determined at the end of the warm-up procedure) during the first sprint of the multiple-set RSE for each testing session. The 95% criterion score was satisfied for 11 out of 14 participants in both conditions [mean±SD (range): 96.7±2.8% (96.7–101.9%) and 101.2±3.2% (96.5–108.4%) in HOT and CON, respectively]. The three participants that covered a distance below 95% of that measured during the reference sprints (i.e., criterion score range: 82.2–94.1%) were removed from our original participants sample
(n = 14), which finally included a total of 11 participants. Mechanical data consisted of the con-tinuous (step-by-step) measurement of running kinetics and kinematics for each sprint, which were averaged for each set for further analysis. Physiological and perceptual responses to exer-cise were also averaged across each set. During the 1-min constant-velocity runs, mechanical data for all steps collected over a 20-s sampling period (i.e., 38 to 58 s) were averaged for
subse-quent analysis [27].
Statistical analysis
Two-way repeated-measures analysis of variance (ANOVA) [Time (Baseline, Set 1, Set 2 and Set 3 or Baseline, Pre-RSE and Post-RSE)× Condition (HOT and CON)] were used to com-pare running thermal, physiological and perceptual responses. Two-way repeated-measures analysis of variance (ANOVA) [Time (Set 1, Set 2 and Set 3)× Condition (HOT and CON)] were used to compare running performance and mechanical data during sprinting. For low and high constant-velocity running, separate two-way repeated-measures of variance [Time (Pre-RSE and Post-RSE)× Condition (HOT and CON)] were used to compare mechanical data. Mauchly’s tests of sphericity were performed to assess assumptions of variance, and a Greenhouse-Geisser correction was performed to adjust the degree of freedom when applica-ble. Bonferroni post-hoc multiple comparisons were performed in case of significant main effects. Partial eta-squared were calculated as a measure of effect size (indicated in the Tables were applicable), with values of 0.01, 0.06 and >0.14 considered as small, medium and large,
respectively [28]. All statistical calculations were performed using SPSS statistical software V.21.0 (IBM Corp., Armonk, NY, USA). The significance level was set at P<0.05. Values are expressed as means±SD.
Results
Hydration and temperature responses
Pre-exercise urine specific gravity was similar between HOT (1.012±0.009) and CON (1.015± 0.009). A greater volume of water was consumed during HOT (795±399 ml.hr-1)vs. CON
(418±252 ml.hr-1
; P<0.001). From Pre- to Post-RSE, percent body weight loss was larger in HOT (-0.7±0.4%) vs. CON (-0.5±0.3%; P<0.05). Mean skin (37.2±0.7 vs. 32.7±0.8˚C; P<0.001) and core (38.93±0.20 vs. 38.77±0.31˚C; P<0.05) temperatures were higher and the core-to-skin temperature gradient narrower (1.49±0.76 vs. 5.94±0.91˚C; P<0.001) following RSE in HOT than in CON (Fig 1).
Physiological and perceptual responses
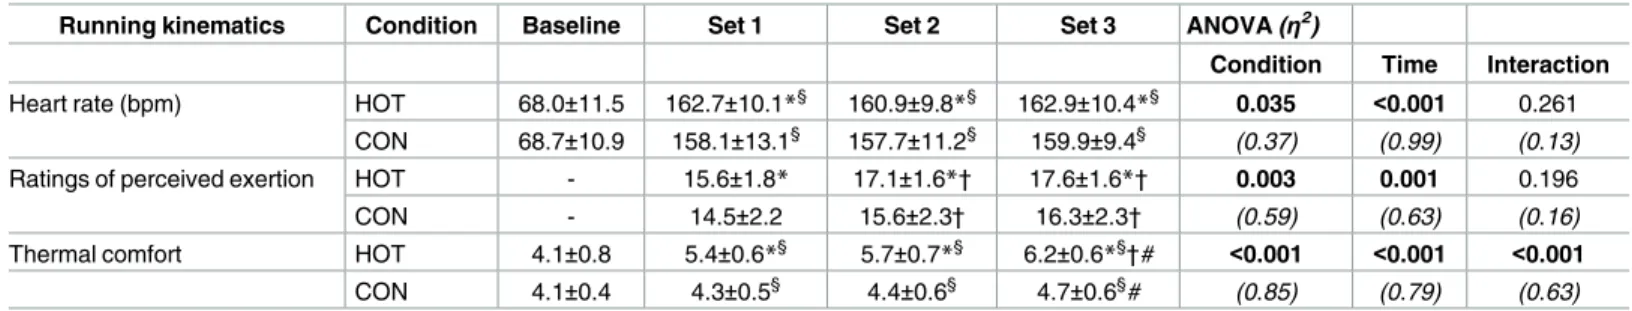
Heart rate, ratings of perceived exertion and thermal comfort data are presented inTable 1. Blood lactate concentration increases from baseline to Pre and Post-RSE were lower in HOT (1.5±0.3 to 5.9±2.2 and 11.4±2.9 mmol.L-1) compared to CON (1.7±0.4 to 7.2±2.5 and 13.3 ±2.7 mmol.L-1) (P<0.05).
Sprint mechanical data
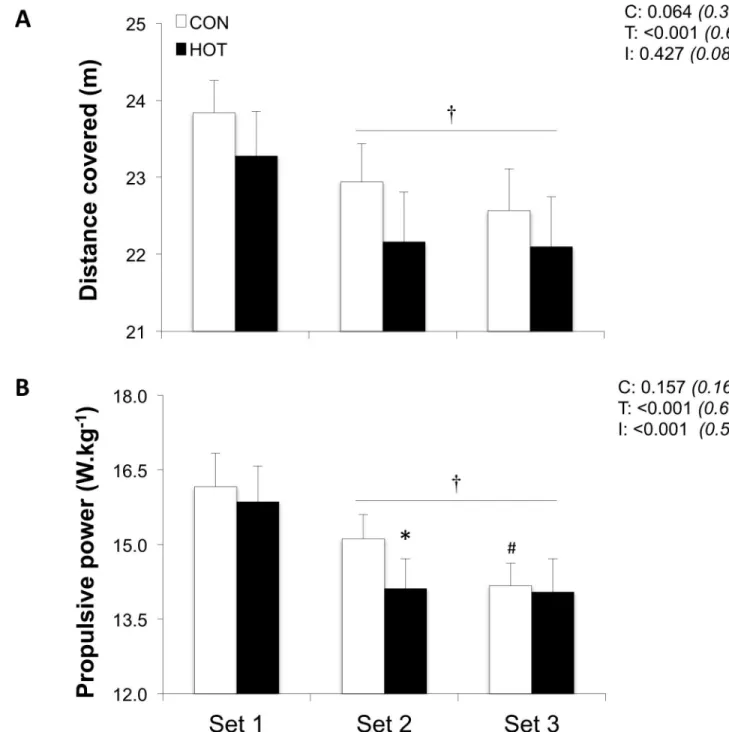
Distance covered (pooled condition values: -4.3±3.3% and -7.0±6.4%; P<0.001) decreased in sets 2 and 3 relative to set 1, with also a tendency for shorter distance covered (-2.7±3.4% for the average of sets 1–3) in HOTvs. CON (P = 0.06;Fig 2).
When pooling the two environmental conditions, average horizontal forces decreased by -5.2±1.2% and -9.1±3.0% in sets 2 and 3 respectively, relative to set 1 (both P<0.01;Fig 3). Aver-age vertical and total forces also decreased from set 1 to set 3 (-2.6±5.5% and -3.0±2.8%, respec-tively, both P<0.05). Propulsive power (-6.0±1.2% and -16.9±2.4%; P<0.001) decreased in sets 2 and 3 relative to set 1 (Fig 2). There was a significant time× condition interaction for propul-sive power (P<0.001): lower values were observed in set 2 in HOTvs. CON (-6.6%; P<0.05)
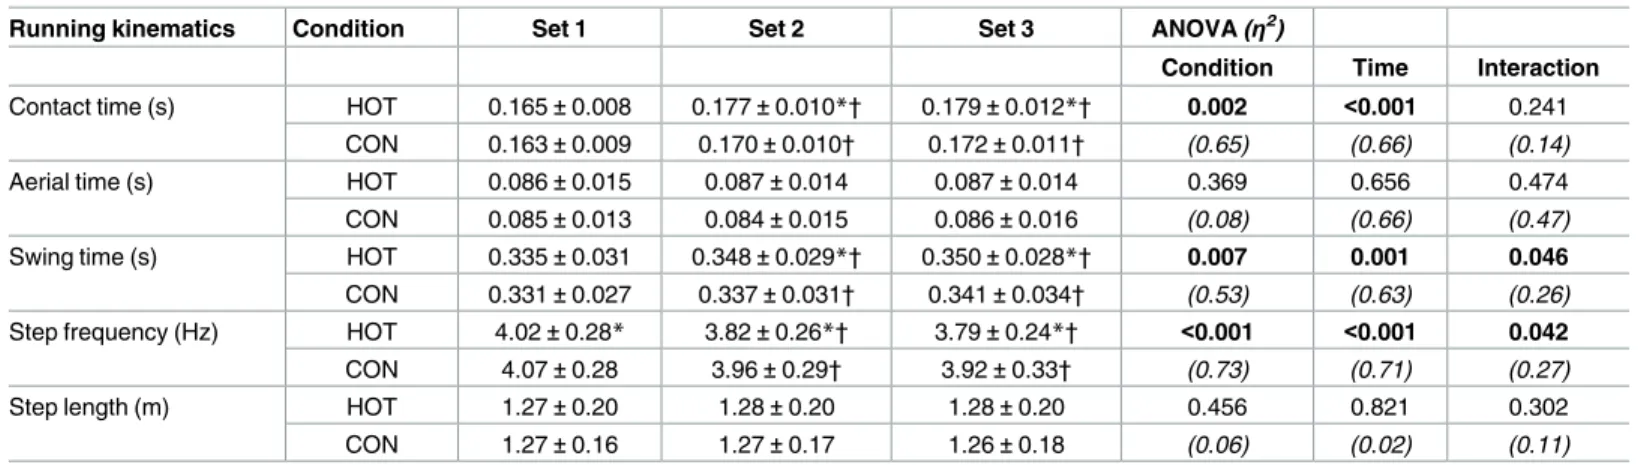
Contact time increased in sets 2 (+5.9±0.8%) and 3 (+9.6±1.6%) relative to set 1 (P<0.001), with higher mean values in HOT (+3.2±2.4%) across sets 1–3 (P<0.01) (Table 2). Step fre-quency decreased from set 1 to set 2 in both the HOT (4.8±3.8%; P<0.001) and CON (2.7 ±1.5%; P<0.01) conditions. Compared to CON, step frequencies were 2.6±1.6% (P<0.001) lower in HOT for the average of sets 1–3.
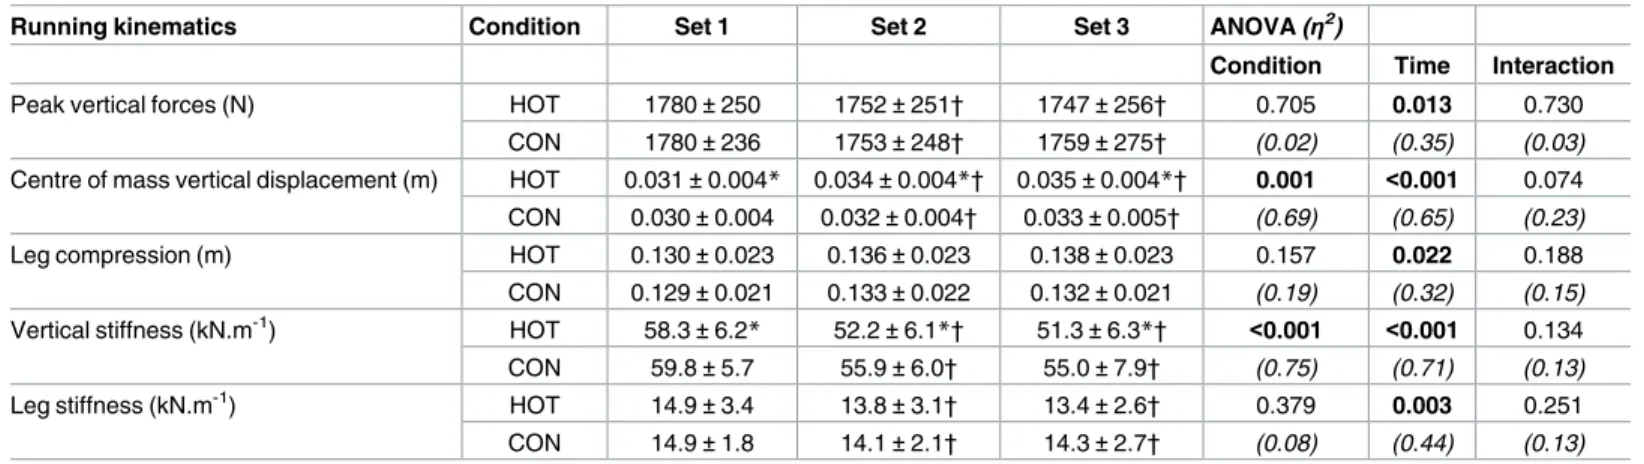
Changes in spring-mass characteristics are displayed inTable 3. Independently of the con-dition, significant changes occurred from set 1 to set 3 in spring-mass characteristics with lower peak vertical forces (-2.5±3.5%), higher maximal center of mass vertical displacement (+12.9±10.5%) and leg compression (+6.5±0.6%), resulting in decreased vertical (-12.9±2.3%) and leg (-8.4±2.7%) stiffness values (all P<0.05). Maximal center of mass vertical displacement (-5.1±3.3%) and vertical stiffness (-5.5±5.5%) values for the average of sets 1–3 were lower in HOTvs. CON (P<0.001). No significant interaction effect was found for any spring-mass
model parameter.
Constant-velocity runs
Completion of the RSE did not induce any changes in constant-velocity running pattern, be it at low (10 km.h-1;Table 4) or high (20 km.h-1;Table 5) velocity, except for step frequency over
time (P = 0.047,η2= 0.34) and between conditions (P = 0.021,η2= 0.43), as well as step length between conditions (P = 0.018,η2= 45). No interaction effect was found for any mechanical parameter.
Discussion
Although there is compelling evidence to suggest that compared to temperate conditions, larger performance decrements occur when repeated sprints are undertaken in hot environ-ments due to the development of hyperthermia [16], the mechanical causes underlying these decrements are not completely understood. In the current study, the nature and the extent of fatigue-induced alterations in running mechanics during multiple-set RSE performed with and without environmental heat stress were examined for the first time. The major findings are that greater thermal (i.e., core and skin temperature) and perceptual strain during RSE
under heat stress is associated with decrements in propulsive power, step frequency and verti-cal stiffness, along with longer contact time; however, running mechaniverti-cal alterations induced by sprint repetitions were in general not more pronounced in hot compared with cooler ambi-ent conditions. Furthermore, low and high constant-velocity running patterns displayed no pre-to-post RSE changes in either condition.
Performance outcomes, physiological and perceptual responses
Compared to temperate environmental test settings, the detrimental effects of ambient tem-peratures >30˚C on repeated-sprint ability are solely observed when exercise induces marked hyperthermia with core temperature exceeding 39˚C [16]. Indeed, in hot (40˚C)vs. temperate
(20˚C) conditions, the ability to produce power during five maximal 15-s sprints (rest = 15 s) was impaired when core (39.5˚C) and muscle (40.2˚C) temperatures were elevated following the completion of a 40 min submaximal intermittent sprint protocol in the heat [17]. The authors also noted that the added thermal strain imposed by the environment exacerbated the heart rate and RPE responses. In the present study (i.e., running mode and core temperature
Fig 1. Core temperature (A), skin temperature (B) and core-to-skin temperature gradient (C) at baseline, before (Pre-RSE) and after (Post-RSE) the repeated-sprint exercise in HOT and CON conditions. Values are
mean±SD (n = 11). C, T, and I respectively refer to ANOVA main effects of condition, time, and interaction between these two factors with P-value and partial eta-squared in parentheses.*significantly different from CON, P<0.05.§ significantly different from Baseline, P<0.05. # significantly different from Pre-RSE, P<0.05.
doi:10.1371/journal.pone.0170679.g001
Table 1. Physiological and perceptual responses for each of the three sets of the repeated-sprint exercise protocol in HOT and CON conditions. Running kinematics Condition Baseline Set 1 Set 2 Set 3 ANOVA (η2)
Condition Time Interaction
Heart rate (bpm) HOT 68.0±11.5 162.7±10.1*§
160.9±9.8*§
162.9±10.4*§
0.035 <0.001 0.261
CON 68.7±10.9 158.1±13.1§ 157.7±11.2§ 159.9±9.4§ (0.37) (0.99) (0.13)
Ratings of perceived exertion HOT - 15.6±1.8* 17.1±1.6*† 17.6±1.6*† 0.003 0.001 0.196
CON - 14.5±2.2 15.6±2.3† 16.3±2.3† (0.59) (0.63) (0.16)
Thermal comfort HOT 4.1±0.8 5.4±0.6*§
5.7±0.7*§
6.2±0.6*§
†# <0.001 <0.001 <0.001
CON 4.1±0.4 4.3±0.5§ 4.4±0.6§ 4.7±0.6§# (0.85) (0.79) (0.63)
Values are mean±SD (n = 11).η2
, partial eta-squared values. *significantly different from CON, P<0.05
§
significantly different from Baseline, P<0.05 † significantly different from Set 1, P<0.05 # significantly different from Set 2, P<0.05. doi:10.1371/journal.pone.0170679.t001
below 39˚C), performance decreased as fatigue developed, with systematically lower distances covered, along with lower propulsive power values in HOT (mainly during set 2) (Fig 2). It was further observed that RSE was associated with elevated cardiovascular load (i.e., heart rate)
and RPE in HOTvs. CON (Table 1). For repeated cycling sprints performed under heat stress (24vs. 35˚C) with a modest elevation in core temperature of ~0.5˚C, participants experienced
similar increases in heart rate and RPE, and were able to overcome the thermal sensations Fig 2. Distance covered (A) and propulsive power (B) for each of the three sets of the repeated-sprint exercise in HOT and CON conditions. Values are mean±SD (n = 11). C, T, and I respectively refer to ANOVA main effects of condition, time, and interaction between these two factors with P-value and partial eta-squared in parentheses.*significantly different from CON, P<0.05. † significantly different from Set 1, P<0.05. # significantly different from Set 2, P<0.05.
linked to the hot environment and to improve repeated-sprint ability [18]. In our study, greater levels of thermal strain, along with elevated cardiovascular and perceptual loads, accompanied the decrement in indices of repeated-sprint performance in the heat.
Another interesting observation is that most of the sprint mechanical alterations occurred between the first two sets, and notably when participants were exposed to heat stress. As a con-sequence of the narrow core-to-skin temperature gradient occurring in the HOT condition, it is likely that skin blood flow increased in order to meet the added requirement for heat dissipa-tion [12]. Interestingly however, thermal comfort did not differ between set 1 and set 2 in either condition, with a larger heat-induced increase in thermal strain only observed during set 3. Contrastingly, completion of multiple-set RSE in temperate conditions has been associ-ated with performance decrements during set 3 (but not 2) in reference to set 1 [9]. Because the nature of RSE (i.e., sprint duration, type of recovery, number of sprint repetitions), training
status of participants and environmental conditions in which it is undertaken vary between studies, comparisons can only remain speculative. In line with the current findings however, was the observation of Serpiello et al. [9] that the reduction from set 1 to set 3 was two-to-three fold larger in powervs. velocity indices. In examining intra-session and inter-session
reliabil-ity, it was recently recommended that the preferred indices to readily detect the smallest worthwhile changes in treadmill sprint performance should be the distance covered and the propulsive power [9]. This, along with the fact that only propulsive power displayed an interac-tion effect, reinforces the nointerac-tion that mechanical parameters reflecting accelerainterac-tion are the preferred variables to assess treadmill sprint performance.
Sprint mechanical data
Given the short duration of the majority of sprints (<5 s) during team-sport competitions, a key physical attribute of many of these athletes is the ability to repeatedly accelerate to high Fig 3. Average horizontal (A), vertical (B) and total (C) ground reaction forces for each of the three sets of the repeated-sprint exercise in HOT and CON conditions. Values are mean±SD (n = 11). C, T, and I respectively refer to ANOVA main effects of condition, time, and interaction between these two factors with P-value and partial eta-squared in parentheses. Forces are expressed in units of the body’s weight (BW).*significantly different from CON, P<0.05.
doi:10.1371/journal.pone.0170679.g003
Table 2. Running kinematics for each of the three sets of the repeated-sprint exercise protocol in HOT and CON conditions. Running kinematics Condition Set 1 Set 2 Set 3 ANOVA (η2)
Condition Time Interaction
Contact time (s) HOT 0.165±0.008 0.177±0.010*† 0.179±0.012*† 0.002 <0.001 0.241
CON 0.163±0.009 0.170±0.010† 0.172±0.011† (0.65) (0.66) (0.14)
Aerial time (s) HOT 0.086±0.015 0.087±0.014 0.087±0.014 0.369 0.656 0.474
CON 0.085±0.013 0.084±0.015 0.086±0.016 (0.08) (0.66) (0.47)
Swing time (s) HOT 0.335±0.031 0.348±0.029*† 0.350±0.028*† 0.007 0.001 0.046
CON 0.331±0.027 0.337±0.031† 0.341±0.034† (0.53) (0.63) (0.26)
Step frequency (Hz) HOT 4.02±0.28* 3.82±0.26*† 3.79±0.24*† <0.001 <0.001 0.042
CON 4.07±0.28 3.96±0.29† 3.92±0.33† (0.73) (0.71) (0.27)
Step length (m) HOT 1.27±0.20 1.28±0.20 1.28±0.20 0.456 0.821 0.302
CON 1.27±0.16 1.27±0.17 1.26±0.18 (0.06) (0.02) (0.11)
Values are mean±SD (n = 11).η2, partial eta-squared values. *significantly different from CON, P<0.05.
† significantly different from Set 1, P<0.05. doi:10.1371/journal.pone.0170679.t002
velocities [29]. Although vertical force production has been linked to the ability to achieve high maximal running velocities in humans (e.g., [30]), horizontal forces and the associated forward orientation of resultant ground reaction force vectors have recently been put forward Table 3. Spring-mass model parameters for each of the three sets of the repeated-sprint exercise protocol in HOT and CON conditions.
Running kinematics Condition Set 1 Set 2 Set 3 ANOVA (η2 )
Condition Time Interaction
Peak vertical forces (N) HOT 1780±250 1752±251† 1747±256† 0.705 0.013 0.730
CON 1780±236 1753±248† 1759±275† (0.02) (0.35) (0.03)
Centre of mass vertical displacement (m) HOT 0.031±0.004* 0.034±0.004*† 0.035±0.004*† 0.001 <0.001 0.074
CON 0.030±0.004 0.032±0.004† 0.033±0.005† (0.69) (0.65) (0.23)
Leg compression (m) HOT 0.130±0.023 0.136±0.023 0.138±0.023 0.157 0.022 0.188
CON 0.129±0.021 0.133±0.022 0.132±0.021 (0.19) (0.32) (0.15)
Vertical stiffness (kN.m-1) HOT 58.3±6.2* 52.2±6.1*† 51.3±6.3*† <0.001 <0.001 0.134
CON 59.8±5.7 55.9±6.0† 55.0±7.9† (0.75) (0.71) (0.13)
Leg stiffness (kN.m-1) HOT 14.9±3.4 13.8±3.1† 13.4±2.6† 0.379 0.003 0.251
CON 14.9±1.8 14.1±2.1† 14.3±2.7† (0.08) (0.44) (0.13)
Values are mean±SD (n = 11).η2, partial eta-squared values. *significantly different from CON, P<0.05.
† significantly different from Set 1, P<0.05. doi:10.1371/journal.pone.0170679.t003
Table 4. Constant low (10 km.h-1) velocity running kinematics and spring-mass variables prior to (PRE-RSE) and after (POST-RSE) the multi-set repeated-sprint exercise (RSE) in HOT and CON conditions.
PRE-RSE POST-RSE ANOVA (η2)
HOT CON HOT CON Condition Time Interaction
Running kinematics Contact time (s) 0.266±0.017 0.264±0.019 0.267±0.016 0.263±0.016 0.115 0.950 0.358 (0.23) (0.01) (0.09) Aerial time (s) 0.105±0.023 0.103±0.022 0.098±0.018 0.100±0.018 0.966 0.105 0.305 (0.01) (0.24) (0.11) Step frequency (Hz) 2.70±0.12 2.73±0.11 2.75±0.10 2.76±0.10 0.021 0.047 0.524 (0.43) (0.34) (0.52) Step length (m) 1.03±0.05 1.02±0.04 1.01±0.04 1.01±0.04 0.018 0.076 0.588 (0.45) (0.28) (0.03)
Spring-mass model parameters
Peak vertical forces (N) 1844±169 1832±176 1811±170 1816±192 0.687 0.261 0.352
(0.02) (0.12) (0.09)
Centre of mass vertical displacement (m) 0.064±0.006 0.063±0.006 0.062±0.006 0.061±0.006 0.279 0.079 0.637
(0.12) (0.28) (0.02) Leg compression (m) 0.109±0.007 0.107±0.008 0.107±0.007 0.104±0.008 0.143 0.100 0.744 (0.20) (0.25) (0.01) Vertical stiffness (kN.m-1) 28.8±2.4 29.4±2.0 29.5±2.5 30.1±1.9 0.251 0.061 0.963 (0.13) (0.30) (0.01) Leg stiffness (kN.m-1) 17.0±1.4 17.2±1.3 17.0±1.3 17.5±1.4 0.142 0.507 0.489 (0.20) (0.05) (0.05) Impact characteristics
Mean loading rate (BW.s-1) 44.8±10.5 44.4±9.8 44.1±9.2 44.7±9.5 0.913 0.864 0.433
(0.01) (0.01) (0.06)
as major determinants of acceleration during running. For example, i) increasing running velocity from moderate (~40% of maximal running velocity) to “all-out” sprinting is more dependent on increments in horizontal than on vertical force production [11,31]; ii) at 8 m [32] and 16 m [33] from the start, applying ground reaction impulse in a more horizontal direction explains 44% and 61% of the variance of running velocity, respectively; and iii) the effectiveness of total forward direction force application greatly accounts for the difference in 40-m sprint performance between highly trained athletes [4]. During run-based RSE, reduc-tions in the production of horizontal forces across successive efforts generally exceed those in the vertical direction [7,8], with larger fatigue levels (i.e., severe hypoxia compared to moderate
hypoxia or normoxia) exacerbating the magnitude of these mechanical alterations [6]. Data from the current study confirm these observations with a three time greater reduction in hori-zontal forces relative to vertical or total forces from set 1 to set 3 (Fig 3). Moreover, we extend these observations to show that progressively less effective acceleration (i.e., horizontal forces)
across sets were not exacerbated by heat stress.
As with previous RSE studies [6–8], this study showed that step frequency changes more dramatically as participants fatigue than does step length. With larger decreases in step fre-quency in HOTvs. CON during sets 2 and 3, these data reinforce that maintaining a faster step
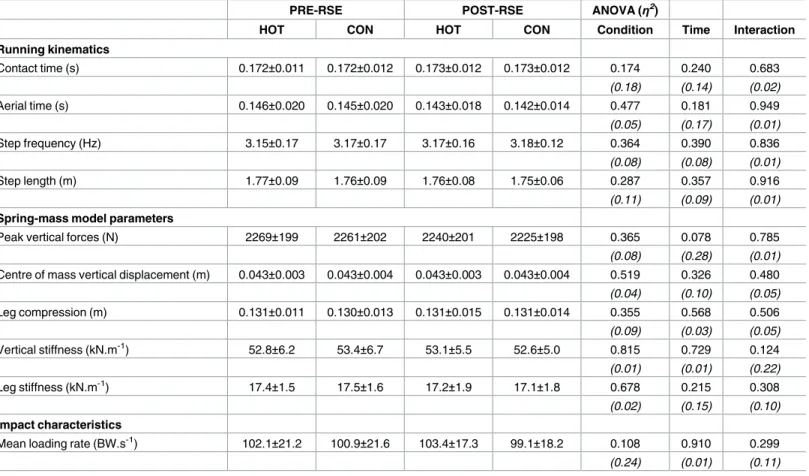
rate rather than taking longer steps is a prerequisite for optimizing performance when sprint-ing repeatedly in the heat. Additionally, an increase in contact time was observed with fatigue, but no alteration in aerial time (Table 2). This increase in ground contact time as sprints are repeated may be due, at least in part, to a reduced capacity of the neuromuscular system to Table 5. Constant high (20 km.h-1) velocity running kinematics and spring-mass variables prior to (PRE-RSE) and after (POST-RSE) the multi-set
repeated-sprint exercise (RSE) in HOT and CON conditions.
PRE-RSE POST-RSE ANOVA (η2)
HOT CON HOT CON Condition Time Interaction
Running kinematics Contact time (s) 0.172±0.011 0.172±0.012 0.173±0.012 0.173±0.012 0.174 0.240 0.683 (0.18) (0.14) (0.02) Aerial time (s) 0.146±0.020 0.145±0.020 0.143±0.018 0.142±0.014 0.477 0.181 0.949 (0.05) (0.17) (0.01) Step frequency (Hz) 3.15±0.17 3.17±0.17 3.17±0.16 3.18±0.12 0.364 0.390 0.836 (0.08) (0.08) (0.01) Step length (m) 1.77±0.09 1.76±0.09 1.76±0.08 1.75±0.06 0.287 0.357 0.916 (0.11) (0.09) (0.01)
Spring-mass model parameters
Peak vertical forces (N) 2269±199 2261±202 2240±201 2225±198 0.365 0.078 0.785
(0.08) (0.28) (0.01)
Centre of mass vertical displacement (m) 0.043±0.003 0.043±0.004 0.043±0.003 0.043±0.004 0.519 0.326 0.480
(0.04) (0.10) (0.05) Leg compression (m) 0.131±0.011 0.130±0.013 0.131±0.015 0.131±0.014 0.355 0.568 0.506 (0.09) (0.03) (0.05) Vertical stiffness (kN.m-1) 52.8±6.2 53.4±6.7 53.1±5.5 52.6±5.0 0.815 0.729 0.124 (0.01) (0.01) (0.22) Leg stiffness (kN.m-1) 17.4±1.5 17.5±1.6 17.2±1.9 17.1±1.8 0.678 0.215 0.308 (0.02) (0.15) (0.10) Impact characteristics
Mean loading rate (BW.s-1) 102.1±21.2 100.9±21.6 103.4±17.3 99.1±18.2 0.108 0.910 0.299
(0.24) (0.01) (0.11)
generate force rapidly (i.e., impaired stretch-shortening cycle efficiency) [34]. In support of this, decrements in rapid force development (i.e., within 100–200 ms of contraction onset) in
the knee extensors have recently been observed after the completion of eight treadmill sprints [35]. Playing tennis, which involves numerous taxing lower extremity stretch-shortening cycles (i.e., directional changes), results in similar fatigue-related alterations in explosive
strength in hot and temperate environments [36].
The classic linear spring-mass model, derived from vertical force-time waveforms, is increasingly used to explain many aspects of running gaits with remarkable accuracy given its mechanical simplicity [23]. In this model, the single-mass approach models running individu-als as a lumped point-mass mass bouncing on a massless leg spring [21]. As highlighted in the Table 3, a decrease in peak vertical forces occurred during multiple-set RSE in HOT and CON conditions, along with increases in maximal vertical displacement and leg compression, caus-ing reductions in vertical and leg stiffness values. These data are supported by recent investiga-tions examining the effect of RSE-induced fatigue on changes in spring-mass characteristics [6,7]. The current results however, are novel in showing that globally that maximal vertical dis-placement and vertical stiffness were negatively affected when completing the RSE in HOTvs.
CON. Collectively, the spring-mass results confirm that mechanical behavior changes towards a lower stride mechanical efficiency were exacerbated with exacerbated heat stress. Notwith-standing, in the absence of an interaction effect for any spring-mass model parameter, it must be acknowledged that reductions in the rate of force transmission between the legs and the ground are comparable between the two environments. Future studies should specifically ana-lyze the respective contributions of ankle, knee and hip joint angles in relation to these more general adjustments of the leg spring.
Constant-velocity runs
The current findings display no pre-to-post RSE changes in low and high constant-velocity run-ning patterns in both conditions (Tables4and5). These data corroborate previous observations made using the ADAL treadmill showing a similar range of values for mechanical properties at the same running velocities (i.e., 10 and 20 km.h-1) following the completion of four sets of five 6-s sprints with 24-s recovery and 3 min between sets in temperate conditions [20]. Similarly unchanged stride kinematics as well as leg and vertical stiffness values were observed after an exhaustive 2000-m run on an indoor track at constant velocity (13 km.h-1) [37]. Taken as a whole, the absence of changes in constant-velocity running patterns suggests a strong link between fatigue-induced velocity decrements during sprinting and mechanical alterations.
Although it is not yet clear which impact loading variable has the most important associa-tion with running-related injury risk [38], results from a recent meta-analysis have highlighted that reducing the loading rate of the vertical ground reaction force (e.g., via increasing
fre-quency [39] and/or forefoot striking [40]) by 10–15% may help in preventing stress fractures occurrence [41]. Unique to this study, however, was a lack of change in loading rate values during constant-velocity runs throughout the protocol in either condition (Tables4and5). These data suggest that multiple-set RSE conducted under heat stress does not further modify the ability of athletes to cushion impact during constant-velocity running. In contrast, al-though the first effort of six 30-s runs at 115% of the velocity associated with maximal oxygen uptake (i.e., 19.9±0.7 km.h-1) with 30-s passive recovery appears in line with the present high constant-velocity running patterns, the mean loading rates have been shown to increase by ~7% from the first to the last repetition [27]. Extending the timeframe during which constant-velocity running is evaluated may allow for identifying whether RSE influences running mechanics and spring-mass characteristics.
Additional considerations / limitations
In the present study, a possible reason for the lack of a larger difference in running mechanical performance between the two environments could be the ~0.15˚C difference in core tempera-ture after set 3, with participants reaching a core temperatempera-ture >38.5˚C in CON (Fig 1). The attainment of this core temperature in CON may partly be explained by the completion of a vigorous 30-min warm-up, which increased core temperature by ~1˚C in both conditions. In the RSE-related literature, brief warm-up procedures (<10 min with 1–3 “all-out” efforts) are conducted (e.g., [9]), calling into question the ability of participants to truly perform maximal efforts from the initial sprint. Additionally, the fact that relative humidity was ~24% higher in the CON condition may have reduced evaporative heat loss compared to the HOT environ-ment. Indeed, humid environments compromise evaporative heat loss and decrease exercise tolerance [42]. Future studies are thus required to examine the effect of adjusting levels of humidity to elicit similar absolute skin-air vapor pressure gradients at different ambient air temperatures to produce a similar drive for evaporation on repeated-sprint ability.
Certain limitations must be acknowledged. Firstly, the participants were recreational team-sport players and therefore do not necessarily mirror a cohort of elite competitors, which implies that conclusions must remain specific to the population tested. Secondly, to reflect true or ecological running mechanics, participants should perform over-ground sprints with their foot strikes recorded by a number of force plates laid in series. However, given the rela-tionship between over-ground and treadmill sprint mechanics [4], it would seem that the latter provides a practical alternative and a reliable measure of stride mechanical efficiency whilst sprinting [5].
Practical implications
• Defining the biomechanical adjustments that occur under situations of environmental heat stress, may represent a useful approach for tailoring training routines with the goal of improving repeated-sprint ability. This could be of interest for outdoor sports (e.g., football)
played in Equatorial or Middle-Eastern regions, where maximal accelerations are repeated over the course of games played in the heat.
• Sub-maximal constant-velocity running pattern assessments may be used when studying the mechanical alterations related to repeated sprinting in order to distinguish the fatigue-related changes from those fatigue-related to reductions in running velocity.”
Conclusion
In summary, higher thermal and perceptual strain during multiple-set RSE under heat stress is associated with decrements in propulsive power, step frequency and vertical stiffness, along with longer contact time. However, running mechanical alterations induced by sprint repeti-tions were in general not more pronounced in hot compared with cooler ambient condirepeti-tions. Moreover, completion of multiple-set RSE did not influence 1-min low and high constant-velocity (i.e., 10 and 20 km.h-1) running patterns. The absence of changes in constant-velocity running patterns therefore suggests a strong link between fatigue-induced velocity decrements during sprinting and mechanical alterations. While these results shed light on the biomechani-cal manifestation of fatigue when athletes repeatedly sprint at their maximum under heat stress, additional studies are needed to demonstrate how to improve RSE tolerance and opti-mize performance when competing in a hot environment. Given the preponderant role of car-diovascular and perceptual strain on performance and mechanical alterations, future studies
should consider RSE inducing heavier thermal strain and the impact of potential countermea-sures (e.g., pre-cooling, acclimation) aimed at mitigating its influence.
Acknowledgments
This work is based on research funded by QNRF (NPRP 4–760–3–217).
The authors gratefully acknowledge the participants for their enthusiasm and collaboration.
Author Contributions
Conceptualization: OG FB JBM SR GPM JDP. Data curation: OG FB JBM SR JDP.
Formal analysis: OG FB JBM SR GPM JDP. Funding acquisition: OG.
Investigation: OG FB SR JDP. Methodology: OG FB JBM SR JDP. Project administration: OG FB SR JDP. Resources: OG FB JBM SR JDP. Software: OG FB JBM. Supervision: OG FB JBM SR GPM JDP. Validation: OG FB JBM. Visualization: OG FB JBM SR GPM JDP. Writing – original draft: OG.
Writing – review & editing: OG FB JBM SR GPM JDP.
References
1. Waldron M, Highton J. Fatigue and pacing in high-intensity intermittent team sport: An update. Sports Med. 2014; 44(12):1645–58. doi:10.1007/s40279-014-0230-6PMID:25047854
2. Faude O, Koch T, Meyer T. Straight sprinting is the most frequent action in goal situations in profes-sional football. J Sports Sci. 2012; 30(7):625–31. doi:10.1080/02640414.2012.665940PMID:
22394328
3. Morin J-B, Samozino P, Bonnefoy R, Edouard P, Belli A. Direct measurement of power during one sin-gle sprint on treadmill. J Biomech. 2010; 43(10):1970–5. doi:10.1016/j.jbiomech.2010.03.012PMID:
20541762
4. Rabita G, Dorel S, Slawinski J, Sàez-de-Villarreal E, Couturier A, Samozino P, et al. Sprint mechanics in world-class athletes: a new insight into the limits of human locomotion. Scand J Med Sci Sports. 2015; 25(5):583–94. doi:10.1111/sms.12389PMID:25640466
5. Girard O, Brocherie F, Morin JB, Millet GP. Intra- and inter-session reliability of running mechanics dur-ing treadmill sprints. Int J Sports Physiol Perform. 2016; 11(4):432–9. doi:10.1123/ijspp.2015-0145
PMID:26356384
6. Brocherie F, Millet GP, Morin J-B, Girard O. Mechanical alterations to repeated treadmill sprints in nor-mobaric hypoxia. Med Sci Sports Exerc. 2016; 48(8):1570–9. doi:10.1249/MSS.0000000000000937
PMID:27031740
7. Girard O, Micallef J-P, Millet GP. Changes in spring-mass model characteristics during repeated run-ning sprints. Eur J Appl Physiol. 2011; 111(1):125–34. doi:10.1007/s00421-010-1638-9PMID:
8. Morin JB, Samozino P, Edouard P, Tomazin K. Effect of fatigue on force production and force applica-tion technique during repeated sprints. J Biomech. 2011; 44(15):2719–23. doi:10.1016/j.jbiomech. 2011.07.020PMID:21839456
9. Serpiello FR, McKenna MJ, Stepto NK, Bishop DJ, Aughey RJ. Performance and physiological responses to repeated-sprint exercise: a novel multiple-set approach. Eur J Appl Physiol. 2011; 111 (4):669–78. doi:10.1007/s00421-010-1687-0PMID:20957389
10. Arampatzis A, Knicker A, Metzler V, Bru¨ggemann GP. Mechanical power in running: a comparison of different approaches. J Biomech. 2000; 33(4):457–63. PMID:10768394
11. Brughelli M, Cronon J, Chaouachi A. Effects of running velocity on running kinetics and kinematics. J Strength Cond Res. 2013; 25(4):933–9.
12. Cheuvront SN, Kenefick RW, Montain SJ, Sawka MN. Mechanisms of aerobic performance impairment with heat stress and dehydration. J Appl Physiol. 2010; 109(6):1989–95. doi:10.1152/japplphysiol. 00367.2010PMID:20689090
13. Pe´riard JD, Cramer MN, Chapman PG, Caillaud C, Thompson MW. Cardiovascular strain impairs pro-longed self-paced exercise in the heat. Exp Physiol. 2011; 96(2):134–44. doi:10.1113/expphysiol. 2010.054213PMID:20851861
14. Pe´riard JD, Racinais S, Thompson MW. Adjustments in the force-frequency relationship during passive and exercise-induced hyperthermia. Muscle Nerve. 2014; 50(5):822–9. doi:10.1002/mus.24228
PMID:24615660
15. Racinais S, Gaoua N, Grantham J. Hyperthermia impairs short-term memory and peripheral motor drive transmission. J Physiol. 2008; 586(19):4751–62. doi:10.1113/jphysiol.2008.157420PMID:
18703579
16. Girard O. Brocherie F, Bishop DJ. Sprint performance under heat stress: a review. Scand J Med Sci Sports. 2015; 25(1):79–89.
17. Drust B, Rasmussen P, Mohr M, Nielsen B, Nybo L. Elevations in core and muscle temperature impairs repeated sprint performance. Acta Physiol Scand. 2005; 183(2):181–90. doi:10.1111/j.1365-201X. 2004.01390.xPMID:15676059
18. Girard O, Bishop DJ, Racinais S. Hot conditions improve power output during repeated cycling sprints without modifying neuromuscular fatigue characteristics. Eur J Appl Physiol. 2013; 113(2):359–69. doi:
10.1007/s00421-012-2444-3PMID:22743981
19. Christian RJ, Bishop DJ, Billaut F, Girard O. The role of sense of effort on self-selected cycling power output. Front Physiol. 2014; 5:115. doi:10.3389/fphys.2014.00115PMID:24744734
20. Morin J-B, Tomazin K, Samozino P, Edouard P, Millet GY. High-intensity sprint fatigue does not alter constant-submaximal velocity running mechanics and spring-mass behavior. Eur J Appl Physiol. 2012; 112(4):1419–28. doi:10.1007/s00421-011-2103-0PMID:21826454
21. Blickhan R. The spring-mass model for running and hopping. J Biomech. 1989; 22(11–12):1217–27. PMID:2625422
22. Farley CT, Gonzalez O. Leg stiffness and stride frequency in human running. J Biomech. 1996; 29 (2):181–6. PMID:8849811
23. Morin JB, Dalleau G, Kyrolainen H, Jeannin T, Belli A. A simple method for measuring stiffness during running. J Appl Biomech. 2005; 21(2):167–80. PMID:16082017
24. Ramanathan NL. A new weighting system for mean surface temperature of the human body. J Appl Physiol. 1964; 19:531–3. PMID:14173555
25. Bedford T. The warmth factor in comfort at work: a physiological study of heating and ventilation. Lon-don: HMSO; 1936. p. 102.
26. Borg GA. Psychophysical bases of perceived exertion. Med Sci Sports Exerc. 1982; 14(5):377–81. PMID:7154893
27. Girard O, Brocherie F, Morin J-B, Millet GP. Mechanical alterations during interval-training treadmill runs in high-level male team-sport players. J Sci Med Sport. 2016; in press.
28. Cohen J (1988) Statistical Power Analysis for the Behavioural Sciences ( 2nd ed.): Hillsdale, NJ: Law-rence Erlbaum.
29. Schimpchen J, Skorski S, Nopp S, Meyer T. Are “classical” tests of repeated-sprint ability in football externally valid? A new approach to determine in-game sprinting behaviour in elite football players. J Sports Sci. 2016; 34(6):519–26. doi:10.1080/02640414.2015.1112023PMID:26580089
30. Weyand PG, Sandell RF, Prime DNL, Bundle MW. The biological limits to running speed are imposed from the ground up. J Appl Physiol. 2010; 108(4):950–61. doi:10.1152/japplphysiol.00947.2009PMID:
31. Nummela A, Keranen T, Mikkelsson LO. Factors related to top running speed and economy. Int J Sports Med. 2007; 28(8):655–61. doi:10.1055/s-2007-964896PMID:17549657
32. Kawamori N, Nosaka K, Newton RU. Relationships between ground reaction impulse and sprint accel-eration performance in team sport athletes. J Strength Cond Res. 2013; 27(3):568–73. doi:10.1519/ JSC.0b013e318257805aPMID:22531618
33. Hunter JP, Marshall RN, McNair PJ. Relationships between ground reaction force impulse and kinemat-ics of sprint-running acceleration. J Appl Biomech; 2005: 21(1):31–43. PMID:16131703
34. Nicol C, Avela J, Komi PV. The stretch-shortening cycle. A model to study naturally occurring neuro-muscular fatigue. Sports Med. 2006; 36(11):977–99. PMID:17052133
35. Girard O, Brocherie F, Millet GP. High altitude increases alteration in maximal torque but not in rapid tor-que development in knee extensors after repeated treadmill sprinting. Front Physiol. 2016; 7:97. doi:
10.3389/fphys.2016.00097PMID:27014095
36. Girard O, Racinais S, Pe´riard J. Tennis in hot and cool conditions decreases the rapid muscle torque production capacity of the knee extensors but not of the plantar flexors. Br J Sports Med. 2014; 48(1): i52–8.
37. Slawinski J, Heubert R, Quievre J, Billat V, Hanon C. Changes in spring-mass model parameters and energy cost during track running to exhaustion. J Strength Cond Res. 2008; 22(3):930–6. doi:10.1519/ JSC.0b013e31816a4475PMID:18438219
38. Zadpoor AA, Nikooyan AA. The effects of lower-extremity muscle fatigue on the vertical ground reaction force: a meta-analysis. Proc Inst Mech Eng H. 2012; 226(8):579–88. PMID:23057231
39. Hobara H, Sato T, Sakaguchi M, Sato T, Nakazawa K. Step frequency and lower extremity loading dur-ing runndur-ing. Int J Sports Med. 2012; 33(4):310–3. doi:10.1055/s-0031-1291232PMID:22383130 40. Kulmala JP, Avela J, Pasanen K, Parkkari J. Forefoot strikers exhibit lower running-induced knee
load-ing than rearfoot strikers. Med Sci Sports Exerc. 2013; 45(12):2306–13. doi:10.1249/MSS. 0b013e31829efcf7PMID:23748735
41. van der Worp H, Vrielink JW, Bredeweg SW. Do runners who suffer injuries have higher vertical ground reaction forces than those who remain injury-free? A systematic review and meta-analysis. Br J Sports Med. 2016; 50(8):450–7. doi:10.1136/bjsports-2015-094924PMID:26729857
42. Maughan RJ, Otani H, Watson PW. Influence of relative humidity on prolonged exercise capacity in a warm environment. Eur J Appl Physiol. 2012; 112(6):2313–21. doi:10.1007/s00421-011-2206-7