HAL Id: hal-03101408
https://hal.archives-ouvertes.fr/hal-03101408
Submitted on 11 Jan 2021
HAL is a multi-disciplinary open access
archive for the deposit and dissemination of
sci-entific research documents, whether they are
pub-lished or not. The documents may come from
teaching and research institutions in France or
abroad, or from public or private research centers.
L’archive ouverte pluridisciplinaire HAL, est
destinée au dépôt et à la diffusion de documents
scientifiques de niveau recherche, publiés ou non,
émanant des établissements d’enseignement et de
recherche français ou étrangers, des laboratoires
publics ou privés.
A new 27 ky high resolution East Antarctic climate
record
J. Jouzel, V. Masson, O. Cattani, S. Falourd, M. Stievenard, B. Stenni, A.
Longinelli, S. Johnsen, J. Steffenssen, J. Petit, et al.
To cite this version:
J. Jouzel, V. Masson, O. Cattani, S. Falourd, M. Stievenard, et al.. A new 27 ky high resolution East
Antarctic climate record. Geophysical Research Letters, American Geophysical Union, 2001, 28 (16),
pp.3199-3202. �10.1029/2000GL012243�. �hal-03101408�
GEOPHYSICAL RESEARCH LETTERS, VOL. 28, NO. 16, PAGES 3199-3202, AUGUST 15,2001
A new 27 ky high resolution East Antarctic climate record
J. Jouzel
1 V.Masson
10.Cattani 1 S.Falourd
1 M.Stievenard
• B.Stenni
2
A.Longinelli
3
, S.J.Johnsen
4'5
, J.P.Steffenssen
4, J.R.Petit
6, J.Schwander
?,
R.Souchez
8 N.I.Barkov
9
Abstract. The ice core recently drilled at the Dome Concordia site on the East Antarctic plateau provides a new high resolution isotope record covering part of the last glacial, the last transition and the Holocene. The two step shape of the deglaciation is remarkably similar for all the ice cores now available on the East Antarctic plateau. The first warming trend ends about 14000 years ago and is followed by the well marked Antarctic Cold Reversal (ACR) with a secondary peak common to all records. During the deglaciation, there are more similarities between the near coastal site of Taylor Dome and inland East Antarctica than between Taylor Dome
and central Greenland. However, the results for EPICA do
appear to confirm the Taylor Dome timescale after about 14 ka, showing cooling into the ACR roughly in phase between Greenland and Antarctica. While the overall deglacial pattem is asynchronous, this suggests that the now classical picture of a temperature seesaw between Antarctica and Greenland may be too simplistic.
1. Introduction
Whereas numerous deep-sea, continental and ice core records covering the last deglaciation are now available [e.g. Alley and Clark, 1999], the driving mechanisms of this climatic transition are still not fully understood. Recent studies highlight the central role of the huge unstable Northern Hemisphere ice caps and their interaction with the oceanic thermohaline circulation in the North Atlantic. They also reveal that the Antarctic deglacial warming started before the sharp Greenland warming marking the onset of the B611ing and was interrupted by the so-called Antarctic Cold Reversal [hereafter ACR; Jouzel et al., 1995].
• Laboratoire des Sciences du Climat et de l'Environnement, Bat.
709, L'Orme des Merisiers, CEA Saclay, 91 191 Gif-sur-Yvette, France (e-mail: masson@lsce.saclay.cea.fr).
2Dept. of Geological,
Environmental
and Marine Sciences,
University of Trieste, Trieste, Italy.3Dept. of Geological,
Environmental
and Marine Sciences,
University of Trieste, Trieste, Italy.4Department
of Geophysics,
University
of Copenhagen,
Copenhagen,
Denmark.5Also
at Science
Institute,
University
of Reykjavik,
Reykjavik
107,
Iceland.6Laboratoire
de Glaciologie
et G6ophysique
de l'Environnement,
CNRS, St Martin d'H6res, France.
7physics
Institute,
University
of Bern,
Bern,
Switzerland.
8D6partement
des Sciences
de la Terre et de l'Environnement,
Universit6 Libre de Bruxelles, Bruxelles, Belgique.9Arctic
and
Antarctic
Research
Institute,
St Petersburg,
Russia.
Copyright 2001 by the American Geophysical Union.Paper number 2000GL012243.
0094-8276/01/2000GL012243505.00
Our knowledge of the timing of the deglaciation has recently benefited from the interpretation of ice core isotopic profiles (fid
or $180,
which
are proxies
of temperature
change)
from both
hemispheres. Those cores can now be cross dated owing to the global synchronism of air composition changes [Sowers and Bender, 1995; Blunier et al., 1998]. Still, as far as Antarctica is concerned, conclusions are mainly based on two records only, Byrd in West Antarctica and Vostok in Central East Antarctica (Figure 1). However, none of them is ideally suited for this purpose. The Byrd isotopic temperature record may significantly
be affected by changes in the altitude of the ice cap and in the
origin of the ice flow [Raynaud et al., 1982]. The Vostok chronology is poorly constrained with respect to Greenland records because of the large uncertainty associated with the gas age-ice age difference in this low accumulation site. As a result it is difficult to precisely answer questions about the initial start of the deglaciation in Antarctica and about the comparison of its shape and timing between East and West Antarctica or between East Antarctica and Greenland. To answer such questions there is a need to obtain more isotopic records with the best possible resolution at various places in Antarctica. This need is strengthened by the data recently obtained from the Taylor Dome core (hereafter TD), which on the published timescale appears to indicate synchronous climatic changes between this Ross Sea sector of Antarctica and the North Atlantic [Steig et al., 1998].
We present here a new $D profile measured along an ice core recently drilled at Dome Concordia, a site located on the Central East Antarctic Plateau (CEAP) in between TD and more inland ice drilling sites such as Vostok (Figure 1). The interest of this new record recovered in the frame of the European Project for Ice Coring in Antarctica (hereafter EPICA DC) lies in its excellent temporal resolution (typically 20 years in the Holocene and 50 years in last glacial). Also Vostok receives a significant amount of moisture from the Atlantic and TD is dominantly influenced by the Pacific; in contrast, the Dome Concordia site should receive most of its moisture from the Indian ocean [Delaygue et al., 2000a, Werner et al., 2001]. In addition to EPICA Dome C, we discuss a new detailed and continuous record of the bottom part of the inland core drilled at Komsomolskaia (Figure 1) up to now documented at very coarse resolution [Ciais et al., 1992].
2. The EPICA Dome C Deuterium Record
Topographic and radar measurements carried out in the DC region [Tabacco et al., 1998] allowed the determination of the EPICA drilling site on the topographic dome centered at 75ø06'06"S, 123ø23'42"E at an elevation of 3233m. The ice thickness is of 3250 + 25 m and the mean annual air temperature
is-51.1øC. The EPICA site is located 50 km SSW of the site
where a 906 m thermal core (hereafter old Dome C) was drilled during the 1977-1978 field season [Lorius et al., 1979]. The EPICA DC core has been recovered by the means of an electro- mechanic drilling in two seasons 1997-1998 and 1998-1999 but
• '" 60OE
60ow [
90øWl
•/ t•o..•
\ • 2•/ k ....
• '• VOS[OK /e/ • Komsom•;:kaia
• / '•'1,oow\
%.
180 øKomsomolskma
depth (m)
0 400 800-360 I•
.... '-
...
• 'i • '_ _390•,•
-390
I'
, '
-420
-450 .... ' ...
-•--•
, •
-480
0
200
400
600
EDC depth
(m)
Figure 1. Map of Antarctica showing the location of Antarctic
drilling sites along with the EPICA Dome C 8D record with
respect to depth. We have in addition reported the deglaciation part of the Komsomolskaia core over which detailed measurements have been performed.
A chronology of the EPICA DC core (EDC1) has been established combining a modeling approach, the use of time markers and comparison with other records [Schwander et al., in press]. It uses two reference ages: (1) the end of the Younger Dryas 11.5 ka (thousands of years before present) derived from
isotope
match
with Byrd,
and
(2) the ]øBe
peak
discovered
in the
old Dome C and Vostok cores [Raisbeck et al., 1987] supposed
to result from the Laschamps geomagnetic excursion (--, 41 ka). It
also benefits from a correlation with the Byrd core through a
common fluoride peak observed at 17.3 ka and additional volcanic events.
The 8D measurements show lightest isotopic values in EPICA
DC than in old DC [Jouzel et al., 1982] with a constant offset of
about 5%0. This shift may be explained by local meteorological
conditions, since EPICA DC has a much colder winter surface temperature (by 1.3øC) and a 15% lower accumulation than old
DC (2.7 and
3.4 g.cm-2.yr']).
The temperature interpretation based on the use of the present- day spatial isotope/temperature slope as a surrogate of the temporal slope clearly underestimates temperature changes in
Greenland [Cuffey et al., 1995; Johnsen et al., 1995], likely due
to changes in precipitation seasonality [Krinner et al., 1997;
Werner et al., 2000]. Model results suggest that seasonality-has less influence on Antarctic precipitation [Krinner et al., 1997;'
Delaygue et al., 2000b]. In the absence of strong argument against it, this classical temperature interpretation is still considered as valid for Antarctic isotopic profiles [Petit et al.,
1999]. Other factors such as changes in the origin of the precipitation, in the cloud microphysics or in the strength of the
inversion should influence the isotopic content of polar snow. Stenni et al [submitted] have used the EPICA DC deuterium-
excess
parameter
(d=SD-88•80),
largely governed
by the
moisture source temperature, to confirm that 8D changes mainly depend on the temperature of the site with a dependency to surface temperature close to that observed for present-day surface snow in this sector. They infer a glacial to Holocene optimum surface temperature change of 9øC, taking into account the glacial-interglacial change in the oceanic source regions as inferred from the deuterium-excess record and in the isotopic composition of the ocean.
the drill was unfortunately stuck at the end of the second season. This core was sampled at a 55 cm length and the first 585 m were analyzed for 8D with a precision of +0.5%0 [Vaughn et al., 1998].
-385 -405
-425
-445
-465 -485Age (ka)
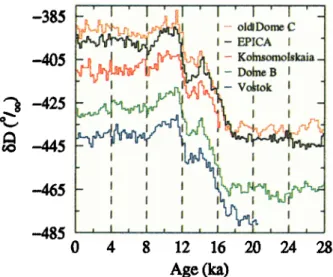
Figure 2. Comparison of deglaciation 8D profiles from 5
different sites located on the East Antarctic plateau at 200 year resolution.
3. Comparison with Other Isotopic Ice Core
Records
Figure 2 displays the 8D records available on ice cores from Central East Antarctica with from top to bottom, old and EPICA DC, Komsomolskaia, Dome B and Vostok. For Vostok, we use the 4F profile [Jouzel et al., 1992] which is more detailed than the 3F one. The Komsomolskaia profile includes new data in its deglaciation part now measured on a continuous and detailed basis (Figure 1). We use the published timescales for Dome B [Jouzel et al., 1995], Komsomoslkaia [Ciais et al., 1992] and Vostok [GT4 timescale of Petit et al., 1999]. Figure 2 shows an excellent agreement between the 8D profiles of EPICA DC, Komsomolskaia, Dome B and Vostok without any timescale adjustment. In particular, deglaciation is synchronous for these 4 inland sites which is corroborated by available dust profiles [Mulvaney et al., 2000] and by precise depth correlation between Vostok and EPICA DC based on a matching of major peaks of electrical conductivity [Wolff et al., 1999]. Instead, the old Dome C timescale [Jouzel et al., 1982] is 4% younger than EPICA DC at mid-deglaciation and has been linearly adjusted in Figure 2.
The 5 CEAP records show a similar two-step deglaciation pattern, stm'ting at about 18 ka with a first warming trend ending at -•14 ka as proposed by Jouzel et al. [ 1995]. This dating thus places this well marked event younger (up to 1000 years) than the
JOUZEL ET AL.: A NEW ANTARCTIC CLIMATE RECORD 3201 10 14 18 22
-39
-44 -380-280
-415
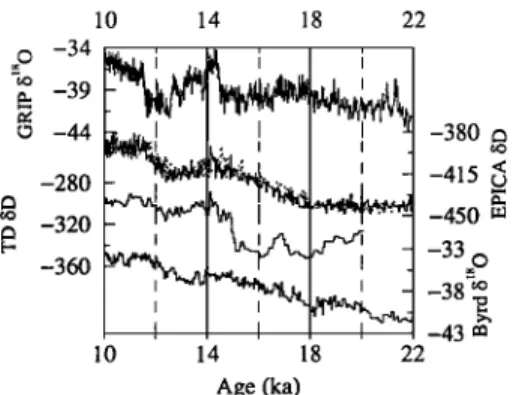
-450 -320 -33 O -360 • -38 • -43 m 10 14 18 22 Age (ka)Figure 3. EPICA DC record compared to records of the transition in near-Coastal East Antarctica (Taylor Dome), West Antarctica (Byrd) and central Greenland (GRIP). In addition to the EPICA DC record obtained using the EDC1 glaciological timescale (continuous line) we have reported this record (dotted line) as dated by direct correlation with the GRIP SSO9 timescale (Schwander et al., in press).
Vostok chronologies derived by correlation with the Greenland records using either atmospheric oxygen 18 [Sowers et al., 1992] or methane data [Blunier et al., 1998]. Note that such a correlation performed between EPICA DC and GRIP using CH4 records, provides ages older than EDC1 [Schwander et al., in press]. The 400 years difference observed around 14 ka (see Figure 3) is however well within the uncertainty associated with the ice age-gas age difference.
The first warming (35%0 fiD) is followed by a relatively abrupt cooling (10%o fiD) already documented as the onset of the ACR [Jouzel et al., 1992; 1995], with its coldest part between ~13.5 and 12.5 ka then followed by a second warming step (25%0 fiD) reaching the so-called Holocene optimum at about 11.5 ka. The amplitude of the isotopic changes is remarkably common to all the different ice cores, independently of their geographic
spreading and of the absolute level of modem fid content of
surface snow. The internal shape of the ACR is remarkably consistent between the 5 records with a secondary maximum particularly well marked in our two new records of the last deglaciation, EPICA DC and Komsomolskaia.
Figure 3 compares the EPICA DC deglaciation record that we will take as a reference for CEAP with those of Byrd (West Antarctica), TD (near coastal site in the Ross Sea sector of East Antarctica) and GRIP (central Greenland). The deglacial warming started first in Central Greenland (where the coldest period was around 25 ka) and then at ~18 ka both in West Antarctica (Bender et al., 1999) and in central East Antarctica (note however low values at Byrd around 22 ka). Steig et al. [1998] indicated that this warming started even later at TD and was abrupt around 15 ka. However, aerosol results suggest that TD and EPICA DC climate changes may be synchronous for this first part of the deglaciation [Mulvaney et al., 2000]. As pointed out by Jouzel et al. [ 1995], the shape of the deglacial warming
then differs between East and West Antarctica with the ACR
being well marked in East Antarctica (and very consistently in the 5 CEAP records) and less pronounced and shorter at Byrd. This first warming ends around 14 ka at all Antarctic sites ~500 years later than the onset of the Bolling Allerod in Greenland (however, the CH4 correlation with GRIP makes those two events coeval, drawing attention on the difficulty of precisely comparing Greenland records with those of CEAP). Unlike shown in Steig et al. [ 1998], the climate records of central and near coastal East
Antarctica are relatively similar after 14 ka with however a
slightly less pronounced cooling at TD (again within dating
uncertainty). Steig et al. [1998] used an old timescale for the Vostok core which caused them to incorrectly conclude that both Byrd and Vostok cooled earlier than TD. However, their conclusion that the Byrd cooling appears earlier than at TD or elsewhere in East Antarctica appears to be correct. Moreover, the similarity now observed for the second part of the deglaciation between CEAP cores and TD, strongly suggests that the TD dating is correct for ages younger than ~14 ka. Overall, the interpretation of EPICA DC data supports the picture that in East Antarctica, including TD, the last deglaciation is characterized by a long gradual warming interrupted by the ACR. The two warming periods started in Antarctica before the abrupt transitions in Greenland, leading the onset of the B611ing Allerod and the end of the Younger dryas by ~3.5 and 1 ka respectively. On the other hand, the cooling period occuring after the first warming appears roughly in phase at the two poles.
Unlike for the deglaciation, the 5 CEAP records exhibit significantly different isotopic trends during the Holocene (Figure 2). EPICA and old DC records show a sharp isotopic decrease ending the early Holocene optimum and leading to the weakest isotopic values of the Holocene around 8 ka. This is followed by an increasing trend until 4.5 ka and stable values afterwards. Instead, Vostok, Dome B and Komsomolskaia all located further East and inland reflect a fid decreasing trend all over the Holocene with varying slopes. As pointed out by Masson et al. [2000], such different isotopic trends may reflect relative changes in the topography of the East Antarctic ice sheet at these different locations in response to the accumulation increase due to warmer temperatures. Such variations would be consistent with relative changes in ice sheet topography of 15
m/ka between Dome Concordia and Vostok between 8 ka and
nowadays. Superimposed on the long term Holocene trend, the EPICA DC fid record shows some organised variability in common with old DC (warm rapid events with an amplitude
reaching typically 5 %0 can be identified ~1.4, 2.8, 3.8 to 6 and
7.7 ka).
4. Conclusion
The two step shape of the last deglaciation in East Antarctica was first noted in the old DC isotopic record, from where the ACR was originally defined, and then characterized in the Vostok and Dome B records. This event is now fully depicted in
two new records EPICA DC and Komsomolskaia and the
duration, amplitude and internal shape of the ACR showing a well marked secondary maximum, are remarkably similar in those 5 CEAP cores. Such similarities apply for the last deglaciation as a whole but Holocene trends slightly differ between the Dome Concordia and Vostok sites likely due to changes in ice sheet topography.
The EPICA DC chronology established by Schwander et al. [in press] indicates that the deglaciation started at ~18 ka with a first warming trend ending at ~14 ka almost synchronously in all
Antarctic sites. There is then a different behavior'with the ACR
cooling lasting shorter and being less pronounced at Byrd than over the CEAP region. However, the possible influence of changes in altitude and in the origin of the ice on the Byrd record as well as dating uncertainties should be kept in mind. Between 14 and 11 ka TD and CEAP records may be relatively similar as previously suggested by Mulvaney et al. [2000] for the earlier part of the deglaciation. Overall, the EPICA DC results definitely
3202 JOUZEL ET AL.: A NEW ANTARCTIC CLIMATE RECORD question that the Ross Sea sector of East Antarctica experienced
a particularly strong "North Atlantic" signal.
The picture that now emerges is that all East Antarctic cores, including TD, have a similar deglaciation history characterized by a long gradual warming interrupted, between ~14 and 12.5 ka, by the ACR. The two periods of warming lead the abrupt transitions in Greenland. Instead the cooling after 14 ka is roughly in phase between Greenland and Antarctica. This gives a deglaciation pattern (asynchrony) quite parallel to that observed during the A1 and A2 glacial events in Antarctica and the corresponding Dansgaard-Oeschger events in Greenland [Blunier et al., 1998]. In turn, the now classical picture of a seesaw [Broecker 1998; Stocker, 1998] between Antarctica and Greenland during the last deglaciation, i.e. Greenland warms when Antarctica cools and conversely, may be too simplistic. However, our results are in agreement with present modeling efforts [Ganapolski and Ramstorf 2001] based on changes in the inter-hemispheric heat transport induced by variations of the Atlantic thermohaline circulation.
Finally, it should be noted that the region covered by our 5 East Antarctic records only represents about one third of East Antarctica. Obtaining new records at coastal sites such as Law Dome or inland such as at Dome Fuji (where an event similar to the ACR is clearly seen but not yet crossdated with other records) and at the EPICA Dronning Maud Land site in East Antarctica or at SIPLE Dome in West Antarctica, are highly desirable.
Acknowledgments. This is EPICA publication no. 27. This work is a contribution to the '•European Project for Ice Coring in Antarctica" (EPICA), a joint ESF (European Science Foundation) / EU scientific programme, funded by the European Commission and by national contributions from Belgium, Denmark, France, Germany, Italy, the Netherlands, Norway, Sweden, Switzerland and the United Kingdom. In France, EPICA is supported by IFRTP (Institut Frangais de Recherches et Technologies Polaires). We thank S. Becavin for the Komsomolskaia fid measurements, G. Delaygue, M. Delmotte, B. Stauffer, T. Stocker for constructive discussions, and our many colleagues involved in drilling, science and logistics at Dome C as well as the Russian drillers from St Petersburg Mining Institute and to the Russian Antarctic Expeditions for getting access to the Komsomolskaia samples. We acknowledge E. Steig for a very thorough review and for his suggestions concerning the comparison between Taylor Dome and inland East Antarctic cores. This is LSCE contribution 0542.
References
Alley, R.B., and P.U. Clark, The deglaciation of the northern hemisphere: a global perspective, Ann. Rev. Earth Planet. Sci.,
149-182, 1999.
Blunier, T. and others, Asynchrony of Antarctic and Greenland climate change during the last glacial period. Nature, 394, 739-
743, 1998.
Broecker, W.S., Paleocean circulation during the last deglaciation A bipolar seasaw ?, Paleoceanography, 13, 119-121, 1998. Ciais, P., J.R. Petit, J. Jouzel, C. Lorius, N.I. Barkov, V. Lipenkov,
and V. Nicolai'ev, Evidence for an Early Holocene climatic optimum in the Antarctic deep ice core record, Climate Dynamics, 6, 169-177, 1992.
Cuffey, K.M., G.D. Clow, R.B. Alley, M. Stuiver, E.D. Waddington, and R.W. Saltus, Large Arctic temperature change at the Winconsin-Holocene glacial transition, Science, 270, 455 - 458, 1995.
Delaygue, G., V. Masson, J. Jouzel, R.D. Koster, and R.J. Healy, The origin of Antarctic precipitation ß A modelling approach, Tellus, 52B, 19-36, 2000a.
Delaygue, G., J. Jouzel, V. Masson, R.D. Koster, and E. Bard, Validity of the isotopic thermometer in central Antarctica ß
limited impact of glacial precipitation seasonality and moisture origin, Geophys. Res. Lett., 27, 2677-2680, 2000b.
Ganapolski, A., S. Ramhsdorf, Rapid changes of glacial climate simulated in a coupled climate model, Nature, 409, 153-158, 2001.
Hammer, C.U., H.B. Clausen, and C.C.J. Langwy, ECM stratigraphic dating of the Byrd station ice core, Ann. Glaciol., 20, 115 - 120, 1994.
Johnsen, S.J.13 others, Irregular glacial intersradials recorded in a new Greenland ice core., Nature, 359, 311-313, 1992.
Johnsen, S.J., D. Dahl-Jensen, W. Dansgaard, and N. Gundestrup, Greenland paleotemperatures derived from GRIP bore hole temperature and ice core isotope profiles., Tellus, 47B, 624-629, 1995.
Jouzel, J., L. Merlivat, and C. Lorius, Deuterium excess in an East Antarctic ice core suggests higher relative humidity at the oceanic surface during the last glacial maximum, Nature, 299, 688-691, 1982.
Jouzel, J.13 others, The two-step shape and timing of the last deglaciation in Antarctica;, Clim. Dyn., 11, 151-161, 1995. Krinner, G., C. Genthon, and J. Jouzel, GCM analysis of local
influences on ice core 15 signals, Geophys. Res. Lett., 24, 2825-
2828, 1997.
Lorius, C., L. Merlivat, J. Jouzel, and M. Pourchet, A 30,000 yr isotope climatic record from Antarctic ice, Nature, 280, 644-648, 1979.
Masson, V., and others, Holocene temporal and spatial variability in Antarctica., Quat Res., 54, 348-358, 2000.
Mulvaney, R., R. R6thlisberger, E.W. Wolff, S. Sommer, J.
Schwander, M.A. Hutterli, and J. Jouzel, The transition from the
last glacial period in inland and near-coastal Antarctica, Geophys.
Res. Lett. 27, 2673-2676, 2000.
Petit, J.R., and others, Climate and Atmospheric History of the Past 420000 years from the Vostok Ice Core, Antarctica, Nature, 399,
429-436, 1999.
Raisbeck, G.M., F. Yiou, D. Bourles, C. Lorius, J. Jouzel, and N.I.
Barkov, Evidence for two intervals of enhanced deposition in Antarctic ice during the last glacial period., Nature, 326, 273-
277, 1987.
Raynaud, D., and I.M. Whillans, Air content of the Byrd ice core and past changes in the West Antarctic ice sheet, Annals of Glaciology, 3, 269-272, 1982.
Schwander, J., J. Jouzel, C.U. Hammer, J.R. Petit, R. Udisti, and E. Wolff, A tentative chronology of the EPICA Dome C ice core, Geophys. Res. Lett., in press.
Sowers, T., and M. Bender, Climate records covering the last deglaciation, Science, 269, 210-214, 1995.
Steig, E., E.J. Brook, J.W.C. White, C.M. Sucher, M.L. Bender, S.J. Lehman, D.L. morse, E.D. Waddigton, and G.D. Clow, Synchronous climate changes in Antarctica and the North
Atlantic, Science, 282, 92-95, 1998.
Stocker, T., The seesaw effect, Science, 282, 61-62, 1998.
Tabaco, I.E., A. Passerini, F. Corbelli, and M. Gorman, Determination of the Surface and Bed topography at Dome concordia (East Antarctica), J. Glaciol., 44, 185-191, 1998. Vaughn, B., J.W.C. White, M. Delmotte, M. Trolier, O. Cattani, and
M. Stievenard, An automated system for the uranium reduction method of hydrogen isotope analysis of water., Chemical Geology, 152, 309-319, 1998.
Werner, M., U. Mikolajewicz, M. Heimann, and G. Hoffmann, Borehole versus isotope temperatures on Greenland: Seasonality does matter, Geophys. Res. Lett., 27, 723-726, 2000.
Werner, M., M. Heimann, and G. Hoffmann, Isotopic composition and origin of polar precipitation in present and glacial climate,
Tellus, 53, 53-71, 2001.
Wolff, E., I. Basile, J.R. Petit, and J. Schwander, Comparison of
Holocene electrical records from Dome C and Vostok, Antarctica,
Annals of Glaciology, 29, 89-93, 1999.
(Received August 23, 2000; revised January 3, 2001' accepted April 5, 2001.)