HAL Id: hal-01155078
https://hal.archives-ouvertes.fr/hal-01155078
Submitted on 26 May 2015
HAL is a multi-disciplinary open access
archive for the deposit and dissemination of
sci-entific research documents, whether they are
pub-lished or not. The documents may come from
teaching and research institutions in France or
abroad, or from public or private research centers.
L’archive ouverte pluridisciplinaire HAL, est
destinée au dépôt et à la diffusion de documents
scientifiques de niveau recherche, publiés ou non,
émanant des établissements d’enseignement et de
recherche français ou étrangers, des laboratoires
publics ou privés.
GPSSI: Gaussian Process for Sampling Segmentations of
Images
Matthieu Lê, Jan Unkelbach, Nicholas Ayache, Hervé Delingette
To cite this version:
Matthieu Lê, Jan Unkelbach, Nicholas Ayache, Hervé Delingette. GPSSI: Gaussian Process for
Sam-pling Segmentations of Images. MICCAI - Medical Image Computing and Computer Assisted
Inter-vention - 2015, Oct 2015, Munich, Germany. pp.38-46, �10.1007/978-3-319-24574-4_5�. �hal-01155078�
GPSSI: Gaussian Process for
Sampling Segmentations of Images
Matthieu Lˆe1, Jan Unkelbach2, Nicholas Ayache1, and Herv´e Delingette1
1
Asclepios Project, INRIA Sophia Antipolis, France
2 Department of Radiation Oncology, Massachusetts General Hospital and Harvard
Medical School, Boston, MA, USA
Abstract. Medical image segmentation is often a prerequisite for clin-ical applications. As an ill-posed problem, it leads to uncertain estima-tions of the region of interest which may have a significant impact on downstream applications, such as therapy planning. To quantify the un-certainty related to image segmentations, a classical approach is to mea-sure the effect of using various plausible segmentations. In this paper, a method for producing such image segmentation samples from a single expert segmentation is introduced. A probability distribution of image segmentation boundaries is defined as a Gaussian process, which leads to segmentations that are spatially coherent and consistent with the pres-ence of salient borders in the image. The proposed approach outperforms previous generative segmentation approaches, and segmentation samples can be generated efficiently. The sample variability is governed by a pa-rameter which is correlated with a simple DICE score. We show how this approach can have multiple useful applications in the field of uncertainty quantification, and an illustration is provided in radiotherapy planning.
1
Introduction
Medical image analysis, and in particular medical image segmentation, is a key technology for many medical applications, ranging from computer aided diagno-sis to therapy planning and guidance. Medical image segmentation is probably the task most often required in those applications. Due to its ill-posed nature, the quantification of segmentation accuracy and uncertainty is crucial to assess the overall performance of other applications. For instance, in radiotherapy planning it is important to estimate the impact of uncertainty in the delineation of the gross tumor volume and the organs at risk on the dose delivered to the patient. A straightforward way to assess this impact is to perform Image Segmentation Sampling (ISS), which consists of gathering several plausible segmentations of the same structure, and estimate the variability of the output variables due to the variability of the segmentations. For computer generated segmentations, ISS could simply be obtained by varying the parameters or initial values of the algorithm producing the segmentations. However, in many cases, parameters of the algorithms cannot be modified, and segmentations are partially edited by a user. For manual or semi-manual segmentations, it is possible to estimate the
inter-expert variability on a few cases but it usually cannot be applied on large databases due to the amount of resources required.
This is why it is important to automate the generation of ”plausible seg-mentations” that are ”similar to” a given segmentation of a region of interest (ROI). This is the objective of this paper which, to the best of our knowledge, has not been tackled before. It is naturally connected to several prior work in the field of medical image segmentation. For instance, [1] have proposed seg-mentation approaches based on Markov Chain Monte Carlo where parameter sampling leads to an estimation of the posterior probability of obtaining a seg-mentation given an image. However in those approaches, the algorithm defines the likelihood and prior functions and then estimate the most probable (or the expected) segmentation whereas in ISS the objective is to sample directly from the posterior distribution, knowing only its mean or mode. Therefore they are not readily suitable to the task of ISS.
Other related approaches [2,3,4] are aiming at producing a consensus seg-mentation given several expert segseg-mentations, or several atlas segseg-mentations. They define probabilities of having a given segmentation based on a reference one, and their generative nature makes them suitable for ISS. Typical examples are the STAPLE algorithm [2], the log-odds maps [3] and their refinement [4]. However, as shown in section 2, the segmentations generated from a single expert segmentation lack plausibility, and the spatial regularity of the contours cannot be finely controlled.
In this paper, a novel framework is introduced to sample segmentations au-tomatically leading to plausible delineations. More precisely, the proposed ap-proach incorporates knowledge about image saliency of the ROI such that the sampled contours variability may be greater at poorly contrasted regions. Fur-thermore the proposed approach is mathematically well grounded, and enforces the spatial smoothness of the contours as it relies on Gaussian processes defined on implicit contours. Finally, segmentation sampling can be performed efficiently even on large medical images thanks to an original algorithm based on discrete Fourier transform. Variability in the samples is easily controlled by a single scalar, and an application to radiotherapy dose planning is described.
2
Existing Generative Models of Segmentations
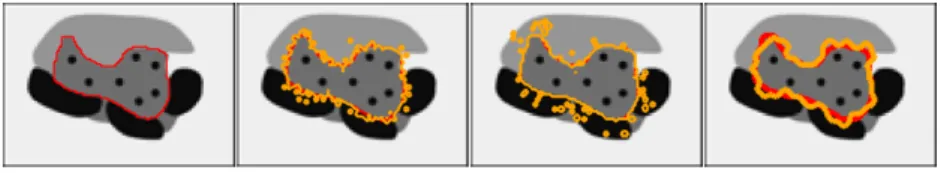
This section reviews relevant generative models of segmentations proposed in the literature. Results are illustrated on a synthetic image (Fig. 1) for which the structure border is surrounded by regions of low and high contrast.
The probabilistic atlases [3] derived from log-odds of signed distance func-tions assume that voxels are independently distributed with a Bernouilli prob-ability density function of parameter b whose value depends on the distance to the structure border. The STAPLE algorithm [2] is a region formulation for producing consensus segmentations. Given a binary segmentation T and expert sensitivity p and specificity q, the algorithm is associated with a generative model for which a segmentation D can be sampled knowing T as a Markov Random
Fig. 1: From left to right: synthetic image with region of interest outlined in red; segmentation sampling based on log-odds; segmentation sampling based on STAPLE without ICM steps (p = 68% and q = 66%); ISS based on STAPLE with ICM steps (p = 68% and q = 66%). The ground truth is outlined in red, the samples are outlined in orange.
Field with the likelihood term P (Di = 1) = pP (Ti = 1) + (1 − q)P (Ti = 0)
and a prior accounting for local spatial coherence. Segmentations are generated by sampling independently the Bernoulli distribution at each voxel followed by a number of Iterated Conditional Modes (ICM) relaxation steps. Various ISS results are obtained in Fig. 1 for the log-odds and STAPLE generative models with specified parameters.
In all cases, the produced segmentations are not realistic for 2 reasons. First of all, the variability of the segmentation does not account for the intensity in the image such that borders with strong gradients are equally variable as borders with weak gradient. This is counter intuitive as the basic hypothesis of image segmentation is that changes of intensity are correlated with changes of labels. Second, borders of the segmented structures are unrealistic mainly due to their lack of geometric regularity (high frequency wobbling in Fig. 1 (Right)). While anatomical or pathological structure borders are not necessarily smooth (e.g. highly diffuse tumors), the generated samples show irregular generated contours in the presence of regular visible contours in the image which is not plausible.
3
GPSSI
3.1 Definition
We propose a generative model of image segmentation that overcomes the two limitations of previous approaches. First of all, spatial consistency of the sam-pled segmentations is reached by describing a probabilistic segmentation with a Gaussian process with a squared exponential covariance, which allows to easily control the spatial coherence of the segmentation. Second, sampled segmenta-tions do take into account the image intensity by replacing the signed distance functions with signed geodesic distance. The geodesic distance makes voxels far away from the mean segmentation if they are separated from it by high gradient intensity regions. Therefore a random perturbation on the mean segmentation is unlikely to reach those voxels with high contrast, and more likely to affect voxels with low geodesic distance, i.e. voxels neighboring the mean segmentation with similar intensity values.
Fig. 2: (Top Left) Mean of the GP µ; (Top Middle) Sample of the level func-tion ϕ(x) drawn from GP(µ, Σ); (Others) GPSSI samples. The ground truth is outlined in red, the GPSSI samples are outlined in orange.
A novel probabilistic framework of image segmentation is introduced by defin-ing a level set function via a Gaussian process (GP). The mean of the GP is given by a signed geodesic distance, and its covariance is defined with a squared ex-ponential driven by the Euclidean distance between voxels. Gaussian process implicit surfaces have been introduced previously by Williams et al. [5] as a gen-eralization of thin plate splines and used recently [6] for surface reconstruction. However, our approach combining geodesic and Euclidean distance functions for the mean and covariance is original and specifically suited to represent proba-bilistic image segmentations.
Geodesic distance map. Signed geodesic distance map are computed as G(x) = minΓ ∈Pseg,x
R1
0 p||Γ0(s)||
2+ γ2(∇I(Γ(s)) · (Γ0(s)/kΓ0(s))k)2ds, where I
is the input image, Pseg,x is the set of all paths between the voxel x and the
segmentation C, and Γ one such path, parametrized by s ∈ [0, 1]. The parameter γ sets the trade-off between Euclidean distance (γ = 0) and gradient information. Its implementation is based on a fast grid sweeping method as proposed in [7] where the gradient is computed with a Gaussian kernel convolution controlled by parameter h. Geodesic distance is set negative inside the segmentation and positive outside.
GPSSI. Gaussian processes (GP) are a generalization of multivariate Gaus-sian distributions, and provide a framework to define smooth probability dis-tributions over functions. GP are widely used in machine learning for solving inference problems [8] over spatially correlated datasets. In this paper, it is the generative nature of GP that is of interest since they naturally produce spatially smooth samples in a straightforward manner. This is a key advantage over pre-vious approaches such as Markov Random Fields which enforce the connectivity between labels rather than the geometric regularity of the boundary of a ROI.
In GPSSI, a segmentation is defined via a level function ϕ(x), x ∈ Ω such that its zero level set corresponds to the boundary of the ROI. Smoothness in the level function ϕ(x) translates into the smoothness of the boundary Bϕ =
{x|ϕ(x) = 0}. A GP is fully defined by its mean and covariance functions: its mean value is set to the signed geodesic distance µ(x) = G(x) while its covariance
is chosen as the squared exponential function, Σ(x, y) = w0exp(−kx − yk2/w21).
This choice of covariance enforces the smoothness of the segmentation, with parameter w1 characterizing the typical correlation length between two voxels
while w0 controls the amount of variability of the level function.
3.2 Efficient Sampling
Sampling of a GP is simply performed through the factorization of the covariance matrix at sample points. More precisely, let ΩM = {xi}, i = 1 . . . M be the
set of M discrete points xi where the level function ϕ(x) is defined. Typically
ΩM may be the set of all voxel centers in the image. The covariance matrix
ΣM M
ij = w0exp(−kxi− xjk2/w21) at sampled points is of size M × M . To sample
from a GP GP(µ, Σ), a factorization of the covariance matrix ΣM M = LL> is
required, such that given normally distributed variables z ∼ N (0, 1), GPSSI are simply computed as the zero crossing of µ + L(w0, w1)z ∼ GP(µ, Σ).
A classical issue with GP sampling is that the factorization of ΣM Mbecomes
ill-conditioned and computationally expensive for large values of M . Since in practice M ≈ 107, a regular matrix factorization would not be feasible. To make
the problem tractable, we take advantage of the regular grid structure of the image and make the additional assumption that periodic boundary conditions on the image apply. In this case, ΣM Mis a Block Circulant with Circulant Blocks
(BCCB) matrix such that each row of ΣM M is a periodic shift of the first row
of ΣM M, C ∈ RM. C can be seen as an image of M voxels, whose voxel value is
the evaluation of the square exponential covariance for every shift present in the image. Theoretical results on the BCCB matrix spectral decomposition allow for a straightforward computation of ΣM M = F−1diag(FC)F, where F is the M × M discrete Fourier transform matrix. Hence, the eigenvalues of ΣM M are the discrete Fourier transform of C. As such, if z1, z2∼ N (0, I) i.i.d, then the real
and imaginary part of Fpdiag(FC)(z1+ iz2) are two independent samples from
the GP [9]. This can be efficiently computed using the Fast Fourier Transform without storing F.
4
Results
4.1 Parameter Setting
In the proposed approach, segmentation sampling depends on the scale h of the gradient operator, the parameter γ of the geodesic map, and the parameters ω0
and ω1of the covariance function. The parameter h depends on the level of noise
in the image (typically chosen as 1 voxel size) whereas γ controls the importance of the geodesic term. In our experiments, we set γ = 100/E(I), where E(I) is the mean of the image. Parameter w1controls the smoothness scale of the structure,
and is chosen as the radius of the equivalent sphere given the volume V of the ROI: w1= (4π3V )
1
3. Finally ω0 controls the variability around the mean shape: the greater ω0, the greater the variability. Such variability may be practically
Fig. 3: From left to right, mean µ of the GP and three samples from GP(µ, Σ). The clinician segmentation is outlined in red, the GPSSI samples are outlined in orange.
quantified for instance in terms of mean DICE index between any pair of expert segmentations. In such case, it is easy to find ω0corresponding to a given DICE
score (see Fig. 4). This approach offers an intuitive way to semi-automatically set the parameter ω0. Instead of DICE score, one could also use quantiles of
histograms of symmetric distances between contours.
4.2 Segmentation Sampling
Samples of the 2D synthetic segmentation case can be seen on Fig. 2 with ω0= 38
corresponding to an inter sample DICE of 90%. Samples are coherent with the visible image boundary since most samples do not include highly contrasted (black) regions of the image but instead invade low contrast regions of the image. Sampling of liver segmentation in CT image is shown in Fig. 3 with ω0= 4
corresponding to an inter sample DICE index of 88%. The generation of each sample takes less than 1s on a PC laptop despite the size of the image (256 × 256 × 104). Samples tend to leak on structures with similar intensity as the liver parenchyma.
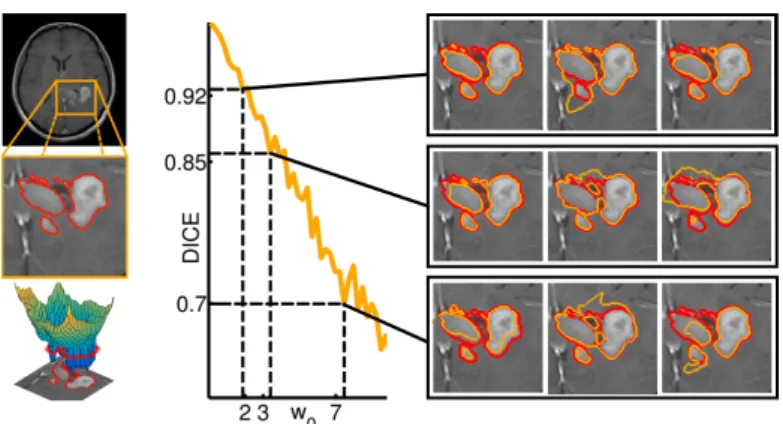
Segmentation sampling was also performed on a 3D T1 post contrast MRI (T1Gd MRI) where the proliferative part (active rim) of a grade IV glioma was segmented by an expert (Fig. 4 left). The strong correlation between the covariance parameter ω0 and the inter-sample DICE coefficient was computed
after generating 40 samples for each value of ω0 (Fig. 4 right). Thus the user
may easily choose ω0 as a function of the desired DICE index.
Note that the likelihood of samples generated from GP(µ, Σ) is not very informative as it is computed over the whole image and not just the generated contour.
5
Tumor Delineation Uncertainty in Radiotherapy
The proposed method is applied to the uncertainty quantification of radiotherapy planning. The standard of care for grade IV gliomas (Fig. 4) is the delivery of 60 Gray (Gy) to the Clinical Target Volume (CTV) which is defined as a 2-3cm extension of the Gross Tumor Volume (GTV) visible on a T1Gd MRI [10]. For the patient shown in Fig. 4, 40 segmentations of the GTV are sampled from a
Fig. 4: (Left) Segmentation of brain tumor active rim from T1 MR image with Gadolinium contrast agent; (Right) Relationship between the parameter ω0and
the inter-sample DICE score. The clinician segmentation is outlined in red, the GPSSI samples are outlined in orange. When ω0 increases, the inter-sample
DICE score decreases.
given segmentation with parameter ω0 set to achieve a mean DICE coefficient
of 85% between the sampled segmentations (Fig. 4). For each sample, a CTV is generated by considering a 2cm isotropic extension taking into account the natural barriers of the tumor progression (ventricles and falx cerebri).
Fig. 5 shows the mean target dose and its standard deviation derived from the 40 sampled CTVs. Several strategies could be applied to take into account the uncertainty in the GTV delineation. Generally, radiotherapy planning has to find a compromise between delivering radiation to the tumor, and avoiding dose to radiosensitive tissues. Visualization of dose uncertainty may guide the physician in this process. For example, the radiation dose could be reduced in regions of high uncertainty if this allows for dose reductions in radiosensitive organs, and thereby reduces the risk of side effects substantially. Technically, the standard deviation of the target dose could be used in the optimization of the radiation beams to weight differently voxels at the border of the CTV where the dose target is less certain. Moreover, it is important to visualize areas that represent tumor with near certainty and should be treated to the prescribed dose. In the long term, tumor segmentation samples could be used for radiotherapy planning based on models of tumor control probability (TCP).
6
Conclusion
In this paper, an original image segmentation sampling framework has been pro-posed to generate plausible segmentations close to a given one. The approach leads to spatially smooth contours that take into account the presence of salient features of the ROI in the image. Samples are efficiently generated, with a vari-ability around a reference segmentation easily controlled by a single scalar.
Fig. 5: (Left) Original GTV in red and CTV in blue overlaid on the T1Gd MRI; (Middle) Mean target dose from 40 samples (ω1= 19, ω0= 4 ); (Right) Standard
deviation of the target dose.
Future work will further explore the incorporation of uncertainty in the ra-diotherapy dose planning. The proposed method could have several additional applications for instance to produce consensus segmentations from several ex-pert ones. It could also be used to assess the confidence of the performance of segmentation algorithms in the context of segmentation challenges, by providing several likely segmentations around the ground truth segmentations.
Acknowledgments. Part of this work was funded by the European Research Council through the ERC Advanced Grant MedYMA 2011-291080.
References
1. Fan, A.C., Fisher III, J.W., Wells III, W.M., Levitt, J.J., Willsky, A.S.: MCMC curve sampling for image segmentation. In: MICCAI 2007. Springer (2007) 477–485 2. Warfield, S.K., Zou, K.H., Wells, W.M.: Simultaneous truth and performance level estimation (STAPLE): an algorithm for the validation of image segmentation. Medical Imaging, IEEE Transactions on 23(7) (2004) 903–921
3. Pohl, K.M., Fisher, J., Bouix, S., Shenton, M., McCarley, R.W., Grimson, W.E.L., Kikinis, R., Wells, W.M.: Using the logarithm of odds to define a vector space on probabilistic atlases. Medical Image Analysis 11(5) (2007) 465–477
4. Sabuncu, M.R., Yeo, B.T., Van Leemput, K., Fischl, B., Golland, P.: A genera-tive model for image segmentation based on label fusion. Medical Imaging, IEEE Transactions on 29(10) (2010) 1714–1729
5. Williams, O., Fitzgibbon, A.: Gaussian process implicit surfaces. Gaussian Proc. in Practice (2007)
6. Gerardo-Castro, M.P., Peynot, T., Ramos, F.: Laser-radar data fusion with Gaus-sian process implicit surfaces. In Corke, P., Mejias, L., Roberts, J., eds.: The 9th Int. Conf. on Field and Service Robotics, Brisbane, Australia (2013)
7. Criminisi, A., Sharp, T., Blake, A.: Geos: Geodesic image segmentation. In: Com-puter Vision–ECCV 2008. Springer (2008) 99–112
8. Rasmussen, C.E.: Gaussian processes for machine learning. (2006) 9. Kozintsev, B.: Computations with Gaussian random fields. (1999)
10. Mason, W., Del Maestro, R., Eisenstat, D., Forsyth, P., Fulton, D., Laperri`ere, N., Macdonald, D., Perry, J., Thiessen, B., Committee, C.G.R., et al.: Canadian recommendations for the treatment of glioblastoma multiforme. Current Oncology 14(3) (2007) 110