HAL Id: hal-00119344
https://hal.archives-ouvertes.fr/hal-00119344
Preprint submitted on 8 Dec 2006
HAL is a multi-disciplinary open access
archive for the deposit and dissemination of
sci-entific research documents, whether they are
pub-lished or not. The documents may come from
teaching and research institutions in France or
abroad, or from public or private research centers.
L’archive ouverte pluridisciplinaire HAL, est
destinée au dépôt et à la diffusion de documents
scientifiques de niveau recherche, publiés ou non,
émanant des établissements d’enseignement et de
recherche français ou étrangers, des laboratoires
publics ou privés.
Deep imaging survey of the environment of Alpha
Centauri - II. CCD imaging with the NTT-SUSI2
camera
Pierre Kervella, Frédéric Thévenin
To cite this version:
Pierre Kervella, Frédéric Thévenin. Deep imaging survey of the environment of Alpha Centauri - II.
CCD imaging with the NTT-SUSI2 camera. 2006. �hal-00119344�
hal-00119344, version 1 - 8 Dec 2006
December 8, 2006
Deep imaging survey of the environment of
α
Centauri
(Research Note)
II. CCD imaging with the NTT-SUSI2 camera
P. Kervella
1and F. Th´evenin
21 LESIA, UMR 8109, Observatoire de Paris-Meudon, 5, place Jules Janssen, F-92195 Meudon Cedex, France 2 Laboratoire Cassiop´ee, Observatoire de la Cˆote d’Azur, BP 4229, F-06304 Nice Cedex 4, France
Received ; Accepted
ABSTRACT
Context.Thanks to its proximity, α Centauri is an outstanding target for an imaging search for extrasolar planets.
Aims.We searched for faint comoving companions to α Cen located at angular distances of a few tens of arcseconds, up to 2-3 arcmin.
Methods.We obtained CCD images from the NTT-SUSI2 instrument in the Bessel V, R, I, and Z bands, and archive data from 2MASS.
Results.We present a catalogue of the detected objects inside a 5.5 arcmin box around this star. A total of 4313 sources down to mV ≈24 and
mI≈22 were detected in the SUSI2 images. The infrared photometry of part of these sources has been extracted from the 2MASS images.
Conclusions.No comoving companion to α Centauri were detected between 100 and 300 AU, down to a maximum mass of ≈15 times Jupiter. We also mostly exclude the presence of a companion more massive than 30 MJbetween 50 and 100 AU.
Key words.Stars: individual: α Cen, planetary systems, Stars: imaging, solar neighbourhood, Astronomical data bases: miscellaneous
1. Introduction
Our closest stellar neighbour, the α Cen visual triple star (d = 1.34 pc), is an extremely attractive target for extrasolar planet detection. The main components α Cen A (HD 128620) and B (HD 128621) are G2V and K1V solar-like stars, while the third member is the red dwarf Proxima (M5.5V). In all imag-ing planet searches, the main difficulty is to retrieve the plane-tary signal in the bright diffuse halo from the star. As discussed in Paper I (Kervella et al. 2006), there are indications that the gravitational mass of α Cen B could be higher than its modeled mass. For these reasons, we engaged in a search for compan-ions to α Cen at two different angular scales: a few arcseconds, using adaptive optics (Paper I), and a few tens of arcseconds, using CCD imaging (present work). To our knowledge, this is the first wide-field search for companions to α Cen.
2. Observations
Very close to the two stars, within a radius of about 20”, adap-tive optics imaging allows to reach the best sensitivity. At dis-tances of more than 20”, the diffused light is less of a problem, and atmosphere limited imaging is most cost-effective solution. We thus observed α Cen using ESO’s 3.6 m NTT, equipped
Send offprint requests to: P. Kervella
Correspondence to: Pierre.Kervella@obspm.fr
with the SUperb Seeing Imager 2 (SUSI2). This instrument is based on a mosaic of two 2k×4k thinned EEV CCDs (15 µm pixels). In order to avoid an heavy saturation of the detector, we positioned the α Cen pair aligned within the 8 arcsec gap be-tween the two detectors. The Nasmyth adapter of the telescope was rotated to align the two stars with the direction of the gap. The pixel scale of SUSI2 is 0.0805 ”/pixel, therefore providing an excellent sampling of the point spread function. We obtained a series of exposures through four filters, Bessel V, R, I, and Z1, in order to be able to confirm potential companions based on their colors. The individual exposures times were short, typi-cally 30 to 60 s, to limit the saturation of the detector to a small area around α Cen. The journal of the SUSI2 observations is presented in Table 1. The total shutter open time obtained on
αCen with SUSI2 in all bands reaches almost 4 hours. In order to obtain infrared photometry for part of the sources detected in the SUSI2 images, we retrieved from the IPAC archive2 the FITS images from the 2MASS survey (Skrutskie et al. 2006) covering the field of view of our SUSI2 images.The selected images were all obtained in early 2000.
1 The transmission curves of the SUSI2 filters are available from
http://www.ls.eso.org/lasilla/sciops/ntt/susi/docs/SUSIfilters.html
2 P. Kervella & F. Th´evenin: CCD survey of the environment of α Centauri (RN)
Table 1. Log of the SUSI2 observations of α Cen. The
indi-cated UT time corresponds to the middle of the exposures, θ is the FWHM of the point spread function of the composite im-ages, and AM is the airmass. The observations of 26 Feb 2004 were excluded due to poor seeing.
Date UT Filter Total exp. (s) θ(”) AM 2004-02-25 6:40 R 1185 0.74 1.30 2004-02-26 7:48 V 555 2.67 1.20 2004-02-29 6:31 I 2010 0.81 1.29 2004-02-29 7:54 V 1305 0.84 1.19 2004-04-02 2:55 Z 2360 0.89 1.51 2004-04-02 4:21 V 1305 1.01 1.29 2004-04-02 5:49 I 2010 0.97 1.19 2006-04-11 8:29 I 1649 1.01 1.30 2006-08-17 1:22 I 1649 0.65 1.49 3. Data reduction
3.1. Raw data processing and astrometry
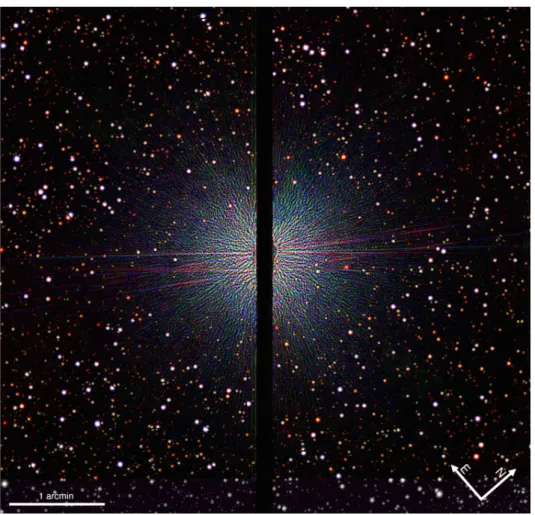
We applied the standard CCD image processing steps to our SUSI2 images, using IRAF: bias subtraction, flat-fielding, bad pixel masking. The 2MASS images are available fully cali-brated from the IPAC archive. The resulting SUSI2 band image is presented in Fig. 1, where the VRI images have been mapped to the blue, green and red colors. The lower ≈10% area of this image is shown in grey levels as only two colors are avail-able. The astrometric calibration of our SUSI2 images has been obtained by matching the coordinates of the brightest sources with their counterparts in the 2MASS images. The astromet-ric accuracy of the 2MASS images is about 0.1” (Skrutskie et al. 2006). Due to the presence of stronger diffused light in the visible, we estimate our astrometric uncertainty at 0.2” over the SUSI2 field, therefore this astrometric calibration method is sufficient for our purpose.
3.2. Sources extraction
The SUSI2 sources were extracted using the SExtractor tool (Bertin & Arnouts 1996), completed by a manual selection of the sources close to α Cen. We applied the same hybrid selec-tion procedure on the 2MASS images. We then obtained the photometry of the sources using IRAF and 12 pixel apertures for SUSI2 (1” radius). This relatively small aperture is justified by the variable background from the diffused light of α Cen and the relative crowding of the field. For the 2MASS images, we used 3” apertures. The SUSI2 airmass coefficients were taken as the average values for La Silla (ESO User’s Manual 1993, see also Burki et al. 1995): kV = 0.11, kR = 0.07, kI = 0.02,
and kZ = 0.01 mag/airmass. In all cases, the airmass
correc-tions are negligible, with values below 0.04 mag. The aperture corrections for SUSI2 were determined on a bright, isolated star located relatively far from α Cen to ensure a flat sky back-ground. They were found to range between 0.20 and 0.42 mag depending on the color and the observation epoch. The pho-tometric zero points were taken from ESO’s routine instrument monitoring program for SUSI2, and from the image headers for 2MASS. Considering the difficulty of estimating accurately the
sky background level, we chose to add a systematic ±0.20 mag uncertainty to the SUSI2 magnitudes. For the 2MASS images, we applied the aperture correction recommended by IPAC for a 3” aperture, i.e. 0.05 ± 0.02 mag in all three JHK bands.
The catalogue of the objects detected in the SUSI2 and 2MASS images is available in electronic format3. A total of
4313 sources were identified on the SUSI2 images, with 391 recovered in the 2MASS images (9.1%). Among the detected background sources, several objects present extreme color in-dices. We checked that their presence is expected based on Galactic models (Robin et al. 2003).
4. Sensitivity and companion limits
To define our practical limiting magnitudes, we chose to con-sider the median magnitude of the detected sources. This def-inition has the advantage to give an empirical, statistically meaningful definition of the sensitivity, that can be expressed as a function of the distance to the two bright stars by com-puting the median within angular distance bins. We computed the median magnitude of the detected objects in the SUSI2
VRIZ bands for four angular distance bins: 23 − 50”, 50 − 100”,
100−150”, 150−200” and 200−236”. In all bands, the limiting magnitudes (as defined above) at large angular distances are in the 20-22 range, with the faintest objects at magnitudes of 23-25. The limiting magnitudes decrease to 16-18 for an augular separation of 35”. For the 2MASS images, the limiting mag-nitudes as defined above are13-14 for the JHK bands at large angular separations (the faintest sources are at 15-16).
We carefully searched our SUSI2 images for moving sources using blinking and image subtraction techniques, with-out success. Using planetary models from Baraffe et al. (2003) for the age of α Cen (5 Gyr, from Th´evenin et al. 2002, see also Eggenberger et al. 2004), we can estimate the maximum mass of the possible companions. The most constraining limits are provided by our I band images. The Z filter did not provide a significant improvement in sensitivity, due to the cutoff of the CCD quantum efficiency. The I band provides in addition a bet-ter defined average wavelength that makes the comparison with model magnitudes more accurate. Fig. 2 gives the sensitivity of our search in terms of companion mass. We can set a maximum mass of ≈ 15 MJfor projected separations larger than 100 AU.
This limit can be extended down to 10 MJif we consider our
faintest detected objects. Between 50 and 100 AU, the presence of a companion with a mass larger than about 30 MJis highly
unlikely.
5. Conclusion
From deep CCD images of α Cen, we did not identify any co-moving companion. Within the explored area, this negative re-sult sets an upper mass limit of 15-30 MJto the possible
com-panions orbiting α Cen B or the pair, for separations of 50-300 AU. When combined with existing radial velocity searches (e.g. Endl et al. 2001) and our adaptive optics results (see
Fig. 1. Tricolor filtered image from the SUSI2 images of α Cen (February-April 2004). 0 10 20 30 40 50 0 50 100 150 200 250 300
Projected distance to ! Cen (AU)
Ma xi mu m ma ss (M J )
Fig. 2. Maximum mass of the possible companions orbiting
αCen. The solid curve corresponds to the model masses by Baraffe et al. (2003) for our SUSI2 limiting magnitudes in the
I band. The dashed curve corresponds to the faintest detected
objects.
Fig. 7 in Paper I), this mostly excludes the presence of a 20-30 MJ companion within 300 AU. This non-detection should
have consequences on the modeling of the stellar interior of
αCen in particular, but also of other stars. In order to settle the debate on the masses of α Cen (and in particular of B), one should now check one by one the hypotheses made for the calibration of this system. This also implies that the new abundances of Asplund et al. (2004) should be considered as soon as possible. As an illustration of the importance of this
parameter, it has been debated recently a possible underesti-mate of the Ne solar abundance that could counter balance the effect of the decrease of the solar opacity due to the decrease of the oxygen abundance from 3D models (Young 2005). Liefke & Schmitt (2006) have published a new value of the chemi-cal abundance ratio of Ne/O based on coronal studies. These recent results will be advantageously introduced in the deter-mination of the metallicity of the α Cen binary to better model the evolutionnary track of both stars.
Acknowledgements. Based on observations made with ESO Telescopes at La Silla under programs 272.C-5010 and 077.C-0587.
References
Asplund, M., Grevesse, N., Sauval, A. J., Allende Prieto, C., & Kiselman, D. 2004, A&A, 417, 751
Baraffe, I., Chabrier, G., Barman, T. S., Allard, F., & Hauschildt, P. H. 2003, A&A, 402, 701
Bertin, E. & Arnouts, S. 1996, A&AS, 117, 393
Burki, G., Rufener, F., Burnet, M., et al. 1995, A&AS, 112, 383 Eggenberger, A., Charbonnel, C., Talon, S., et al. 2004, A&A, 417,
235
Endl, M., K¨urster, M., Els, S., Hatzes, A. P., & Cochran, W. D. 2001, A&A, 374, 675
Kervella, P., Th´evenin F., Coud´e du Foresto, V., & Mignard, F. 2006, A&A, in press (Paper I)
4 P. Kervella & F. Th´evenin: CCD survey of the environment of α Centauri (RN) Liefke, C., Schmitt, J. H. M. M. 2006, A&A, in press,
astro-ph/0609015
Robin, A. C., Reyl´e, C., Derri`ere, S., Picaud, S. 2003, A&A, 409, 523. Erratum 2004, A&A, 416, 1572
Skrutskie, R. M., Cutri, R., Stiening, M. D., et al. 2006, AJ, 131, 1163 Th´evenin, F., Provost, J., Morel, P., et al. 2002, A&A, 392, L9 Young, P. R. 2005, A&A, 444, L45
List of Objects
‘HD 128620’ on page 1 ‘HD 128621’ on page 1
![[PDF] Cours sur les Evolutions du Fortran pdf | Formation informatique](data:image/gif;base64,R0lGODlhAQABAIAAAP///wAAACH5BAEAAAAALAAAAAABAAEAAAICRAEAOw==)